Page is loading ...

User Guide
REFRIGERATION AND
AIR CONDITIONING
Graphical Interface Guide
AK-EM 100

© Danfoss 05-2011
AK-EM 100 User guide2 RC8BY402
Table of Contents
Table of Contents ............................................................................................. 2
AK-EM 100 Introduction................................................................................. 3
Description of system ............................................................................. 3
Advantages of AK-EM 100 ..................................................................... 3
List of menu options ...................................................................................... 4
LogOn ................................................................................................................... 5
Logging onto the AK-EM 100 ............................................................... 5
1. System Functions ......................................................................................... 6
1.1 Navigation ............................................................................................ 6
1.2 Common Options .............................................................................. 6
1.2.1 Export to Excel ........................................................................ 6
1.2.2 Graph Options ........................................................................ 6
1.2.3 Print Page .................................................................................. 7
1.2.4 Email Friendly Format ........................................................... 7
1.2.5 Add to Favourites ................................................................... 7
2. The Store Mimic ............................................................................................ 8
2.1 Introduction ......................................................................................... 8
2.2 Navigation ............................................................................................ 8
2.3 Viewing Data ....................................................................................... 8
2.4 Alarm Checking .................................................................................. 8
2.5 Managing Alarms............................................................................... 8
2.6 Current Alarm List .............................................................................. 9
2.6.1 Assigning/accepting an Alarm .......................................... 9
2.6.2 Add Comment ......................................................................... 9
2.6.3 Closing an Alarm ..................................................................... 9
2.6.4 Accept/Close All ....................................................................10
2.6.5 Automatically cleared alarms ...........................................10
2.6.6. Back button ............................................................................10
2.7 Right Click Menu ..............................................................................10
2.7.1 Graph Report ..........................................................................10
2.7.2 HACCP Report ........................................................................10
2.7.3 Manual Defrost ......................................................................10
2.7.4 Main Switch ............................................................................10
2.7.5 Basic Asset Details ...............................................................11
2.7.6 Advanced Asset Details ......................................................12
2.7.7 Hide Alarms ............................................................................12
2.7.8 Current Alarms .......................................................................13
2.7.9 Trends ........................................................................................13
3. Store Operations ........................................................................................14
3.1 Introduction .......................................................................................14
3.2 Store Options ....................................................................................14
3.2.1 Top Ten ......................................................................................14
3.2.2 Asset League ..........................................................................14
3.2.3 Reason League ......................................................................15
3.2.4 HACCP .......................................................................................15
3.3 Asset Options ....................................................................................15
3.3.1 Current Alarms .......................................................................15
3.3.2 Graph ........................................................................................15
3.3.3 Current Status ........................................................................15
3.3.4 Basic and Advanced Asset Details ..................................16
3.3.5 Hide Alarms ............................................................................16
3.3.6 Configure .................................................................................16
4. HACCP Reports ...........................................................................................18
5. Historical Alarms ........................................................................................19
5.1 Introduction .......................................................................................19
5.2 Report Types ......................................................................................19
5.2.1 Site Totals .................................................................................19
5.2.2 Alarm Action ...........................................................................20
5.2.3 Top Ten ......................................................................................20
5.2.4 Alarm List .................................................................................20
5.2.5 Asset League ..........................................................................21
5.2.6 Reason League ......................................................................21
5.2.7 Alarm Analysis .......................................................................21
5.2.8 Current Alarm List .................................................................22
6. Trending ........................................................................................................23
6.1 Introduction .......................................................................................23
6.2 Number of Trends ............................................................................24
7. Graph Reports .............................................................................................25
7.1 Introduction .......................................................................................25
7.2 Fetch Log Data ..................................................................................26
7.3 Saving to CSV ....................................................................................26
8. Energy Consumption................................................................................27
9. Home Page ...................................................................................................28
9.1. Your Info .............................................................................................28
9.2 System Info........................................................................................28
9.3. News ....................................................................................................28
9.4. Your Favourites ................................................................................28
10. Administration..........................................................................................29
10.1 Favourites and Settings ...............................................................29
10.2 Event Log ..........................................................................................29
10.3 Drive Space Availability ...............................................................30
11. User Manuals .............................................................................................31
12. AK-EM 100 Technical Specification ...................................................32
13. Quick Task List ..........................................................................................33
13.1 Service and Diagnostic ................................................................34
Change History ...............................................................................................35

© Danfoss 05-2011
3AK-EM 100 User guide
RC8BY402
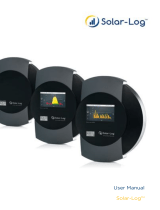
The AK-EM 100 provides a web based graphical user interface of a store which allows a range of daily
users to monitor data, alarms and reports, either locally or remotely, regarding all of their monitored
refrigeration equipment.
A store’s refrigeration equipment is monitored continuously by controllers (AK, AKC, EKC), whose data is
fed and interpreted via a System Manager or AKA Gateway into the AK-EM 100 device. The data is then
made available via the network onto the web, where the AK-EM 100 graphical interface is run.
• complete overview of store
• alarm monitoring
• provides up-to-date information in real time
• multi-user access
• easy to use web based front end
• allows staff to focus on key daily tasks
AK-EM 100 Introduction
Description of system
Advantages of AK-EM 100

© Danfoss 05-2011
AK-EM 100 User guide4 RC8BY402
List of menu options
Certain functionality will be made available / unavailable
according to the user’s access rights. This also applies to the menu
system. Here, particular options like Comms and Technical Admin,
would normally be inaccessible to a daily user.
Store Mimic - A graphical representation of the store which
contains all of the assets and their points of measurement. This
is where the mimic templates and images are uploaded onto
the system, and where points are configured for display.
Store Operations - Store Operations contains information
relating to both the overall store and it’s individual assets.
View several types of reports, graphs, check the current
alarm status, and configure asset details, as well as carry out
some commands such as defrosting or switching on/off a
refrigeration unit.
HACCP Reports - Provides a HACCP report for all of the assets
measurement points within the store. These are set up using
some of the administration options, such as Food Types and
Food Types Configuration.
Historical Alarms - Depending on access rights, Historical
Alarms provides seven types of reports, ranging from the total
number of alarms to the worst performing asset.
Trending - Depicts a graph of a point(s) which updates
automatically to provide live data for a set period of time. Used
for closely monitoring points.
Graphs - Displays a graph for one or more points over a user
specified time. Points
Commission Toolbox - This is where the majority of the
configuration between the AK-EM 100 and the gateway takes
place.
Administration - The administration section contains
different levels depending on access rights of the daily user.
Commissioners and Engineers would have full access to the
section, where they can set up users and groups, configure the
system, change the set points of assets.
User Manual - Download the user and commissioning
manuals.
Home - Link to the user’s Home page.
Contact Us - Link to Danfoss’s contact details.
Logout - Log off from the AK-EM 100.
Store Name - Displays the Store’s name.
Current Alarm List - Indicates there are alarms. Shows the
latest alarm when the mouse is placed over it. Clicking on the
icon takes you to the Current Alarm list page.
Network Communication - Displays whether or not there is
a connection to the network. If there is not, an alarm bell icon
will be displayed.
MPH Performance - Indicates that an MPH may be performing
slower than normal - such as a data run being performed for
the first time. This will disappear once the MPH has run its
course and is back to normal. It could also indicate that the
MPH has stopped completely.

© Danfoss 05-2011
5AK-EM 100 User guide
RC8BY402
LogOn
When the login page is accessed, you will be prompted to enter your user name and password to access
the system.
Logging onto the AK-EM 100
Once logged in, your homepage will depend on which page has been allocated to you by an
administrator.

© Danfoss 05-2011
AK-EM 100 User guide6 RC8BY402
Due to the nature of the interface being web based, many of the standard web browser techniques can be
employed through operation. These include the typical navigation buttons on the browser’s toolbar; using
text or images as hyperlinks; and a menu system to navigate through the site.
Throughout the site, certain icons will appear which will allow you to perform certain actions against
graphs, reports etc.
These are:
1.2.1 Export to Excel
Exports tabular data into an Excel spreadsheet, such as Alarm List or HACCP information.
Firefox does not support the ActiveX control so the export function is not available.
Internet Explorer may require some minor changes to allow the export to function correctly.
This can be done by selecting Tools/Internet Options/Security from the web browser toolbar, and
then selecting the custom level option.
When done so, scroll down the Security Settings and select the ‘Prompt’ option of the ‘Initialise and
script ActiveX controls not marked as safe’.
1.2.2 Graph Options
There are several additional features which aid the viewing of graphs, all of which need the option selected
first.
Pointer - Click and hold the pointer on a graph and then move it left or right allows you to move along
the X axis of the graph, providing there is adequate space to move along. Hovering over a point on the
graph will bring up a tooltip with the parameter name and reading.
Zoom In - While on the graph, click the mouse once to zoom in a set distance. Similarly, click and
hold the mouse to zoom into a specific area of the graph. This is dependant on which Zoom Mode is
selected (see below).
Zoom Out - While on the graph, click the mouse once to zoom out a set distance.
X-Axis and Y-Axis Zoomable - Zoom in with both axes unrestricted.
X-Axis Zoomable / Y-Axis Auto Scaled - Zoom in with only the X-Axis unrestricted, as the Y-axis is fixed.
1. System Functions
1.1 Navigation
1.2 Common Options

© Danfoss 05-2011
7AK-EM 100 User guide
RC8BY402
1.2.3 Print Page
In order to correctly print the colours associated with temperature levels in HACCP reports, the browser
settings must be changed.
Go into your web browser toolbar and select:
Internet Explorer 7 - Tools/Internet Options/Advanced…
Internet Explorer 8 - File/Page Setup…
Internet Explorer 9 - Tools/Print/Page Setup…
Mozilla Firefox 4 - File/Page Setup…
…and make sure the option “Print background colours and images” is ticked.
1.2.4 Email Friendly Format
Formats the page in a separate window so it can be emailed.
1.2.5 Add to Favourites
Adds a selected graph or report to the favourites section of the homepage.
Adding a Report to Your Favourites
When a graph or HACCP report needs to be stored, it can be saved to the home page for reference.
To store, click the Add to favourite icon.
This will bring up a dialogue box, where you will be prompted to enter a name for the favourite. There
are two options as to which type of time period the report will take: Fixed Time or Rolling Time.
Fixed Time - when the graph or report is stored, it will be saved at the specific time period chosen.
This option is best used when certain data needs to be looked at again, such as an alarm list or
temperature curve.
Rolling Time - when the graph or report is accessed from the stored favourites, then it will
generate with the latest information available. This option is most useful when you want to carry
out common tasks regarding the latest information of an asset without having to go through the
process of generation.
When finished, click the ’Add To Favourites’ button.
The report will then be stored and made available to view on the user’s home page.
Headers
In some reports featuring tables of data, such as the Alarm List, clicking on a column header will sort the
data alphabetically or numerically.
User Rights
Due to different users receiving different access rights (what they can and can’t access), some of the
options and functions which appear throughout the document maybe omitted.
Similarly, some of the example images contained within this document may appear slightly different to
the actual screen display, and so any discrepancies between the two should be discarded.
User’s access rights are configured by an administrator.
**Data Removal**
Please note that old data gets removed automatically after 2 years for all HACCP data, and 1 year for all
other data.

© Danfoss 05-2011
AK-EM 100 User guide8 RC8BY402
Navigation around the Mimics is done by clicking on links which will allow you to drill down onto another
level of the store (such as an individual freezer) or a link, such as a report or Alarm list.
The store mimic displays all of the current asset readings for the store. Running the mouse over a reading
will produce a tooltip which displays the name of the asset name and the parameter name.
If the asset is in an alarm state, it will be indicated by a swinging bell icon. Clicking on the icon will take
you to the Current Alarm list page for the asset. A static alarm icon indicates an alarm that has been
acknowledged and assigned to a user.
To view the table of current outstanding alarms for the whole store from the
mimic, click on the alarm bell icon. (The alarm bell icon can also be found on
the Store Operations page, as well as the Latest Alarm icon, which is beneath the
main menu.
When the mouse is hovered over the Last Alarm icon, it displays the time of the
alarm, the asset name, the reason for the alarm, and the Status. Clicking on it
also takes you to the Current Alarm list
The Store Mimic is a visual representation of a store which displays the configured readings of all the assets
and their controllers contained within the store. It provides an overall view of the store and its individual
assets in real time, providing up-to-date information regarding readings and setting, while also allowing
you to see at a glance if there are any assets in a state of alarm so that they can be acted upon quickly.
When you log on to the AK-EM 100, the store layout should already have been set up earlier by a
commissioner. The default page can be the Store Mimic, but this can be different depending on the
administrator’s configuration of the AK-EM 100 when adding users. The first image of the mimic will be the
top level image, which is a general overview of the store.
2.1 Introduction
2. The Store Mimic
2.4 Alarm Checking
2.2 Navigation
2.3 Viewing Data
2.5 Managing Alarms

© Danfoss 05-2011
9AK-EM 100 User guide
RC8BY402
The Current Alarm List contains a list of all outstanding alarms, as well as those alarms that have been
acknowledged but have yet to be closed. Each alarm has it’s own unique LogID, as well as the time of
alarm, the asset it’s associated with, the reason and its current status. Each alarm is colour coded to
indicate if it is critical (red circle) or cautionary (yellow triangle).
Putting a check mark in the ‘Show system alarms’ box will also display allsystem alarms, such as MPH’s or
Gateway problems.
2.6.1 Assigning/accepting an Alarm
1. From the Current Alarm List, select an individual alarm by clicking on the LogID to bring up that
alarm.
2. Then press the ‘Accept’ button to acknowledge the alarm and take responsibility of it. Once
acknowledged, its status will change to ‘Assigned’ and the swinging alarm icon on the mimic will
become stationary. If there is more than one alarm associated with the same asset that has not been
accepted, then the alarm icon will continue to animate until all alarms are assigned.
When accepted, take the necessary action regarding the alarm, such as alerting an engineer etc.
2.6.2 Add Comment
A comment can only be added to an alarm once it has been accepted by entering the comment in the
text field and pressing the ‘Save’ button.
You are also able to add a comment to all of the alarms listed by entering a comment in the field from
the main Current Alarm page and pressing the ‘Save’ button. The comment will then be applied to all
alarms. This option may be used when there are a few alarms which have occurred on the same asset.
2.6.3 Closing an Alarm
Once an alarm has been attended to (or automatically cleared), it is ready to be closed. Select the alarm
LogID to bring up the individual alarm and press the ‘Close Incident’ button, adding a comment if
necessary.
Then select a clearance reason (left) from the list and press the ‘Close Incident’ button. When closed, a
table will be displayed with the full history of the incident. When done, the alarm icon in the mimic will
disappear (as long as there are no more alarms for the asset), as well as from the Alarm List. It will now
2.6 Current Alarm List
- Critical Alarm
- Cautionary Alarm

© Danfoss 05-2011
AK-EM 100 User guide10 RC8BY402
When a parameter is right clicked, a menu appears where a variety of options can
be chosen. Depending on your access rights, the options in the menu may differ
slightly to the example shown right.
Produces a graph which includes all of the parameters for the whole asset. The
parameters available for the graph are dependant on what are logged in the
Gateway.
(Refer to section 7 for more information regarding Graphs.)
This produces a HACCP report for the chosen asset, showing the representative
temperatures for the current day.
(Refer to the section 4 for more information on HACCP Reports.)
A refrigeration unit can be set to a manual defrost directly from the Store Mimic.
Selecting the option displays a confirmation screen about the defrost, asking if you
wish to carry out the action. Once affirmed, the unit will start defrosting. This option should only be used
when absolutely necessary.
This option will only be available once a switch has been setup for the asset in the administration section.
If it hasn’t been set up, then a message saying the Manual Defrost switch has not been identified will be
displayed.
If you need to turn off the switch off the asset e.g. for maintenance, then you can use the Main Switch
option to do so. When selected, you are presented with a dialogue box which displays the current state of
the main switch, the new state you will change it to, and whether you want to continue or abort.
Like the Manual Defrost (2.7.3), the Main Switch will only be able to work if it has been configured by
a commissioner. A way of recognising whether the switch is configured on the mimic is working or
appear on the Historical Alarm List.
(Refer to section 5 for more details on Historical Alarms.)
2.6.4 Accept/Close All
Pressing the ‘Accept All’ or ‘Close All’ button will accept or close all of the current alarms listed in one action,
therefore cancelling out all of the alarms for all assets.
2.6.5 Automatically cleared alarms
There will be occasions when alarms will automatically clear themselves. For example, if a temperature
reading was to lower, it would trigger an alarm. If no action were to be taken against it, and the
temperature was to go back to a safe level, then the alarm would automatically clear itself. It would still
appear in the Alarm List, where it could be checked out by an engineer, comments can be added to it, or it
could be closed.
2.6.6. Back button
Once alarms have been commented on, assigned or completed, press the Back button to navigate to the
updated alarm list or alarm details pages. Pressing the back button on the browsers toolbar will take you
back to the previous page.
- Automatically cleared
alarms
2.7 Right Click Menu
2.7.1 Graph Report
2.7.2 HACCP Report
2.7.3 Manual Defrost
2.7.4 Main Switch

© Danfoss 05-2011
11AK-EM 100 User guide
RC8BY402
not is to see if the switch’s parameter reading has an ‘On/Off’ state attached to it (depending on the
enumeration).
2.7.5 Basic Asset Details
Access to the Basic and Advanced Details pages are dependant on user access rights.
The Basic Details page gives access to parameter readings and settings belonging to an asset’s
controllers. What appears on the Basic Asset Details depends on what the Commissioner has allowed
during the setup process.
Basic actions can also be performed from this page, such as activating switches, performing manual
defrosts, or changing alarm levels. Editable settings are identified by fields with a white background,
where you can change a setting by clicking on the parameter and entering the new value.
1. Select the asset from the Asset drop down list, or use the buttons to scroll through the assets.
2. When an asset is selected, click on the parameter row with the editable setting.
3. Enter the new value or setting in the text field. Data entry works off a predictive text to aid the
user in entering the correct text command. Text fields with a pink colour indicate that an incorrect
variable has been entered i.e. a number instead of a word.
4. Once selected, it will take a few moments to update the status.
The values are set up so that only the available options are those which apply to that parameter, such
as ‘On’ or ‘Off’ being available for a switch, or certain temperature levels is to be met before an alarm is
reached. Hovering over a reading will provide the Min and Max values.
Readings with ‘***’ indicate that the system is refreshing, and that the data will update in roughly 10 - 15
seconds.

© Danfoss 05-2011
AK-EM 100 User guide12 RC8BY402
2.7.6 Advanced Asset Details
Advanced Asset Details is similar to Basic Asset Details but it provides a broader range of settings and
measurements than the Basic Asset Details by including every parameter reading and setting for all
available assets.
An asset is made up of grouped headers which contain the parameters and setting of each one. Like the
Basic Asset Details section, the settings with an editable background are able to be changed and new
values entered.
1. Select the asset from the Asset drop down list, or use the buttons to scroll through the assets.
2. Select the header tab of the asset.
3. Click on the parameter setting with an editable text field.
4. Enter the new value or change state. Entering values work in the same manner as the Basic Details on
the previous page. When selecting a new state or value, the range will only include the minimum and
maximum settings or number of possible states.
5. Once selected, it will take a few moments to update the status.
Parameters are grouped logically under each tab. Settings are changed by clicking on a parameter value in
a field with a white background. Hovering over a reading will provide the Min and Max values.
Parameter reading will initially appear as ‘***’. This is because the system is constantly refreshing, and
should take about 15 seconds until the fields to update the values.
If an asset’s alarm needs to be disabled for any reason, then this option allows it to be ignored - made
invisible - for a set period of time. This maybe due to maintenance or servicing, and will save the asset
from appearing in a state of alarm in the Current Alarm List. The alarm itself is only invisible in terms of
being displayed in the mimic or the alarm list within the AK-EM 100 only; the alarm is still active in the
gateway.
When the Hide Alarm icon is selected for an asset, you are presented with a dialogue box asking for a
specified time. Choose a time from the drop down list and press the ‘Hide Alarm’ button.
When done so, the alarm icon in Store Operations changes to indicate that an asset is exempt for a certain
time period, which is displayed in the Hide Alarms column. To reset the asset before the time period runs
out, press the Hide Alarm icon and then the Show Alarms button.
The procedure for hiding and showing
alarms can be activated from the Store
mimic or Store Operations page.
2.7.7 Hide Alarms

© Danfoss 05-2011
13AK-EM 100 User guide
RC8BY402
2.7.8 Current Alarms
Alarms can be hidden from an asset either when the asset has current alarms or when there are no
alarms present. So that if you know an asset is going to be serviced for a period of time, then the alarms
can be hidden just before the work starts.
Provides a link to the Current Alarm List page, where alarms can be dealt with.
(Refer to the Current Alarm section on page 8 for more details).
2.7.9 Trends
Will take you to the Trending screen, where points can be looked at closer on a graph.
(Refer to Trending chapter 6 for more information.)

© Danfoss 05-2011
AK-EM 100 User guide14 RC8BY402
The Store Operations pages provides an easy to use summary of information regarding a store and the
assets contained within it. From here, you can access the current and historical status of the store and view
any alarm activities by clicking on the active hyperlinked icons. The top table contains information relating
to the store. The alarm bell icon in the Current Alarms columns indicates that there are alarms currently
active. Pressing on the icon will take you to the Current Alarms page.
Refer to section 2.5 for information regarding the current alarms.
The second table describes the individual assets which belong to the store. Again, the alarm bell icon
indicates that there are currently alarms activated regarding an asset, while pressing on the respective icon
will take you to the relevant screen for that asset.
A series of reports are available which allow you to drill down, for example, from a reason, to an asset, to an
individual alarm.
3.2.1 Top Ten
The Top Ten report lists the top ten worst performing
assets within the store for the current month,
based on the number of alarms they receive. The
page is broken down into two sections: critical and
cautionary alarms. Scrolling down the page reveals
the charts for both types of alarms, which are:
• Alarm Breakdown per asset
• The number of alarms per asset
• The alarm rate
The Top Ten report is a useful option as it provides
information at glance as to where the store is under
performing and what asset(s) needs to be looked at.
3.2.2 Asset League
This league refers to the total number of alarms per asset within
the store for the current month, based on the number of alarms
they receive.
Again, this is a useful option to quickly assess which assets are
performing badly overall.
Hint
Clicking on the section
of a chart (right) will
take you to the Alarm
list for the chosen asset.
Hint
Clicking on an asset will
display the each of the
alarms for that asset,
and then selecting
the LogID will further
display the incident log
for that alarm.
3.1 Introduction
3. Store Operations
3.2 Store Options

© Danfoss 05-2011
15AK-EM 100 User guide
RC8BY402
3.2.3 Reason League
This lists the most frequent reasons for the alarm, and operates the same way as described above for
the Asset League.
3.2.4 HACCP
The HACCP report provides average temperatures of the parameters belonging to the store’s assets
over a 24 hour period.
Refer to section 4 for more details on HACCP Reports.
3.3.1 Current Alarms
This has the same function of the Store’s Current Alarms, except it displays the alarms for the selected
asset only. Again, adding comments and closing the alarm can also be done from here, but only affects
the asset.
Refer to section 2.5 for acknowledging and closing alarms in the Current Alarm List.
3.3.2 Graph
Clicking on the graph icon will draw a graph for all of the parameters of the selected asset depicting
their performance over the last 24 hours.
3.3.3 Current Status
The Current Status lists all of
the controllers for the chosen
asset, and displays the latest
values for each and the time
it was taken. It can be used as
a means of checking the last
time a reading of a parameter
was taken.
Hint
Clicking on the LogID of
any alarm in the alarm
list will drill down to
the complete history of
that alarm. From there
you will be able to add a
comment to the alarm, or
close the alarm.
3.3 Asset Options

© Danfoss 05-2011
AK-EM 100 User guide16 RC8BY402
3.3.4 Basic and Advanced Asset Details
Refer to chapters 2.7.5 - 2.7.6 of the Store Mimic section for more information regarding these functions.
3.3.5 Hide Alarms
Refer to chapter 2.7.7 of the Store Mimic section for more information regarding this function.
3.3.6 Configure
Configures the settings for the parameters of each asset, by selecting which parameters of an asset can be
available for trending, HACCP reports, and configuring settings such as switches. This section should only
be accessible to administrators or commissioners, and so the details of this section will be brief . (Refer to
the Commissioner’s Guide for further details regarding configuration).
1. Select the asset from the drop down menu or scroll through using the arrows. The parameter groups
can be expanded/collapsed by either clicking on the individual ‘+’ symbol or using the ‘Expand All’
button at the top.
2. Select the group heading to edit by clicking on the ‘+’ to display the list of parameters.
3. Click in a parameter’s field to change the setting or value. Data entry works off a predictive text,
therefore aiding the user. Text fields with a pink colour indicate that an incorrect variable has been
entered i.e. a number instead of a word. New values entered off-line will display a (), indicating that
when switched online, they will be updated after a few seconds.
Display name - The Display Name can be edited and saved by entering a new or modifying the
existing name and pressing the ‘Return’ key. This will change the display name throughout the site,
such as in the Store Mimic, overiding the current DES file. Deleting the name entirely and pressing
‘Return’ will revert to the original name of the DES file.
Setting - This displays the current value of the setting. This can be changed manually if a text field
is available, such as increasing a time interval, turning something off, or adjusting a temperature
control. When entering a new value/setting, the field is predictive and will recognise the first letter
for the parameter e.g. a switch will recognise either ‘True’ or ‘False’. If, for example, a number is
entered in place of a letter, then the text field will change colour indicating a wrong value has been
entered. Similarly, if a wrong number is entered, such as a ‘-4a’, then the error warning will also
occur.
When a new value or setting is entered while ‘off line’, the new value will appear in brackets ‘***( )’
beside the old value, indicating that it will be updated once back ‘on line’. When it is online, it will
take a few seconds to update.
HACCP - HACCP points are automatically filtered during the set up of the log files. Those parameters
which have the function available will be made available for selection in any further HACCP reports
for that asset. The options available in the HACCP section are produced in the administration section
4.8, Food Types. Select which food type the parameter is linked to.
Trend - Like the HACCP settings, the trending option will be available if the parameters are selected
in the set up of the log files. If available, they can then be used for display in the graph trending
reports.

© Danfoss 05-2011
17AK-EM 100 User guide
RC8BY402
Asset Details - The default setting for all of the parameters is set to Advanced, as all parameters
for all assets will be made available for display in the Advanced Assets Details section. The choice
here is whether you wish the parameter to also be displayed in the Basic or Advanced Assets
Details section, or not at all. For instance, users can be configured to only see basic asset details
and the monitoring rights can be controlled with this setting.
Enumeration - Some parameters can have states of 2 or more, such as a switch or an EKC unit.
Select the enumeration state if required from the available options in the drop down menu.
When run, the parameter will be displayed according to the value and converted based on the
enumeration selected. The type of enumeration required is determined by the parameter’s
setting, where a boolean value (either true or false) would typically have a 2 state, whereas a
parameter with varying states could have many different enumeration values.
Units - Select the unit of measurement for the parameter from the drop-down list.

© Danfoss 05-2011
AK-EM 100 User guide18 RC8BY402
The Hazard Analysis Critical Control Point (HACCP) system of reports are there to provide the
most effective way for food businesses to ensure consumer protection with regards to food safety
management.
The report provides data over a set of assets which have previously been configured which
shows a series of points average reading over an hour, and the subsequent difference in range
from the configured minimum and maximum settings.
**Data Removal**
Please note that old data gets removed automatically after 2 years for all HACCP data, and 1 year for all
other data.
HACCP Report
The HACCP report is a report which covers any one day. It provides a history of the chosen asset(s) over
a 24 hour period and displays the average value of the setting per hour. These points in the HACCP
report are set by the commissioner during the initial setup of the AK-EM 100.
Procedure
1. Select the HACCP report from the Store Level Reports list, select a day to view by either entering
the day manually or choosing one from the calendar.
2. Select either ‘All Assets’ or an individual asset to display. Assets will only be displayed if their
parameters have been logged in the Gateway. Then press the Go button to display the report.
The subsequent table will show the average values spread out over 24 hours. The values are colour
coded in relation to the key provided, where the value is ‘+’ or ‘-’ the standard set point value.
The report contains the ‘Low’ and ‘High’ values for the point (set up in the administration section by the
commissioner), where each colour in the chart represents how much out of range the value is based on
the average temperature for the hour.
This type of report provides you with a complete view of an asset for any day, and can be used to
quickly see which assets are performing accurately as well as viewing the cycles of the assets, such as
defrosts times.
Refer to Print options in System Functions (page 7) for printing HACCP reports.
Hint
Clicking on any of the asset
names in the HACCP report
will produce a graph of the
asset and all of its points,
where the graph can then
be customised if required.
Refer to the System
Functions section for further
details regarding graph
functions.
Hint
HACCP reports can be
saved to the Favourites
section by clicking on
the favourites icon.
Refer to the System
Functions section for
further details on storing
reports.
4.1 Overview
4. HACCP Reports

© Danfoss 05-2011
19AK-EM 100 User guide
RC8BY402
The Historical Alarm Reports section refers to the number of alarms received to the store that have been
closed and displays them in a variety of different ways. There are eight report options available:
• Site Totals
• Alarm Action
• Top Ten
• Alarm List
• Asset League (Store)
• Reason League
• Alarm Analysis
• Current Alarm List
Each report can be over a certain time period, ranging from a week to a yearly quarter, or a specific time
period. The procedures for generating a report follow the same guidelines for each report.
5.2.1 Site Totals
The Site Total report lists the total number of alarms over a specified period of time for a store, which can
then be broken down to which assets contain the alarms, which can be further broken down to view the
incident log of the individual alarms.
Procedure
1. Select Site Alarms from the Store Level Reports drop down menu.
2. Select the required time period.
3. Select the ‘Go’ button.
4. Click on the Site name and subsequent assets to bring up the asset’s Alarm List.
5. Once compiled, the report will show the store name and the total number of alarms.
5.1 Introduction
5. Historical Alarms
5.2 Report Types

© Danfoss 05-2011
AK-EM 100 User guide20 RC8BY402
5.2.2 Alarm Action
The Alarm Action Report displays a pie chart with its sections forming what actions were taken for the
historical alarms.
Clicking on the pie chart will provide a list of all the alarms, which can all be looked at individually.
5.2.3 Top Ten
The Top Ten report shows the top ten worsting performing assets by the number of alarms they have
raised. These are then broken down by the number of critical and cautionary alarms each asset has and
their respective errors.
5.2.4 Alarm List
The Alarm List report displays all of the alarms for the store over the chosen time period.
The procedure for producing a report is exactly the same as the Site Totals report. Clicking on
the LogID of an alarm will display the full incident log of that alarm, such as the clearances and
comments. From the Incident Log page, comments can be attached to the alarm.
/