Page is loading ...

GeneMapper® ID-X Software
Version 1.2
Overview
GeneMapper
®
ID-X
Software Version 1.2 is an automated genotyping software solution for all human identification
(HID) data analysis needs, including forensic casework, databasing, and paternity testing. This quick reference guide
provides abbreviated procedures for analyzing, viewing, and interpreting data using the GeneMapper
ID-X
Software,
and briefly describes the default settings provided with the software. Use this card when you need quick reminders to
help you create and analyze projects, and review results. For more details, refer to the:
•GeneMapper® ID-X Software Help – Start the GeneMapper ID-X Software and press F1 or select
Help4Contents and Index. To access context-sensitive help in the software application, click or Help,
located on selected windows and dialog boxes.
•
D
ocuments shipped with the software and/or available on the GeneMapper® ID-X Software Version 1.2
Documentation CD as portable document format (.pdf) files:
–GeneMapper
® ID-X Software v1.2 Installation Guide
–GeneMapper
® ID-X Software v1.0 Administrator's Guide
–GeneMapper
® ID-X Software v1.1 Getting Started Guide – For information on the Mixture Analysis tool
–GeneMapper
® ID-X Software v1.0 Getting Started Guide
–GeneMapper
® ID-X Software v1.2 Quick Reference Guide
–GeneMapper
® ID-X Software v1.1 Quick Reference Guide – For information on the Mixture Analysis tool
–GeneMapper
®ID-X Software v1.2 Reference Guide
Quick Reference Guide

Page 2
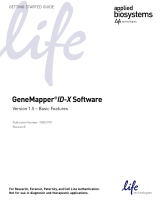
Data Analysis and Software Workflows
The following flowchart summarizes the steps for performing a typical data analysis workflow using the
GeneMapper
ID-X
Software. To the left are the steps the user performs when analyzing samples and interpreting
results. To the right are the software operations that occur automatically during analysis.
Review analysis workflow summaries:
• (Optional) Analysis Requirements Summary
• (Optional) Allelic Ladder Analysis Summary
• Analysis Summary
Create a project:
1. Add samples.
2. Apply analysis settings.
3. Start analysis.
Set up the software (one time):
1. Create an analysis method.
2. Set Project Options.
Manually review required samples
(based on your lab protocol)
(Optional) Report results:
1. Generate a custom report.
2. Export reports and tables.
3. Print.
(Optional) Use the Profile Comparison tool.
During analysis, the software
does the following:
Analysis summary
generation
Sample quality
assessment
Genotyping
Allelic ladder quality
assessment
Peak detection and
sizing
Analysis
requirements check

Page 3
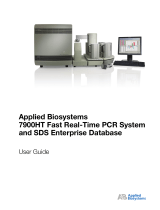
Software Screens
The main screens of the GeneMapper
ID-X
Software
are shown below
.
Panel Manager
View, modify, import and export
panels and bins used for genotyping.
Samples Plot
Examine electropherograms,
PQV flags, and quality value
details; edit allele labels.
GeneMapper ID-X Manager
Edit the parameters of new and existing
GeneMapper
ID-X
files (analysis methods,
table settings, plot settings, matrices, size
standards, report settings and projects).
Analysis Method Editor
Define peak detection, genotyping,
and PQV flag thresholds.
Project Window
Create project, analyze data,
review Samples and Genotypes
Process Quality Values (PQVs);
view table with genotypes, export
tables, generate reports; access
all other windows.
Profile Comparison
Report profile concordance and comparison results.
Report Manager
Generate and export
table-formatted reports.
Label Edit Viewer
View allele and artifact label
edits, and reasons for change
associated with a sample.

Page 4
Example Data Analysis Workflow
Follow the steps below to perform a basic analysis of AmpF
l
STR
®
kit data (.hid or .fsa files) using the GeneMapper
ID-
X
Software.
Note:
This workflow does not include procedures for setting up the software or for reporting results. Refer to the
GeneMapper
®
ID-X Software Help
or the
GeneMapper
®
ID-X Software Version 1.0
Getting Started Guide
for
information regarding these procedures. This workflow also does not include procedures for mixture analysis. Refer to
the
GeneMapper ID-X
Software
v1.1 Quick Reference Guide
and the
GeneMapper ID-X
Software
v1.1 Getting Started
Guide
for information regarding mixture analysis.
Create a Project
In the Project window, click (New Project) to create a new project.
Add Samples
1. Click (Add Samples to Project) to add samples to the project.
2. Navigate to the folder containing the sample files, or search for samples in the GeneMapper
ID-X
database.
3. Select a folder (or select individual files using
Ctrl-click
), then click
Add To List
.
4. Click
Add
.
Apply Analysis Settings
Apply analysis settings to the samples in the Project window before starting analysis.
1. In the Project window toolbar, select
310 Data Analysis
,
31XX Data Analysis
or
3500 Data Analysis
(see “Default
Table Settings” on page 10) or another custom table setting from the Table Setting drop-down list to view the
Samples table columns that require analysis settings: Sample Type, Analysis Method, Panel, Size Standard,
Custom Control (if included in the project) and Matrix (ABI P
RISM®
310 Genetic Analyzer sample files only).
2. In the Samples table, apply the appropriate analysis settings (sample type, analysis method, panel and size
standard) to each sample in the project.
a. Click a cell in each column to display a list selector arrow , then select the appropriate setting from the
drop-down list.
b. Select
Edit
Fill Down
(or press
Ctrl+D
) to apply the selected analysis settings to all samples in the project.
Start the Analysis
Click (Analyze) to analyze the project.
Review the Analysis Summary
Using the Analysis Summary, briefly review the overall quality of the allelic ladders, controls and samples in the project
(see “Reviewing the Analysis Summaries” on page 6).
Review Required
†
Samples
With the Analysis Summary still open in the Project window, proceed with data interpretation.
† Based on your laboratory protocol.

Page 5
View Sample-Level Quality Flags
1. Click a blue link under any column header or symbol
to review the samples in that category.
2. Examine the Sizing Quality (SQ) flags.
3. Examine the sample-level PQVs. See “Process Quality Value Flags” on page 8.
View Electropherograms and Marker-Level Quality Flags
1. In the filtered Samples table, select the sample(s) to investigate, then click (Display Plots) in the Project
window toolbar to open the Samples plot.
2. In the Samples plot, select
Data Interpretation
(see “Default Plot Settings” on page 12) or another custom plot
setting from the Plot Settings drop-down list.
3. Review the color-coded marker headers, which reflect the Genotype Quality (GQ) status of the marker.
4. Click a marker header in the plot to display individual marker-level PQV details in the Genotypes table and Quality
Value Details (QVD) pane. See “Process Quality Value Flags” on page 8.
As Needed:
•
Change the plot display:
Select a new plot setting or click a plot toolbar icon to change the plot display.
•
Show PQV trigger peaks:
Click (Show PQV Trigger Peak) to display labels on peaks that triggered
specific quality value flags.
•
View raw data:
Right-click a peak, then select
Peak Raw Data
.
•
Edit peak labels:
Left-click to select a peak or a peak label, then right-click and select an edit option (add,
delete or rename).
•
Mark samples for deletion from the project:
Select the
Mark Sample for Deletion
check box in the top right
corner of a plot pane to delete a sample from the project.
•
Manually accept marker genotypes:
In the Genotypes table, right-click the GQ PQV you wish to override,
then click
Yes
to override.
•
Manually accept sample genotypes:
In the Samples plot header, right-click the Composite Genotype Quality
(CGQ) PQV you wish to override.
Save Changes
1. Close the plot window (deletes any marked samples from the project).
2. Click (Save Project) to save any changes to the project.
(Optional) Perform Profile Comparison Checks
Use the Profile Comparison tool to examine sample concordance and comparison results.
IMPORTANT!
Before you use the Profile Comparison tool to evaluate the samples in your project, edit allele labels
as needed and ensure that no OL (off ladder)-only allele labels are present. Samples containing OL-only labeled peaks
are not considered in comparisons.
1. In the Project window, select
Tools
Profile Comparison.
2. Review the Sample Concordance results.
3. Use the Sample, Lab Reference, and Control/QC Comparison tabs to perform profile comparisons. In each tab:
a. Enter a Percent Match Threshold (range 50 to 100%) to use for each comparison.
b. Click
Compare Profiles
.
c. Review the profile comparison results.

Page 6
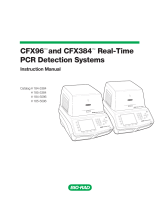
Reviewing the Analysis Summaries
Reviewing the Analysis Requirements Summary
Reviewing the Allelic Ladder Analysis Summary
Displays the filtered Samples
table listing only the samples
that do not meet analysis
requirements.
Analyzes samples that meet
requirements (does not analyze
those samples that do not
meet requirements).
Shows the number of samples
that do not meet the specified
analysis requirements.
Displays the filtered Samples table listing only the allelic
ladder samples with and/or CGQ or SQ.
Shows the number of analyzed
ladders in the project and the run
folders where they are located.
Analyzes run folders with at least
one passing ladder and uses the
passing ladder(s) to calculate bin
offsets. Run folders with no passing
ladders are not analyzed.
Ladders with CGQ and SQ
Ladders with CGQ and SQ
Ladders with CGQ and/or SQ
Place pointer over symbols to view tooltips listing reported PQVs
Analyzes all run folders regardless
of ladder quality. If a run folder
contains no passing ladders, the
sample files are sized, but
genotyping results in many OL allele
calls.

Page 7
Reviewing the Analysis Summary
See “Reviewing the
Allelic Ladder Analysis
Summary” on page 6
Select to display results for individual
run folders, or all run folders in a project
Separates the analyzed
controls by type (from
Samples table)
Analysis status:
• Never analyzed
•Analyzed
• Analysis setting
changed since last
analyzed
Click a blue link under any
column header or symbol
to display a filtered view
of the Samples table that
displays only the samples
in that category
Separates passing
samples from samples
that do not meet one or
more quality thresholds
Lists all
samples in the
selected run
folder(s) by
analysis status

Page 8
GeneMapper
®
ID-X
Software Data Flags
Analysis Requirements Flags
Analysis requirements flags are displayed either in the Samples table before analysis starts or in the Analysis
Requirements Summary after analysis starts. The software displays a flag for unmet requirements.
Process Quality Value Flags
Process Quality Value (PQV) flags indicate the quality of data at the sample and marker levels for genotyping. After
optimizing and validating PQV settings, you can use PQV flags to quickly identify data-quality issues and help to
interpret samples that do not meet all thresholds. In the Samples table and Genotypes table, PQV flags display the
following symbols after analysis: (Pass), (Check), (Low Quality), or NA (PQV does not apply).
Flag Name Description
ARNM
Analysis Requirement Not Met Indicates if all analysis requirements are met. These requirement checks are
performed when analysis is started:
• Sample File Not Found
• Analysis Method Not Selected
• Analysis Method Not Found in the Database
• Panel Not Selected
• Panel Not Found in the Database
• Binset Not Selected
• Binset in Analysis Method Does Not Match Binset Selected in the Panel Manager
• Size Standard Not Selected
• Size Standard Not Found in Database
• Size Standard Dye Color is Not Present in the Sample Dye Set
• Matrix Not Selected
• Matrix Not Found or
Contains Invalid Data
• No Allelic Ladder Selected in Run Folder
• GMID v3.x Analysis Method Selected
• Basic or Classic Size Standard Selected
• SNP Panel Selected
Flag Name Description
†
Sample-level PQV flags
SOS
Sample
Off-scale
Indicates if any fluorescence signal within the analysis range exceeds the detection threshold of
the instrument.
SQ
Sizing Quality Evaluates the similarity between the fragment pattern for the size standard dye specified in the size
standard definition and the actual distribution of size standard peaks in the sample, calculates an
interim SQ (a value between 0 and 1), then applies the broad peak weighting specified in the
analysis method, as described in the
GeneMapper
®
ID-X Software Version 1.2 Reference Guide
.
Note:
The GeneMapper
ID-X
Software does not genotype samples with SQ.
SSPK
Sample Spike •
Allelic Ladders
– Indicates if spikes are detected within the sizing range.
•
Samples
– Indicates if spikes are detected within or between two defined marker size ranges.
Does not indicate if spikes are detected before the first marker or after the last marker.
The software uses a proprietary algorithm that detects spikes based on the peak morphology.
MIX
Mixed Source Indicates a potential mixed-source sample.
OMR
Outside Marker
Range
Indicates if labeled peaks are detected between two marker size ranges defined in the panel.

Page 9
CGQ
(samples)
Composite
Genotype Quality
Indicates overall sample genotype quality. Considers the individual marker GQ values (see
“Marker-level PQV flags”
below).
CGQ
(allelic
ladders)
Composite
Genotype Quality
Indicates overall allelic ladder quality. Considers the allelic ladder quality assessment (see
“Reviewing the Allelic Ladder Analysis Summary” on page 6).
Note:
Allelic ladder samples with CGQ are not used to create bin offsets.
IMPORTANT!
If the Allelic Ladder GQ Weighting for Spikes and for Off-scale is set to 0 (off) or
spike detection for the allelic ladder is disabled, the CGQ may be , even if a spike and/or off-
scale fluorescence signal is detected in the allelic ladder. If the spike detection option is set to
disable, spikes are not detected or labeled.
Marker-level PQV flags
OS
Off-scale • Al
lelic Ladders
– Indicates if any off-scale fluorescence signal is detected within each extended
marker range (no gaps are present between markers, and the end point of each marker is
extended past the marker definition in the panel to the beginning of the next marker).
•
Samples
– Indicates if any fluorescence signal within a marker size range exceeds the
detection threshold of the instrument.
BIN
Out of Bin Allele Indicates if labeled peaks do not fall inside bins. These peaks are labeled with OL (Off ladder).
PHR
Peak Height
Ratio
Indicates if the peak height ratio between the lowest and highest peak is less than the Min Peak
Height Ratio defined in the analysis method.
LPH
Low Peak Height Indicates if any peak heights (in RFU) within the marker size range are below the Homozygous or
Heterozygous Min Peak Height thresholds set in the analysis method.
MPH
Max Peak Height Indicates if any peak heights (in RFU) within the marker size range exceed the Max Peak Height
value (in RFU) set in the analysis method.
SPK
Marker Spike •
Allelic Ladders
– Indicates if spikes are detected within each extended marker range (no gaps
are present between markers; the end point of each marker is extended past the marker
definition in the panel to the beginning of the next marker).
•
Samples
– Indicates if spikes are detected within a marker size range.
The software uses a proprietary algorithm that detects spikes based on the peak morphology.
AN
Allele Number Indicates if the software detects no alleles, more than the Max Expected Alleles set in the analysis
method
,
or no X allele detected in amelogenin.
BD
Broad Peak Indicates if the width of any peak exceeds the Max Peak Width (half height in base pairs) defined in
the analysis method.
CC
Control
Concordance
Indicates if a positive, custom, or negative control produces the expected profile.
OVL
Overlapping
Alleles
Indicates if a labeled peak (allele or artifact) falls within the size ranges of two neighboring markers.
GQ
(samples)
Genotype Quality Indicates the genotype quality of the marker in the sample. The genotype quality for a sample
marker is determined based on the presence of labeled peaks detected (after filtering) and the GQ
weighting specified in the analysis method.
If no labeled peaks are detected (and the sample is not a negative control), the GQ is set to 0. If one
or more labeled peaks are detected, the GQ is initially set to 1 with a final value determined by the
GQ weighting of individual marker-level quality values as specified in the analysis method.
Flag Name Description
†

Page 10
Data Review Flags
Data review flags, displayed in either the Samples table or the Genotypes table, can assist with data review.
Table Settings, Plot Settings and Size Standards
Default table, plot, and size standard settings are provided with the GeneMapper
ID-X
Software. You can modify the
supplied default table, plot, and size standard settings to support individual laboratory workflows, or create new
settings.
Default Table Settings
Table settings determine the content (columns) displayed in or exported from the Samples and Genotypes tables. The
following table settings are installed with the GeneMapper
ID-X
Software.
GQ
(allelic
ladders)
Genotype Quality Indicates the genotype quality of the marker in the allelic ladder. The genotype quality for an allelic
ladder marker is determined using system-defined quality rules (as described in the
GeneMapper
®
ID-X
Software
Version 1.2 Reference Guide
). The rules ensure that all expected
peaks are present, the peak height ratio of the first and second peak is greater than 50%, no spikes
are present in the extended marker range (within or between markers), the peak height ratio
between the lowest and highest peak is equal to or greater than 15%, the base pair spacing
between any two ladder alleles in each marker (specified in the panel used to analyze) is within the
expected range, and no off-scale (OS) fluorescent signal is detected within each extended marker
range.
IMPORTANT!
If the Allelic Ladder GQ Weighting for Spikes and for Off-scale is set to 0 (off) or
spike detection for the allelic ladder is disabled, the GQ may be , even if a spike and/or off-
scale fluorescence signal is detected in the allelic ladder.
† A gray , , or for sample-level PQVs indicates at least one marker in the sample was edited. A gray or for marker-level PQVs
indicates at least one label in the marker was edited or the GQ was overridden. A green for the CGQ PQV indicates the CGQ was manually
overridden.
Flag Name Description
Samples table
SE Sample Edit Displays if the sample has been edited in the Samples plot or Genotypes plot.
Reflects edits made within and/or outside of marker ranges.
SQO Sizing Quality
Overridden
Displays if the Sizing Quality is manually overridden.
Genotypes table
AE Reason for
Change
AE Reason for
Change
Displays the last reason for change entered when you make a change that yields
an allele label. Works in conjunction with the ME flag.
MEC Marker Edit
Comment
Displays the reason for change entered when you make a change that yields an
artifact label. Works in conjunction with the ME flag.
ADO Allele Display
Overflow
Displays if the number of alleles called for the marker is larger than the number
specified for Show Number of Alleles in table settings.
ME Marker Edit Displays if allele or artifact labels are edited within a marker size range.
Flag Name Description
†

Page 11
Name Purpose Samples Table Content Genotypes Table Content
310 Data Analysis Used to set up table data to
analyze sample files generated on
an ABI P
RISM®
310 Genetic
Analyzer.
Displays analysis setting columns
and sample-level quality values.
Displays marker and allele
columns, and marker-level
quality values.
31XX Data Analysis Used to set up table data to
analyze sample files generated on
ABI P
RISM®
3100 Series and Life
Technologies Corporation 3130
Series Genetic Analyzers.
Same as the 310 Data Analysis (see
entry above), except the Matrix
column is not displayed.
Same as the 310 Data Analysis
table setting (see entry above).
3500 Data Analysis Used to set up table data to
analyze sample files generated
on Applied Biosystems 3500
Genetic Analyzers
Same as the 31XX Data Analysis
except that the SFN column is
displayed.
Same as the 31XX Data
Analysis table setting (see
entry above).
CODIS Export Used to enter data in the
appropriate columns of the
Samples table for exporting a
CODIS-supported CMF file.
Displays the columns that may be
used to populate CODIS-compatible
fields when the table is exported in
CMF file format.
Same as the 310 Data Analysis
table setting (see entry above).
Note:
No action is required on
the Genotypes tab when
exporting a CMF file.
Import Reference
Profiles
Used to import lab reference and
custom control profiles into the
GeneMapper
®
ID-X
Software
database.
Displays the Profile ID column,
which is required to name and enter
profiles into the GeneMapper
®
ID-X
Software database.
Same as the 310 Data Analysis
table setting (see entry above).
Note:
No action is required on
the Genotypes tab when
importing reference profiles.
View CGQ Overrides Used to quickly identify samples
that have been manually
accepted (this includes samples
with and without allele edits).
Displays only samples with the CGQ
override flag and sample-level
quality values.
Displays marker and allele
columns, edit comments, and
marker-level quality values.
View Edited
Samples
Used to quickly identify samples
that have one or more allele edits.
Displays only samples with allele
edits and sample-level quality
values.
Displays only markers with
edits, edit comments and
marker-level quality values.
Traditional Allele
Ta b l e
Used to export data into an allele
table using Combined Table
Export.
Displays only the sample
information required for an allele
table export format.
Displays only the marker and
allele information required for an
allele table export format.
The allele table export format resembles that created in
the ABI P
RISM®
Genotyper
®
Software. The table is
compatible with spreadsheet software such as
Microsoft
®
Excel
®
.
View Unedited
Samples
Used to quickly identify samples
that have not been manually
manipulated (edited or
overridden).
Displays only samples without label
edits, or GQ or CGQ override flags
and sample-level quality values.
Displays only markers without
allele edits and marker-level
quality values.
Yfiler Haplotype DB
Export
Used to export the appropriate
columns using Combined Table
Export for upload into the Yfiler
®
Haplotype Database.
Displays only the sample
information required for export in
Yfiler
®
Haplotype Database format.
Displays only the sample and
marker information required for
export in Yfiler
®
Haplotype
Database format.

Page 12
Default Plot Settings
Plot settings determine the number of panes, headers, labels, and tables displayed in the Samples and Genotypes plot
windows. The following plot settings, installed with the GeneMapper
ID-X
Software, include settings for the most
common data interpretation and review tasks.
Default Size Standards
A size standard definition file provides a list of fragment sizes in base pairs and the dye color associated with a
particular size standard. During peak detection and size-calling, the GeneMapper
ID-X
Software matches an observed
fragment peak from the sample with a corresponding size in the definition file. The following default size standard
definition files are provided with the GeneMapper
ID-X
Software for analysis of AmpF
l
STR
®
kit data.
VALID_GMIDX_Table
Setting-1.0
Used to export the appropriate
columns for importing tabular
data into VALID
™
Software.
Displays only the sample
information and run information
required for a VALID software-
compatible format.
Displays only the marker
information required for a VALID
software-compatible format.
Name Purpose Description
Check LIZ Size
Standard
Used to display the GeneScan
™
LIZ
®
size standard in
the same format as the Check GS500 Macro in the
ABI P
RISM ®
Genotyper
®
Software templates.
Displays the GeneScan
™
LIZ
®
size-standard
fragments with labels per sample in separate
electropherogram panes.
Check ROX Size
Standard
Used to display the GeneScan
™
ROX
™
size standard
in the same format as the Check GS500 Macro in the
ABI P
RISM ®
Genotyper
®
Software templates.
Displays the GeneScan
™
ROX
™
size-standard
fragments with labels per sample in separate
electropherogram panes.
Data
Interpretation
Used during manual review of sample data, to enable
quick interpretation of anomalies and marker-level
quality values.
Displays the electropherogram plots for the selected
sample(s), the Genotypes table, and the QVD pane.
Overlay LIZ Dye Used to perform sizing precision checks with the
GeneScan
™
LIZ
®
size standards.
Overlays all selected size-standard fragments in one
electropherogram pane, and the Sizing table.
Overlay ROX Dye Used to perform sizing precision checks with the
GeneScan
™
ROX
™
size standards.
Overlays all selected size-standard fragments within a
project in one electropherogram pane, and the Sizing
table.
Sizing Data Used to display data in a format similar to the
ABI P
RISM ®
GeneScan
™
Software plots.
Displays all dyes per sample in one electropherogram
pane, and the Sizing table.
Traditional
Genotype Plot
Used to display data in a format similar to the
ABI P
RISM ®
Genotyper
®
Software plots.
Displays each dye for a sample in a separate
electropherogram pane.
View Label Edits Used to display allele edits for the selected sample(s)
in a table below the electropherogram for electronic
data review.
Displays the electropherogram plots for the selected
sample(s), and the Label Edit Viewer table.
Name Purpose Description
CE_G5_HID_GS500 Used with data generated on ABI P
RISM ®
310 and 3100 Series
Genetic Analyzers, and Life Technologies Corporation 3130 and
3730 Series Genetic Analyzers, and run with the GS500 LIZ
®
Size
Standard.
Includes fragments present in the
GeneScan
™
500 LIZ
®
size standard
(75 to 450-bp), excluding the 250-bp
fragment.
Name Purpose Samples Table Content Genotypes Table Content

Page 13
CE_F_HID_GS500
(75-400)
Used with data generated on ABI P
RISM ®
310 and 3100 Series
Genetic Analyzers, and Life Technologies Corporation 3130 Series
Genetic Analyzers, and run with the GS500 ROX
™
Size Standard
and all AmpF
l
STR
®
4-dye kits (except the SGM Plus
®
kit).
Includes fragments present in the
GeneScan
™
500 ROX
™
size standard
(75 to 400-bp), excluding the 250-bp
fragment.
CE_F_HID_GS500
(75-450)
Used with data generated on ABI P
RISM ®
310 and 3100 Series
Genetic Analyzers, and Life Technologies Corporation 3130 Series
Genetic Analyzers, and run with the GS500 ROX
™
Size Standard
and all AmpF
l
STR
®
SGM Plus
®
kit.
Includes fragments present in the
GeneScan
™
500 ROX
™
size standard
(75 to 450-bp), excluding the 250-bp
fragment.
GS600_LIZ Used with data generated on ABI P
RISM ®
310 and 3100 Series
Genetic Analyzers, and Life Technologies Corporation 3130 Series
Genetic Analyzers, and run with the GS600 LIZ
®
Size Standard.
Includes fragments present in the
GeneScan
™
600 LIZ
®
size standard
(80 to 460-bp).
GS600_LIZ (80 -
400)
Used with data generated on
ABI P
RISM®
310 and 3100 Series
Genetic Analyzers and the Applied Biosystems 3130 and 3500
Genetic Analyzers, and run with GS600
LIZ
®
Size Standard.
Includes fragments present in the
GeneScan™ 600
LIZ
®
size standard
(80 to 400 bp).
GS600_LIZ_Normal
ization (80 - 400)
Used with normalized data generated on Applied Biosystems
3500 Genetic Analyzers, and run with GS600
LIZ
®
Size
Standard.
Includes fragments present in the
GeneScan™ 600
LIZ
®
size standard
(80 to 400 bp).
Name Purpose Description

Page 14
Window Functions and Keyboard Shortcuts
The Project Window
The Project window is displayed when you start the software. Based on the settings in
File
Project Options
, the
Project window displays the last open project or a blank project. Based on what is displayed, the Project window
toolbar and menu can contain:
Name Icon Shortcut Description
Project Window Toolbar
New Project Ctrl + N Creates a new project.
Open Project Ctrl + O Opens a saved project.
Save Project Ctrl + S Saves the current project.
Add Samples to Project Ctrl + K Adds samples to a project.
Export Table Ctrl + E Exports the contents of the currently selected table in a .txt
file.
Display Plots Ctrl + L Displays either the Samples plot for samples selected in the
Samples table, or the Genotypes plot for markers selected in
the Genotypes table.
Report Manager Ctrl + Q Generates a table-formatted report using user-defined report
settings.
Label Edit Viewer
N/A
†
Contains a detailed list of edits made to allele and artifact
labels in a Sample plot, with reasons for change.
Size Match Editor
N/A
Provides views of the size standard definition and size calling
curve for each sample highlighted in the project.
Analysis Method Editor
N/A
Allows you to edit the parameters of new and existing analysis
methods.
Panel Manager Ctrl + J Displays the markers and bins used to allele-call samples.
GeneMapper
ID-X
Manager Ctrl + M Allows you to edit the parameters of new and existing
GeneMapper
ID-X
files (analysis methods, table settings, plot
settings, matrices, size standards, report settings and
projects).
Analyze Ctrl + R Analyzes the project currently open.
Low Quality to Top Ctrl + B Sorts the data in the Samples or Genotypes tab so samples or
markers with lower PQV scores are at the top of the table.
Table Setting menu
N/A
Lists available table settings.
Table Setting Editor Ctrl + T Allows you to edit the parameters of new and existing table
settings.
Find Ctrl + F Allows you to search the Samples tab or Genotypes tab
columns.
Print Ctrl + P Allows you to print any of the following items if they are
currently open: reports, tables, plots, sample information, raw
data, and EPT data.
Print Preview
N/A
Allows you to review the printout of a selected data item before
printing.

Page 15
The Samples Plot and Genotypes Plot Windows
You can navigate between the Samples or Genotypes tables in the Project window and the Samples or Genotypes
plots by: 1) Selecting the samples or the markers of interest to display from the Project window, then 2) Clicking
(Display Plots). Based on what is displayed in the Samples or Genotypes plot window, the toolbar and menu can
contain:
Products and Services F2 Opens the Life Technologies Corporation online Store.
GeneMapper ID-X Help
F1 Click to display help for the Project window.
Project Window Menu
Edit
Copy Ctrl + C Allows you to duplicate selected data item(s).
Edit
Paste Ctrl + V Allows you to insert copied data item(s) in the selected
location.
To o l s
Profile Manager
N/A
Allows you to view, export, or delete lab reference or control
profiles stored in the GeneMapper
ID-X
Software database.
ToolsMixture Analysis Ctrl + U Launches the Mixture Analysis tool.
Admin
Security Manager
N/A
Opens the Access Control Administration tool. Configured by
the GeneMapper
ID-X
Software system administrator to
control user access to software functions and data.
Admin
Audit
Manager
Setting
N/A
Opens the Audit Map Configuration tool. A set of instructions
specified by the GeneMapper
ID-X
Software system
administrator that defines the types of data to audit, the
actions to audit, and whether auditing is On (prompts the user
for a Reason for Change) or Silent (tracks the change, but does
not prompt the user).
Admin
Audit
Manager
Report
N/A
Opens the Audit History Viewer. Provides the GeneMapper
ID-X
Software system administrator with advanced query
options for retrieving and reporting audit records.
Admin
Esig Administrator
N/A
Opens the E-Signature Manager. Configured by the
GeneMapper
ID-X
Software system administrator to identify
the actions that require user-authentication via an electronic
signature.
†N/A = Not available.
Name Icon Shortcut Description
Samples Plot or Genotypes Plot Toolbar
Print Ctrl + P Allows you to print any of the following items if
currently open: reports, tables, plots, sample
information, raw data, and EPT data.
Print Preview
N/A
†
Allows you to review the printout of a selected
data item before printing.
Plot Setting menu
N/A
Lists available plot settings.
Note:
Toolbar buttons override (but do not
change) the selected plot setting.
Name Icon Shortcut Description

Page 16
Plot Setting Editor Ctrl + T Allows you to edit the parameters of new and
existing plot settings.
Panes menu
N/A
Allows you to change the number of panes (from
1 to 8) that can be displayed.
Show/Hide Header
N/A
Displays or hides the sample headers in the plot
window.
Show/Hide Marker Range Ctrl + R Displays or hides the color-coded marker
headers in the plot window.
Show/Hide Marker Indicator Ctrl + K Displays or hides the red marker size range
indicators in the plot window.
Show/Hide PQV Trigger
Peak
N/A
Displays or hides a peak label suffix for peaks
with Low Peak Height (LPH), Max Peak
Height (MPH), Broad Peak (BD), or Off-scale (OS)
PQVs.
GeneMapper ID-X Help
F1 Click to display Help for the plot window.
No Labels Ctrl + Shift + N Hides all peak labels.
Horizontal Labels Ctrl + Shift + H Displays peak labels in a horizontal format (may
cause overlapping labels if not zoomed in
sufficiently).
Vertical Labels Ctrl + Shift + V Displays peak labels in a vertical format (will
prevent overlapping labels).
Show/Hide Bins Ctrl + Shift + B Displays or hides allele bins.
Note:
Bins are not displayed when the x-axis
scale is set to data points.
Show/Hide Peak Positions
N/A
Displays or hides peak position indicators (for
start of peak, peak apex, and end of peak).
Bring/Don’t Bring Controls
to Top
N/A
Moves control samples to the top of the plot in
one scrollable pane, or to the bottom of the plot.
Bring/Don’t Bring Ladders
to Top
N/A
Moves allelic ladder samples to the top of the plot
in one scrollable pane, or to the bottom of the
plot.
Show/Hide Allele Changes
N/A
Displays or hides any allele label edits manually
applied after software analysis.
Full View Ctrl + Close
Bracket
Restores the plot to the maximum magnification.
Multiple Dye Plot
N/A
Displays a plot showing all dyes in the range of
the selected marker.
Name Icon Shortcut Description

Page 17
Samples Plot Toolbar Only
Show/Hide Dyes
Blue:
Ctrl + 1
Green:
Ctrl + 2
Yellow:
Ctrl + 3
Red:
Ctrl + 4
Purple:
Ctrl + 0
Orange:
Ctrl + 5
All:
Ctrl + 6
Selects the dyes to display or hide in the plot:
blue, green, yellow, red, purple, orange, and all
dyes.
Combine Dyes Ctrl + 7 Displays all dyes for a sample in one pane.
Separate Dyes Ctrl + 8 Displays each dye of a sample in a separate
pane.
Overlay All Ctrl + 9 Overlays all samples and displays all dyes for all
samples in one pane.
No Table Ctrl + Q Removes any tables from the plot window.
Sizing Table Ctrl + A Displays the Sizing table (contains allele, size (bp)
peak height, peak area, and data point
associated with an allele).
Genotypes Table Ctrl + W Displays the Genotypes table (contains panel,
marker, allele, and PQV associated with a
sample).
Label Edit Viewer
N/A
Displays the Label Edit Viewer (contains allele
and artifact label edits, and reasons for change
associated with a sample).
Bring/Don’t Bring Marked
Samples to Top
N/A
Moves samples marked for deletion
( in the top right of each
pane) to the top of the Samples plot in one
scrollable pane, or moves them to the bottom of
the Samples plot.
Note: Marked samples are deleted when you
close the Samples plot.
Samples Plot or Genotypes Plot Menu
Edit
Copy Ctrl + C Allows you to duplicate selected data item(s).
Plots
Zoom
Zoom In
N/A
Ctrl + Equals Zooms in incrementally on X-axis in all panes.
Plots
Zoom
Zoom Out
N/A
Ctrl + Minus Zooms out incrementally on X-axis in all panes.
Plots
Zoom
Zoom to
Next Marker
N/A
Ctrl + J Zooms to the next marker.
Plots
Table Filter
Show
Selected Rows
N/A
Ctrl + G Displays only the selected Genotypes or Sizing
table (Samples plot only) row(s).
Plots
Table Filter
Hide
Selected Rows
N/A
Ctrl + H Hides only the selected Genotypes or Sizing table
(Samples plot only) row(s).
Name Icon Shortcut Description

www.appliedbiosystems.com
To o l s
GeneMapper
ID-X
Manager
Ctrl + M Allows you to edit the parameters of new and
existing GeneMapper
ID-X
files (analysis
methods, table settings, plot settings, matrices,
size standards, report settings and projects).
Alleles
Add Allele Label
N/A
Ctrl + L Allows you to assign an allele label to an
unlabeled peak, or change an artifact label to an
allele label.
Alleles
Add Artifact Label
N/A
Ctrl + I Allows you to assign an artifact label to an
unlabeled peak.
†N/A = Not available.
© Copyright 2009, Life Technologies Corporation. All rights reserved.
For Research, Forensic, or Paternity Use Only. Not for use in diagnostic procedures.
Information in this document is subject to change without notice. Applied Biosystems assumes no responsibility for any errors that may appear in this
document.
GeneMapper
®
ID-X Software has undergone a verification process defined by Life Technologies Corporation. However, human identification laboratories
analyzing forensic, paternity, databasing and single-source samples that choose to use
GeneMapper
ID-X
Software for data analysis should perform
their own appropriate validation studies.
APPLIED BIOSYSTEMS DISCLAIMS ALL WARRANTIES WITH RESPECT TO THIS DOCUMENT, EXPRESSED OR IMPLIED, INCLUDING BUT NOT LIMITED
TO THOSE OF MERCHANTABILITY OR FITNESS FOR A PARTICULAR PURPOSE. IN NO EVENT SHALL APPLIED BIOSYSTEMS BE LIABLE, WHETHER IN
CONTRACT, TORT, WARRANTY, OR UNDER ANY STATUTE OR ON ANY OTHER BASIS FOR SPECIAL, INCIDENTAL, INDIRECT, PUNITIVE, MULTIPLE OR
CONSEQUENTIAL DAMAGES IN CONNECTION WITH OR ARISING FROM THIS DOCUMENT, INCLUDING BUT NOT LIMITED TO THE USE THEREOF.
Notice to Purchaser: License Disclaimer.
Purchase of this software product alone does not imply any license under any process, instrument or other apparatus, system, composition, reagent
or kit rights under patent claims owned or otherwise controlled by Life Technologies Corporation, either expressly, or by estoppel.
TRADEMARKS:
Trademarks of Life Technologies Corporation and its affiliated companies: AB (Design)®, Applied Biosystems®,ABI PRISM®, AMPFLSTR®,
GeneMapper®, GeneScan™, Genotyper®, LIZ®, ROX™, SGM Plus®, VALID™, Yfiler®.
This product includes software developed by the Apache Software Foundation.
This product includes software developed by the ExoLab Project.
JNIRegistry is copyrighted © by ICE Engineering, Inc.
Microsoft and Excel are registered trademarks of Microsoft Corporation.
All other trademarks are the sole property of their respective owners.
10/2009
Name Icon Shortcut Description
Part Number 4426482 Rev. A
/