Page is loading ...

LightCycler
®
Real-Time PCR Systems
Application Manual
21020908 RealTime PCR Application Manual.indb 121020908 RealTime PCR Application Manual.indb 1 06.02.2009 14:14:1506.02.2009 14:14:15

21020908 RealTime PCR Application Manual.indb 221020908 RealTime PCR Application Manual.indb 2 06.02.2009 14:14:1706.02.2009 14:14:17

3
Table of Contents
Chapter 1
Introduction Preface .......................................................................................................................................8
An Introduction to PCR ....................................................................................................9
Real-Time PCR ................................................................................................................... 10
Acquisition of Fluorescence Signal ........................................................................13
Cycle-by-Cycle Measurement ...................................................................................... 13
Melting Curves ................................................................................................................... 15
Detection Formats ............................................................................................................18
SYBR Green I ...................................................................................................................... 18
LightCycler
®
480 ResoLight Dye ................................................................................. 18
Principles of Specifi c Probe Assays ........................................................................... 19
HybProbe Probes ............................................................................................................... 19
Hydrolysis Probes ..............................................................................................................20
Universal ProbeLibrary (UPL) ....................................................................................... 20
SimpleProbe Probes ......................................................................................................... 21
Other Formats ..................................................................................................................... 21
Multiplexing ......................................................................................................................... 22
21020908 RealTime PCR Application Manual.indb 321020908 RealTime PCR Application Manual.indb 3 06.02.2009 14:14:1706.02.2009 14:14:17

LightCycler
®
Real-Time PCR Systems - Application Manual4
Table of Contents
Chapter 2
Applications Gene Detection .................................................................................................................. 24
Qualitative Analysis .........................................................................................................24
Quantifi cation ..................................................................................................................... 25
Overview of Quantitative PCR Methods ................................................................... 25
Absolute Quantifi cation ................................................................................................ 26
Absolute Quantifi cation with External Standards ................................................. 26
Absolute Quantifi cation with External Standards and Internal Control ....... 27
Relative Quantifi cation .................................................................................................. 28
Relative Quantifi cation .................................................................................................... 28
Concept of Relative Quantifi cation ........................................................................... 28
Planning Relative Quantifi cation Assays .................................................................. 29
Reference Genes ...............................................................................................................30
Calibrator Sample .............................................................................................................. 31
Optimization of Reaction Conditions ......................................................................... 32
Starting Material ................................................................................................................ 32
Controls ................................................................................................................................. 32
Kits and Reagents ............................................................................................................. 33
Universal ProbeLibrary Reference Gene Assays ...................................................34
RealTime ready PCR Assays ..........................................................................................34
Assay Validation ................................................................................................................. 35
Effi ciency .............................................................................................................................. 35
Sensitivity ............................................................................................................................. 35
Precision ...............................................................................................................................36
Selecting an Analysis Method ...................................................................................... 37
Basic Analysis .....................................................................................................................39
Advanced Analysis ...........................................................................................................41
–Method ........................................................................................................................ 42
Analysis of Multiple Experiments ................................................................................ 45
Genetic Variation Analysis .......................................................................................... 46
Overview of Methods to Analyze Genetic Variations ...................................46
Detecting Unknown Variants ..................................................................................... 49
Gene Scanning by High Resolution Melting ..........................................................49
Optimizing HRM Assays ...............................................................................................51
Kits and Reagents for Genetic Variation Analysis ................................................ 52
Detecting Known Variants ...........................................................................................54
Basic Method: Endpoint Genotyping ........................................................................ 54
Advanced Method: Melting Curve Genotyping ..................................................... 56
LightCycler
®
480 Software for Genetic Variation Analysis ................................58
LightCycler
®
480 Multiple Plate Analysis Software ..............................................59
21020908 RealTime PCR Application Manual.indb 421020908 RealTime PCR Application Manual.indb 4 06.02.2009 14:14:1706.02.2009 14:14:17

5
Table of Contents
Chapter 3
Assay Development Tips and Tricks ....................................................................................................................62
PCR Requirements ...........................................................................................................62
Sample/Nucleic Acid Preparation ............................................................................... 62
Primer Design ..................................................................................................................... 63
Probe Design ...................................................................................................................... 64
Recommendations for Hydrolysis Probes ................................................................64
Recommendations for HybProbe Probes .................................................................66
Recommendations for SimpleProbe Probes. ........................................................... 67
Recommendations for Unlabeled Probes ................................................................ 68
Optimizing Real-Time PCR ...........................................................................................69
Special Considerations for Reverse Transcription PCR ...................................... 72
Evaluation of PCR Assays ............................................................................................. 75
Specifi city ............................................................................................................................. 75
Effi ciency .............................................................................................................................. 76
Sensitivity ............................................................................................................................. 78
Reproducibility ...................................................................................................................80
Multiple Plate Analysis Software ................................................................................. 82
Chapter 4
Practical Examples
Experimental Studies
Quantitative Detection of Legionella pneumophila in Water Samples:
Assay Transfer to the LightCycler
®
480 Real-Time PCR System ...........86
Udo Reischl, Maria-Bibiana Alberdi, Michael Hoffmann, and Markus Bollwein
Real-Time Multiplex PCR of Five Different DNA Targets
Using the LightCycler
®
480 System ....................................................................... 92
Richard Molenkamp, Alwin van der Ham, Janke Schinkel, and Marcel Beld
Relative Quantifi cation of Multiple mRNA Targets and
Reference Genes in Spinocerebellar Ataxia ......................................................96
Michael Walter
Mutation Scanning Using High Resolution Melting or dHPLC:
A Performance Comparison Study .......................................................................110
Ariane Sadr-Nabavi, Michael Hoffmann, Christian Weilke, Yu-Li Sun
and Claudia Nevinny-Stickel-Hinzpeter
Endpoint Genotyping to Study Associations of
Cannabinoid Receptor Variants with Adiposity .............................................117
Armand Peeters, Sigri Beckers, Ilse Mertens, Wim Van Hul, and Luc Van Gaal
Melting Curve Genotyping: Correlation Between
SNP Alleles and Smoking Behavior ......................................................................121
Peter Bauer, Susan Collins, and Anil Batra
Methylation-Sensitive High Resolution Melting (MS-HRM)
on the LightCycler
®
480 System ............................................................................126
Tomasz K Wojdacz & Lise Lotte Hansen
21020908 RealTime PCR Application Manual.indb 521020908 RealTime PCR Application Manual.indb 5 06.02.2009 14:14:1706.02.2009 14:14:17

LightCycler
®
Real-Time PCR Systems - Application Manual6
Table of Contents
Chapter 5
Appendix Ordering Information ....................................................................................................134
LightCycler
®
480 Instruments and Additional Products ...........................134
LightCycler
®
480 Reagents and RT-PCR Products ......................................135
Limited Label Licenses and Disclaimers ...........................................................136
Trademarks ......................................................................................................................... 139
List of External Authors ...............................................................................................140
21020908 RealTime PCR Application Manual.indb 621020908 RealTime PCR Application Manual.indb 6 06.02.2009 14:14:1706.02.2009 14:14:17

Introduction
1
Preface ................................................................................................ 8
An Introduction to PCR ............................................................... 9
Real-Time PCR .............................................................................. 10
Acquisition of Fluorescence Signal ....................................13
Detection Formats .......................................................................18
21020908 RealTime PCR Application Manual.indb 721020908 RealTime PCR Application Manual.indb 7 06.02.2009 14:14:1706.02.2009 14:14:17

8
1
1
LightCycler
®
Real-Time PCR Systems - Application Manual
Preface
This application manual serves as a general introduction into the principles of Real-Time PCR and as a
guide to the highly diverse applications of this method in life science research. As refl ected by the book´s
structure, it covers both theoretical and practical aspects:
I. The fi rst chapter provides an overview of PCR history, starting from the early years of discovery
of the PCR principle and leading on to developments and modern methods for monitoring and
analyzing reactions online and in real-time. It also introduces the assay formats most commonly
used on today´s Real-Time PCR platforms.
II. The second chapter provides a more detailed introduction into Real-Time PCR applications, from
gene detection and identifi cation in virology and microbiology, discovery and detection of genetic
variation, to - last but not least - absolute and relative quantifi cation in gene expression analysis.
III. Since the success and scientifi c accuracy of results obtained from any PCR experiment will
always depend on assay design and experimental planning, the third chapter provides advanced
information on this topic. It should help users identify critical steps in their workfl ows and provide
starting points for optimization, in case experimental results are not satisfactory.
IV. The forth chapter fi nally offers a collection of case studies provided by users of the LightCycler® 480
Real-Time PCR System, who describe the use of this high-throughput platform in their real-life,
daily research work.
Roche Applied Science is delighted to offer biomedical researchers using Real-Time PCR its support on
the level of technical and scientifi c information about this powerful and still developing technology, as
well as our commitment to continuous research and development of new instruments, software and
reagents.
Preface
21020908 RealTime PCR Application Manual.indb 821020908 RealTime PCR Application Manual.indb 8 06.02.2009 14:14:1906.02.2009 14:14:19

9Introduction
1
1
An Introduction to PCR
Twenty years ago, the Polymerase Chain Reaction (PCR) - an amazingly simple idea - was described as
the revolutionary scientifi c technique of the 20th century (see VanGuilder, H.D. et al. (2008). “Twenty-fi ve
years of quantitative PCR for gene expression analysis.” Biotechniques 44(5): 619-26).
The reason for its extraordinary success is that PCR solved a fundamental problem biologists faced at
that time - how to perform de novo DNA synthesis in vitro, thus allowing to amplify any desired target
sequence, the original concentration of which, in most cases, is too small for downstream examination.
Basically, PCR is an enzymatic DNA amplifi cation process, mimicking to some extent in vivo replication,
divided into a series of cycles. Theoretically, if optimal reaction conditions exist, every cycle of the PCR
process doubles the amount of the desired DNA fragment available, resulting in exponential product
accumulation. If enough molecules have been newly synthesized, the amplicons can be visualized by
means of fl uorescent dyes. Impressively, the PCR technique is so sensitive that it can detect just one
molecule in a complex DNA sample.
Within a few years, the Polymerase Chain Reaction took the world’s biological laboratories by storm
and became the key technology in the fi eld of molecular biology. The generation of virtually unlimited
amounts of specifi c PCR products made many new methods of DNA analysis possible, such as downstream
modifi cations (e.g., cloning of the PCR product to establish gene libraries) or comprehensive product
analysis techniques (e.g., gene expression or genotyping analysis).
It all started in 1983 with an idea by Kary Mullis, who worked as a scientist for Cetus, a small, innovative
California biotech company. Modestly he recounts the “combination of coincidence, naiveté and a series
of lucky errors,” which led him to the PCR technique, this captivatingly simple method of effectively
mass-duplicating DNA. PCR reaped the highest scientifi c honor for its inventor in record time. In 1993, just
ten years after his brilliant idea, Kary Mullis received the Nobel Prize for Chemistry.
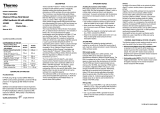
PCR Step 1: Denaturation of template by heat PCR Step 2: Annealing of primers to template
PCR Step 3: Extension of primers with thermostable
polymerase
End of the fi rst PCR cycle: Two copies of target
sequence
Figure 1: The PCR Principle. PCR is a cyclic DNA amplifi cation process. Each cycle involves three steps, which are described in
detail above.
An Introduction to PCR
21020908 RealTime PCR Application Manual.indb 921020908 RealTime PCR Application Manual.indb 9 06.02.2009 14:14:1906.02.2009 14:14:19

10
1
1
LightCycler
®
Real-Time PCR Systems - Application Manual
Real-Time PCR
The invention of Real-Time PCR technology represented another revolutionary leap forward in the fi eld
of DNA analysis. This advanced version of the conventional original PCR method makes powerful new
qualitative and quantitative DNA analysis possible, in addition to highly sensitive DNA amplifi cation.
The key feature of this innovative PCR technique is the ability to monitor the DNA amplifi cation process
as it happens. Both the enzymatic PCR process itself and detection of the PCR product occur in the same
reaction vessel.
Monitoring Real-Time PCR requires dedicated instrumentation capable of collecting data online
from every cycle. Real-Time PCR instruments measure PCR product accumulation by means of dyes
that fl uoresce in the presence of DNA. This may be accomplished directly with intercalating dyes,
which bind to the double stranded DNA (e.g., SYBR Green I), or indirectly with fl uorescence-labeled
oligonucleotides (commonly known as fl uorescent probes), which recognize and bind by base pairing to
a specifi c region or site on one DNA strand. Measurement of fl uorescence at every PCR cycle allows the
product accumulation to be displayed on a plotted curve. The amount of fl uorescence is proportional
to the amount of PCR product in the reaction vessel. If a specifi c target DNA is present in a sample,
the time it takes (or number of cycles required) to generate a detectable signal depends on its initial
concentration in the sample. Use of this cycle number information thus enables easy qualitative and
quantitative gene analysis.
Higuchi and co-workers at Roche Molecular Systems and Chiron initially demonstrated Real-Time PCR
(Higuchi, R., C. Fockler, et al. (1993). “Kinetic PCR analysis: real-time monitoring of DNA amplifi cation
reactions.” Biotechnology 11(9): 1026-30.). By including a common fl uorescent dye (ethidium bromide,
EtBr) in the PCR mix and running the reaction under ultraviolet light (which causes EtBr to fl uoresce), they
were able to visualize and record the accumulation kinetics of PCR products. This powerful new technology
quickly matured, dramatically simplifying the recognition and analysis of amplicons.
With Real-Time PCR and especially the Roche Applied Science LightCycler® Systems, minimal amounts
of DNA can be replicated very rapidly and detected easily.
The LightCycler® Carousel-based System (LightCycler® 1.5 and 2.0 Instruments) has repeatedly set
new standards for Real-Time PCR since its fi rst introduction in 1997. It was the fi rst system to support
hybridization probes, variant identifi cation based on the automated grouping of melting curve profi les,
automated absolute quantifi cation, and relative quantifi cation with effi ciency correction ( -method).
First presented in 2005, the LightCycler® 480 Real-Time PCR System extends LightCycler® System ac-
curacy, speed, and versatility to medium- and high-throughput applications in gene expression and
genotyping analysis.
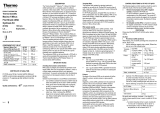
Figure 2: LightCycler
®
Carousel-based
Instruments and LightCycler
®
480
Instrument.
Real-Time PCR
21020908 RealTime PCR Application Manual.indb 1021020908 RealTime PCR Application Manual.indb 10 06.02.2009 14:14:2006.02.2009 14:14:20

11Introduction
1
1
Principles of Kinetic PCR
Real-time instruments allow researchers to follow the amplifi cation of DNA molecules and – indirectly
via fl uorescence measurements – observe the accumulation of PCR products as it happens. Since the
entire course of DNA amplifi cation in each vessel is monitored, Real-Time PCR is also called kinetic
PCR. The kinetics of PCR amplifi cation in a single sample, if plotted on a graph (number of amplifi ed
molecules against number of cycles), has a sigmoid profi le resembling a bacterial growth curve (see
Figure 3 below). The reality seems to contradict the theory, but it agrees with the fact that PCR is an
enzymatic process. Every enzymatic process can be described by a sigmoidal curve profi le, which results
from processes in which a period of maximum enzymatic activity is followed by a period of reduced
activity (called the plateau phase).
Amplicons (Fluorescence)
number of cycles
Reality
Theory
background
plateau
number of cycles
amount of PCR product
expotential growth
Figure 3
Detailed analysis of the PCR kinetic profi le reveals that the curve may be divided into three characteristic
phases: the early background phase, the middle exponential growth phase (or log linear phase), and the
late plateau phase.
The early PCR phase is characterized by background fl uorescence (shaded area in Figure 4, next page)
and represents the part of the PCR that cannot be seen with any modern technique. With every PCR
cycle the product amount increases until its fl uorescence intensity exceeds background. The PCR cycle
at which product fl uorescence intensity fi nally rises above background and becomes visible is called the
crossing point (Cp). At this point in the PCR, there are approximately 10
10
to 10
12
amplifi ed molecules in
the reaction tube. Quantifi cation with Real-Time PCR is performed at this stage of the reaction.
The exponential PCR phase begins as the product fl uorescence rises above the background. Theoreti-
cally, the rate of product amplifi cation is maximal during this part of the reaction; hence the effi ciency
of this part of the reaction equals two and the amount of product doubles in every cycle under optimal
operating conditions.
Principles of Kinetic PCR
21020908 RealTime PCR Application Manual.indb 1121020908 RealTime PCR Application Manual.indb 11 06.02.2009 14:14:2006.02.2009 14:14:20

12
1
1
LightCycler
®
Real-Time PCR Systems - Application Manual
Finally, late in the PCR, the reaction enters the plateau phase, which is characterized by lower
product accumulation rates and continuously varying effi ciency. The observed decrease in enzymatic
activity during the late phases of PCR may be caused by steadily changing reaction conditions
(e.g., reduced concentrations of substrates such as dNTPs), increasing accumulation of by-products (e.g.,
pyrophosphate), increases in competitor (side) reactions, or re-annealing of amplifi cation product.
visible in PCR
Detection Limit
invisible
PCR Kinetics
Real-time
PCR
Conventional
PCR
Cycle number
Number of amplified molecules
Melting Curve
Analysis
Endpoint
Analysis
Quantification
Analysis
1.00E+13
1.00E+12
1.00E+11
1.00E+10
1.00E+04
1.00E+00
Plateau Phase
Exponential Phase
Background Phase
13 2527 393331 373523 4129 451917 2113 159711543
Figure 4
For theoretical considerations on PCR, the exponential phase is often divided further into two subsections:
a short section above the background phase (the “exponential amplifi cation phase”) and a subsequent
longer part (the “linear amplifi cation phase,” which is defi ned by a steep increase in the fl uorescence
signal).
Principles of Kinetic PCR
21020908 RealTime PCR Application Manual.indb 1221020908 RealTime PCR Application Manual.indb 12 06.02.2009 14:14:2106.02.2009 14:14:21

13Introduction
1
1
Acquisition of Fluorescence Signal
Cycle-by-Cycle Measurement
Only the early exponential phase can be used for quantifi cation of initial sample input, because only this
phase follows predictable and optimal kinetics.
Figure 5: Overall temperature profi le of a typical
PCR reaction.
In Real-Time PCR, data analysis makes use of the time (or PCR cycle) at which the target amplifi cation
is fi rst detected. This value, known as Cp
, is representative of the initial exponential phase. There is a
correlation between Cp and concentration: the higher the concentration of target nucleic acid in the
starting material, the sooner a signifi cant increase in fl uorescent signal will be observed, yielding a lower
Cp. This correlation between amount of template and value of Cp facilitates all types of Real-Time PCR-
based quantitative analysis.
crossing point (C
p
)
C
p
value
amount of template
Figure 6: Amplifi cation curves in Real-Time
PCR; correlation between C
p
and concen-
tration.
Acquisition of Fluorescence Signal
Cycle-by-Cycle Measurement
21020908 RealTime PCR Application Manual.indb 1321020908 RealTime PCR Application Manual.indb 13 06.02.2009 14:14:2106.02.2009 14:14:21

14
1
1
LightCycler
®
Real-Time PCR Systems - Application Manual
Because of this relationship between Cp and starting concentration, Real-Time PCR makes data
acquisition and analysis during the exponential phase easy and therefore allows sensitive quantifi cation
of a given target. Furthermore, the data gathering capabilities of Real-Time PCR instruments make
it possible to detect DNA over a broad range of concentrations - typically more than ten orders of
magnitude.
Figure 7: Real-Time PCR dynamic range.
In addition to visualization of the amplifi cation process, Real-Time PCR instruments provide several
different methods of qualitative (e.g., bacterial identifi cation) and quantitative (e.g., gene expression)
analysis. During the last decade, Real-Time PCR instrument manufacturers have put great effort into
improving the analytical capabilities of the instrument software.
Since PCR amplifi cation and detection takes place in the same tube, Real-Time PCR techniques no lon-
ger require the cumbersome and time-consuming post-PCR analysis steps associated with conventional
PCR. Thus, one source of contamination and variability in results is eliminated in qualitative and quan-
titative Real-Time PCR analysis.
Acquisition of Fluorescence Signal
Cycle-by-Cycle Measurement
21020908 RealTime PCR Application Manual.indb 1421020908 RealTime PCR Application Manual.indb 14 06.02.2009 14:14:2106.02.2009 14:14:21

15Introduction
1
1
Melting Curves
Real-Time PCR provides results based not only on the amplifi cation reaction (qualitative detection and
quantitative analysis), but also on additional data generated during post-amplifi cation melting curve
experiments. These additional results are highly useful for DNA product characterization.
Figure 8: Temperature profi le of post-PCR melting
curve analysis (red box).
For post-PCR product characterization, PCR products are melted as the reaction chamber temperature
is slowly increased (from approx. 45°C to 95°C). During the melting process the fl uorescence signal
decreases, due to the release of bound dye molecules as double-stranded DNA molecules become single-
stranded. Changes in the fl uorescence signal are continuously monitored. The resulting melting curve is
usually converted to a “fi rst derivative” plot for easier analysis (-dF/dT plotted as a function of T). Each
product in an amplicon mixture can be characterized by its specifi c melting point, which depends main-
ly on GC content and length of the amplicon sequence. In summary, this Real-Time PCR procedure for
amplifi cation product characterization makes post-PCR handling steps like agarose gel electrophoresis
unnecessary and reduces both intra- and inter-assay variability of results.
Figure 9: Use of SYBR Green I dye for PCR product
characterization.
Acquisition of Fluorescence Signal
Melting Curves
21020908 RealTime PCR Application Manual.indb 1521020908 RealTime PCR Application Manual.indb 15 06.02.2009 14:14:2106.02.2009 14:14:21

16
1
1
LightCycler
®
Real-Time PCR Systems - Application Manual
Another group of melting curve assays rely on the sequence-specifi c binding of fl uorophore-labeled
oligonucleotide probes which bind to complementary sequences in targets. This specifi city of interaction
between target and probes can be used to extract even more information on the amplicon´s character-
istics. For instance, if a SNP (single nucleotide polymorphism) exists in the region that binds to the
probe, the probe-target hybrid is destabilized and melts at a lower temperature than a hybrid between
the probe and the perfectly matching sequence, thus allowing this technique to be used for genotyping
(SNP detection).
Figure 10: Melting curve analysis with
fl uorescence-labeled probes.
Acquisition of Fluorescence Signal
Melting Curves
21020908 RealTime PCR Application Manual.indb 1621020908 RealTime PCR Application Manual.indb 16 06.02.2009 14:14:2206.02.2009 14:14:22

17Introduction
1
1
High Resolution Melting (HRM), a third melting curve analysis method, is a more recently developed
refi nement of the thermal dissociation principle. For initial detection of sequence variations, differences
in the melting curves of the amplicons are analyzed, using special unspecifi c, highly saturating fl uorescent
dyes instead of probes. DNA from heterozygote samples forms heteroduplexes that begin to separate into
single strands at a lower temperature and with a different curve shape than DNA from homozygotes.
In many cases, depending of course on the specifi c sequences present, homozygote samples differing in
only one base pair (e.g., wild-type and mutants,) can be differentiated with this method, too.
Figure 11: HRM analysis with non-specifi c,
saturating DNA dyes allows differentiation of
homo- and heterozygotes.
Acquisition of Fluorescence Signal
Melting Curves
21020908 RealTime PCR Application Manual.indb 1721020908 RealTime PCR Application Manual.indb 17 06.02.2009 14:14:2206.02.2009 14:14:22

18
1
1
LightCycler
®
Real-Time PCR Systems - Application Manual
Detection Formats
All Real-Time PCR systems detect PCR products by means of fl uorescent dyes. There are several dye-
based methods used in product detection, characterization or quantifi cation. Dyes can either be used
as such and just added to the PCR master mixes, or attached covalently to oligonucleotides used as
sequence –specifi c probes. The resulting, most commonly used assay formats - SYBR Green I, HybProbe
probes, and hydrolysis probes - are described in the following.
SYBR Green I
SYBR Green I is a dye that binds to all double-stranded DNA molecules, regardless of sequence. When
SYBR Green I dye intercalates into dsDNA, its fl uorescence increases signifi cantly. During the different
stages of PCR, the intensity of this fl uorescence will vary, depending on the amount of dsDNA present.
Figure 12: PCR in the presence of SYBR Green I.
SYBR Green I dye only fl uoresces when it is bound to double-stranded DNA (dsDNA) and excited by blue light. SYBR Green I does
not bind to single-stranded DNA, so fl uorescence is minimal during denaturation. As dsDNA forms (panel A) and is synthesized
(panel B), SYBR Green I binds the dsDNA and the fl uorescent signal from the bound SYBR Green I (green light) increases. At
the end of elongation (panel C), all DNA is double-stranded, the maximum amount of SYBR Green I is bound and the fl uorescent
signal is at its maximum for that PCR cycle. Therefore, the fl uorescent signals from SYBR Green I are measured at the end of each
elongation phase.
LightCycler
®
480 ResoLight Dye
LightCycler® 480 ResoLight Dye belongs to a new generation of dsDNA-binding dyes that can detect
the presence of heteroduplexes formed during PCR (e.g., if the sample is heterozygous for a particular
mutation). Its possible applications therefore exceed those of other, more traditional DNA-staining dyes
like SYBR Green I.
LightCycler® 480 ResoLight Dye is not toxic to amplifi cation enzymes. Thus, high concentrations of
the dye do not affect the PCR. These high concentrations completely saturate the dsDNA in the sample.
Therefore, when dye molecules dissociate from dsDNA during melting, there is only little chance for
them to re-bind to other unoccupied sites. This makes the melting process highly homogeneous and the
acquired signals very sharp. Under these conditions, even small changes in the melting curve result in
subtle, but reproducible changes in fl uorescence.
homoduplexes
heteroduplexes
VS
VS
SYBR Green I
ResoLight
Figure 13: ResoLight dye - unlike SYBR Green I - does not make
dye/DNA complexes form or melt differently. Only sequence
differences (full match or mismatch) change melting behaviour, making
them detectable with this dye.
Detection Formats
SYBR Green I / LightCycler
®
480 ResoLight Dye
A B C
21020908 RealTime PCR Application Manual.indb 1821020908 RealTime PCR Application Manual.indb 18 06.02.2009 14:14:2306.02.2009 14:14:23

19Introduction
1
1
Principles of Specifi c Probe Assays
HybProbe - and hydrolysis probe assays are sequence-specifi c techniques, relying on oligonucleotide
probes that hybridize to their complementary sequence in the target PCR product and thus only detect
this specifi c product. Both formats take advantage of the FRET principle (Fluorescence Resonance Energy
Transfer). Whereas HybProbe probes emit fl uorescence via FRET when they bind target, the fl uorescence
of hydrolysis probes is quenched by FRET in the unbound state and they must be hydrolyzed by Taq
DNA polymerase after binding to the target sequence to emit fl uorescence.
HybProbe Probes
The unique LightCycler® HybProbe format is based on the FRET principle. Two sequence-specifi c
oligonucleotide probes are labeled with different dyes (donor and acceptor), and are added to the
reaction mix along with the PCR primers. During the annealing phase, HybProbe probes hybridize to
the target sequences on the amplifi ed DNA fragment in a head-to-tail arrangement, thereby bringing the
two dyes into close proximity.
The donor dye (fl uorescein) is excited by blue light at ~470 nm. When the two dyes are close to each
other (within 1-5 nucleotides), the energy emitted by the donor dye excites the acceptor dye attached to
the second HybProbe probe, which then emits fl uorescent light at a different wavelength. The amount
of fl uorescence is directly proportional to the amount of target DNA generated during the PCR process.
HybProbe probes are displaced, but not cleaved, during the elongation and denaturation steps.
Figure 14: Principle of target detection by HybProbe probes.
Panels A-C show the behavior of HybProbe probes during different stages of PCR. In the example shown, the donor dye probe has
a fl uorescein label at 3’ end, and the acceptor dye probe has a LightCycler
®
Red label at its 5’ end (note that this setup might also
be reversed, i.e., donor dye at the 5’ and acceptor dye at the 3’ end). Hybridization does not occur during the denaturation phase of
PCR (panel A). Since the distance between the unbound dyes prevents energy transfer, no fl uorescence will be emitted by the red
acceptor dye during this phase. In panel B, the probes hybridize to the amplifi ed DNA fragment in a head-to-tail arrangement, thereby
bringing the two fl uorescent dyes close to each other. Fluorescein is exited by blue light which causes it to emit green fl uorescent
light. The emitted energy excites the LightCycler
®
Red dye. After annealing, an increase in temperature leads to elongation and
displacement of the probes. At the end of the elongation step, the PCR product is double-stranded, while the displaced HybProbe
probes are back in solution and too far apart to allow FRET to occur (panel C). The red fl uorescence emitted by the second probe
is measured at the end of each annealing step (panel B), when the fl uorescence intensity has reached its maximum.
Detection Formats
Principles of Specifi c Probe Assays / HybProbe Probes
A B C
21020908 RealTime PCR Application Manual.indb 1921020908 RealTime PCR Application Manual.indb 19 06.02.2009 14:14:2306.02.2009 14:14:23

20
1
1
LightCycler
®
Real-Time PCR Systems - Application Manual
Hydrolysis Probes
Hydrolysis probe assays, conventionally called TaqMan® assays, can technically be described as homo-
genous 5´ nuclease assays, since a single 3´ non-extendable hydrolysis probe, which is cleaved during PCR
amplifi cation, is used to detect the accumulation of a specifi c target DNA sequence. This single probe
contains two labels, a fl uorescence reporter and a fl uorescence quencher, in close proximity to each other.
When the probe is intact, the quencher dye is close enough to the reporter dye to suppress the reporter
fl uorescent signal (fl uorescence quenching takes place via FRET). During PCR, the 5´ nuclease activity of
the polymerase cleaves the hydrolysis probe, separating the reporter and quencher. In the cleaved probe,
the reporter is no longer quenched and can emit a fl uorescence signal when excited.
Figure 15: Schematic diagram of the Hydrolysis Probes format.
Panels A-D show the behavior of hydrolysis probes during PCR. The probe carries two fl uorescent dyes in close proximity, one of
which (quencher) quenches the fl uorescence from the other (reporter) as long as the probe is intact. In the denaturation phase
(panel A), the strands of the target DNA separate as the temperature increases. During the annealing phase (panel B), primers and
probes specifi cally anneal to the target sequence (the hydrolysis probe is phosphorylated at the 3’ end, so it cannot be extended).
As the DNA polymerase extends the primer, the 5’ nuclease activity of the enzyme will cleave the probe (panel C), allowing the
reporter dye to emit green fl uorescence. The probe fragments are then displaced from the target and polymerization of the new
amplicon continues (panel D). The DNA polymerase will separate the reporter and quencher only if the probe has hybridized to the
target. Accumulation of PCR products is detected directly by monitoring the increase in green fl uorescence from the reporter dye.
The fl uorescent signal of the reporter dye is measured at the end of each elongation phase (panel C).
Universal ProbeLibrary (UPL)
UPL probes are a special type of hydrolysis probes. These short LNA-modifi ed probes (8-9mers; 165
pre-designed UPL probes in total) detect a specifi c PCR amplicon, but also bind to more than one site in
the transcriptome. However, their combination with suitable target-specifi c primers results in a target-
specifi c assay. Primers and probes for UPL assays can both be easily designed and selected using the free,
web-based Assay Design Center (for more information, see “Recommendations for Using the Universal
ProbeLibrary” in chapter 3, Assay Development: Tips and Tricks).
Flexibility
Specificity
Probe
based
assays
Universal
ProbeLibrary
SYBR
Green I
Figure 16: UPL assays represent a unique
combination of specifi city and fl exibility.
Detection Formats
Hydrolysis Probes / UPL
A B C D
21020908 RealTime PCR Application Manual.indb 2021020908 RealTime PCR Application Manual.indb 20 06.02.2009 14:14:2406.02.2009 14:14:24
/