Page is loading ...

For Research Use Only. Not for use in diagnostic procedures.
Applied Biosystems™ High Resolution Melt
Curve Analysis Module
USER GUIDE
Publication Number MAN0014823
Revision B.0

The information in this guide is subject to change without notice.
DISCLAIMER
TO THE EXTENT ALLOWED BY LAW, LIFE TECHNOLOGIES AND/OR ITS AFFILIATE(S) WILL NOT BE LIABLE FOR SPECIAL, INCIDENTAL, INDIRECT,
PUNITIVE, MULTIPLE, OR CONSEQUENTIAL DAMAGES IN CONNECTION WITH OR ARISING FROM THIS DOCUMENT, INCLUDING YOUR USE OF IT.
REVISION HISTORY: History of Pub. no. MAN0014823
Revision Date Description
B.0 March 2015 Software user interface updates
A.0 September 2015 Document release
NOTICE TO PURCHASER: DISCLAIMER OF LICENSE: Purchase of this software product alone does not imply any license under any process,
instrument or other apparatus, system, composition, reagent or kit rights under patent claims owned or otherwise controlled by Life Technologies
Corporation, either expressly, or by estoppel.
Corporate entity: Life Technologies Corporation | Carlsbad, CA 92008 USA | Toll Free in USA 1 800 955 6288
TRADEMARKS: All trademarks are the property of Thermo Fisher Scientific and its subsidiaries unless otherwise specified.
©2016 Thermo Fisher Scientific Inc. All rights reserved.

Contents
■CHAPTER 1 Getting Started ............................................. 6
About the software .............................................................. 6
Analysis workflows .............................................................. 8
Compatible Real-Time PCR System Data ........................................... 9
System requirements ........................................................... 10
About the software interface ..................................................... 11
Best practices and tips for using the software ..................................... 11
■CHAPTER 2 Manage experiment data ................................ 12
Create a project and add experiment data ......................................... 12
Manage projects and experiment data ............................................ 13
Share experiments, folders, and projects ......................................... 14
About experiment data/files ..................................................... 16
■CHAPTER 3 Set up the project ......................................... 17
Manage samples and targets .................................................... 17
Manage HRM controls .......................................................... 18
HRM controls ............................................................. 18
High-resolution melt (HRM) dyes ................................................. 18
Custom HRM dyes ......................................................... 19
High-Resolution Melt (HRM) reagents and controls ................................. 19
■CHAPTER 4 Edit experiment properties .............................. 20
Review and edit the plate setups ................................................. 21
Apply samples and targets ...................................................... 21
Specify and assign tasks ........................................................ 22
Import an HRM calibration from an external file ................................... 23
Apply plate setup information using a template file ................................. 23
Set the PCR stage for an experiment ............................................. 24
Template files ................................................................. 25
Applied Biosystems™ High Resolution Melt Curve Analysis Module
3

■CHAPTER 5 Analyze the project ....................................... 27
Configure the analysis settings .................................................. 27
Review the quality data ......................................................... 28
Review HRM genotyping data .................................................... 30
Analysis workflow for HRM genotyping ....................................... 31
Review the controls and replicate populations for outliers ...................... 31
Review and adjust the pre- and post-melt regions ............................. 33
Confirm the genotype calls .................................................. 34
Review HRM mutation detection data ............................................. 35
Analysis workflow for HRM mutation detection ................................ 35
Review and adjust the pre- and post-melt regions ............................. 36
Review the controls and replicate populations for outliers ...................... 37
Review the Difference Melt Curves Plot for outliers ............................ 38
Confirm the software calls .................................................. 38
Review HRM methylation data ................................................... 39
Analysis workflow for HRM methylation study ................................. 39
Review the controls and replicate populations for outliers ...................... 40
Review and adjust the pre- and post-melt regions ............................. 41
Review the Difference Plot for outliers ........................................ 42
Confirm the software calls .................................................. 42
Review the Multicomponent plot ................................................. 43
Review the Amplification Plot .................................................... 44
Perform manual calls .......................................................... 45
Omit wells from the analysis .................................................... 46
■CHAPTER 6 Export the results ........................................ 47
Export the analyzed data from a project ........................................... 47
Export project data as a slide presentation ........................................ 48
Export plots for presentation and publication ...................................... 49
Export data for use in other projects .............................................. 50
■CHAPTER 7 Screens and plots ......................................... 51
Aligned Melt Curve Plot ......................................................... 51
Amplification Plot .............................................................. 53
Derivative Melt Plot ............................................................ 54
Difference Melt Plot ............................................................ 55
Multicomponent Plot ........................................................... 56
Raw Melt Curve Plot ............................................................ 57
Well Table ..................................................................... 58
Contents
4
Applied Biosystems™ High Resolution Melt Curve Analysis Module

■CHAPTER 8 Quality flags ............................................... 60
AMPNC (Amplification in negative control) quality flag .............................. 61
AMPSCORE (Low signal in linear phase) quality flag ................................ 61
BADROX (Bad passive reference signal) quality flag ................................ 62
BLFAIL (Baseline algorithm failed) quality flag ..................................... 62
CQCONF (Calculated confidence in the Cq value is low) quality flag ................... 63
CTFAIL (Cq algorithm failed) quality flag .......................................... 63
DRNMIN (Detection of minimum ΔRn due to abnormal baseline) quality flag ........... 63
EXPFAIL (Exponential algorithm failed) quality flag ................................. 64
HIGHSD (High standard deviation in replicate group) quality flag ..................... 65
MTP (Multiple Tm peaks for HRM) quality flag ..................................... 66
NOAMP (No amplification) quality flag ............................................ 66
NOISE (Noise higher than others in plate) quality flag ............................... 67
NOSAMPLE (No sample assigned to well) quality flag ............................... 67
NOSIGNAL (No signal in well) quality flag ......................................... 67
OFFSCALE (Fluorescence is offscale) quality flag ................................... 68
OUTLIERRG (Outlier in replicate group) quality flag ................................. 68
PRFDROP (Passive reference signal changes significantly near the Cq/Ct) quality flag .. 69
PRFLOW (Average passive reference signal is below the threshold) quality flag ........ 69
SPIKE (Noise spikes) quality flag ................................................. 70
THOLDFAIL (Thresholding algorithm failed) quality flag ............................. 70
■APPENDIX A Documentation and support ............................ 72
Customer and technical support ................................................. 72
Limited product warranty ....................................................... 72
Glossary ................................................................... 73
References ................................................................ 76
Contents
Applied Biosystems™ High Resolution Melt Curve Analysis Module
5

Getting Started
■About the software .................................................... 6
■Analysis workows ................................................... 8
■Compatible Real-Time PCR System Data ................................. 9
■System requirements ................................................. 10
■About the software interface ........................................... 11
■Best practices and tips for using the software ............................. 11
The Applied Biosystems™ Analysis Software is a secure web application for analysis
of data generated on Thermo Fisher Scientic real-time PCR instruments. The
software provides project-based analysis of real-time and end-point data for a variety
of quantitative and qualitative PCR applications.
About the software
The High Resolution Melt (HRM) module of the Applied Biosystems™ Analysis
Software performs high-resolution melt analysis of experiments run on Thermo Fisher
Scientic real-time qPCR instruments. The HRM analysis is a post-PCR analysis
method used for identifying genetic variation in nucleic acid sequences. Simple and
fast, this method is based on PCR melt (dissociation) curve techniques and is enabled
by the recent availability of improved double-stranded DNA (dsDNA)–binding dyes
along with next-generation real-time PCR instrumentation and analysis software.
HRM analysis can discriminate DNA sequences based on their composition, length,
GC content, or strand complementarity.
The Applied Biosystems™ Analysis Software can perform:
•Mutation scanning experiments – Screen DNA samples for new single-base
changes, insertions/deletions, or other unknown mutations. The mutation
scanning experiment product can be used for subsequent sequencing reactions.
•Methylation studies – Determine the percentage of methylated DNA in
unknown samples.
•Genotyping experiments – Determine the genotype of a DNA sample. For all
types of experiments, the software compares the melt curves of unknown
samples against the melt curves of positive controls to identify groups of variants.
1
6
Applied Biosystems™ High Resolution Melt Curve Analysis Module

Required experiment components
The following components are required to perform an analysis and must be present
on all experiments added to the project:
•Samples – A sample in which the genotype, variant content, or percentage
methylation is unknown.
•Replicates – The total number of identical reactions containing identical samples,
components, and volumes.
•Positive Controls – A sample that contains a known genotype, target sequence,
or standard. The type of samples used as positive controls depends on the type of
experiment:
–Mutation scanning experiments – One or more samples with the wild type
sequence are used as the control. For unknowns, the call is either “wild type”
(if it matches the control) or “variant X”.
–Methylation studies – Methylated DNA standards that contain from 0% to
100% methylated DNA are used as the positive controls. The software
identies the percentage methylation of the variants based on their
comparison to the standards.
–Genotyping experiments – Three samples are used as controls: one
homozygous for Allele 1, one homozygous for Allele 2, and one
heterozygous for both alleles (Allele 1 and Allele 2). The software identies
the genotypes of the unknown variants.
•Negative Controls – Wells that contain water or buer instead of sample
template. No amplication of the target should occur in negative control wells.
Chapter 1 Getting Started
About the software
1
Applied Biosystems™ High Resolution Melt Curve Analysis Module
7

Analysis workflows
The following gure shows the general workow for analyzing high resolution melt
projects using the Applied Biosystems™ Analysis Software.
START
q
Create a project
q
Import and add experiment data
q
(Optional) Add and define samples, targets, and controls
q
Review/edit the sample, target, task, and control configurations of the
experiments
q
Review the results of the analysis and adjust the settings (if necessary)
q
Publish the project data
q
FINISH
Chapter 1 Getting Started
Analysis workflows
1
8
Applied Biosystems™ High Resolution Melt Curve Analysis Module

Compatible Real-Time PCR System Data
The Applied Biosystems™ Analysis Software can import and analyze data generated
by any of the supported instruments listed in the following table. The software
versions listed in the table represent only those tested for use with the Applied
Biosystems™ Software. Data generated by versions other than those listed can be
imported and analyzed by the software, but are not supported by Thermo Fisher
Scientic.
IMPORTANT! The Applied Biosystems™ Analysis Software can import and analyze
data from unsupported versions of the instrument software; however, we cannot
guarantee the performance of the software or provide technical support for the
analyses.
Real-Time PCR System Supported software
version(s)
File
extension
Applied Biosystems™ 7500 and 7500 Fast Real-
Time PCR System v2.0.5 or later
.eds
Applied Biosystems™ StepOne™ and StepOnePlus™
Real-Time PCR System v2.0.1, v2.1, or later
Applied Biosystems™ ViiA™ 7 Real-Time PCR
System v1.1 or later
Applied Biosystems™ QuantStudio™ 12K Flex Real-
Time PCR System v1.1.1 or later
Applied Biosystems™ QuantStudio™ 3 Real-Time
PCR System
v1.0 or later
Applied Biosystems™ QuantStudio™ 5 Real-Time
PCR System
Applied Biosystems™ QuantStudio™ 6 Flex Real-
Time PCR System
v1.0 or later
Applied Biosystems™ QuantStudio™ 7 Flex Real-
Time PCR System
Chapter 1 Getting Started
Compatible Real-Time PCR System Data
1
Applied Biosystems™ High Resolution Melt Curve Analysis Module
9

System requirements
The following table summarizes the system requirements for the user environment.
Applied Biosystems™ Analysis Software performance may vary based on your system
conguration.
Category Requirement
Web Browser • Apple™ Safari™ 8 Browser
• Google™ Chrome™ Browser Version 21 or later
• Microsoft™ Internet Explorer™ Browser Version 10 or later
• Mozilla™ Firefox™ Browser Version v10.0.12 or later
Operating
System
• Windows™ XP, Vista, 7, or 8
• Macintosh™ OS 8 or later
Network
Connectivity
An internet connection capable of 300kbps/300kbps (upload/download)
or better.
If your network employs a firewall that restricts outbound traffic, it
must be configured to allow outbound access to
apps.lifetechnologies.com on HTTPS-443.
Chapter 1 Getting Started
System requirements
1
10
Applied Biosystems™ High Resolution Melt Curve Analysis Module

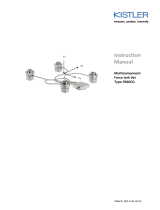
About the software interface
The Applied Biosystems™ Software features a simple interface for analyzing
experiment data and includes the following buons/icons in many of the screens and
plots:
3
2
1
8 97654
12
10
11
1Analysis Modules – Click to analyze the current project
using the selected module.
2 (Data Manager) – Click to view the Data Manager,
which can be used to view, add, or remove data from the
current project.
3 (Project Manager) – Click to view the Project
Manager, which can be used to modify the current project
or open another.
4 (Account Management Menu) – Click to manage your
application licenses or storage.
5Project name – The name of the current project.
Note: Click to close the project.
6Project tabs – Click to view the settings, data, or plot(s)
for the current project.
7 (Notifications) – Click to view important information
and notifications for the current project. The digit within
the icon indicates the number of messages.
8 (Help) – Click to access help topics relevant to the
current settings, data, or plot that you are viewing.
9 (Profile Menu) – Click to change your profile settings
or to log out of the Applied Biosystems™ Software.
10 Analyze – Click to analyze the project after you have
made a change.
11 (Zoom) – Click to magnify the related table or plot to
fill the screen.
Note: Once expanded, click (Close) to collapse the
plot or table to its original size.
12 Actions – Click to select from a list of actions that pertain
to the related table or plot.
Best practices and tips for using the software
The Applied Biosystems™ Analysis Software provides a variety of useful user
interface elements that will enable you to beer organize your data for analysis and
presentation. This topic describes the essentials of the user interface and how to best
use them.
Perform the following actions to help ensure optimal performance of the Applied
Biosystems™ Software:
• Refresh your browser regularly
• Clear your browser cache
Chapter 1 Getting Started
About the software interface
1
Applied Biosystems™ High Resolution Melt Curve Analysis Module
11

Manage experiment data
■Create a project and add experiment data ................................ 12
■Manage projects and experiment data ................................... 13
■Share experiments, folders, and projects ................................. 14
■About experiment data/les ........................................... 16
Use the Data Manager screen to add and remove experiments to and from your
project. The screen displays all experiments associated with the current project. You
can also use the Data Manager to upload new .eds and .sds les or view the details of
individual experiments already added to the project.
Create a project and add experiment data
1. Click (Manage Projects) to view the Dashboard.
2. Create the project:
a. Click New Project.
b. In the Create Project dialog box, enter a name for the project, select the
folder within which you want to place the project, then click OK.
Note: The project name cannot exceed 50 characters and cannot include any
of the following characters: / \ < > * ? " | : ; & % $ @ ^ ( ) !
2
12
Applied Biosystems™ High Resolution Melt Curve Analysis Module

3. From the Manage Data screen, add any additional experiment data to the project.
To import
experiment data
stored on…
Action
Your computer
1. Click Import from local.
2. From the Open dialog box, select one or more experiment
files (.sds or .eds), then click Open.
Note: Ctrl- or Shift-click to select multiple files.
Wait for the Applied Biosystems™ Software to upload the
selected data.
3. Click Close prompted that the import is complete.
Thermo Fisher
Cloud
1. Click Import from Thermo Fisher Cloud.
2. Select one or more experiment files (.sds or .eds) from
the table, then click Add.
3. When you are done adding files to the queue, click OK.
4. Click Close prompted that the import is complete.
4. Repeat step 3 until your project contains all of the desired experiment data.
5. Click the appropriate analysis module on the left side of the screen to begin the
analysis.
Manage projects and experiment data
Use the Manage Data screen to add and remove experiment data to/from your project:
•Add experiment data to your project:
a. While viewing your project, click (Manage Data) from the bar on the left
side of the screen.
b. From the Manage Data screen, add any additional experiment data to the
project.
To import
experiment data
stored on…
Action
Your computer
1. Click Import from local.
2. From the Open dialog box, select one or more
experiment files (.sds or .eds), then click Open.
Note: Ctrl- or Shift-click to select multiple files.
Thermo Fisher
Cloud
1. Click Import from Thermo Fisher Cloud.
2. Select one or more experiment files (.sds or .eds)
from the table, then click Add.
3. When you are done adding files to the queue, click OK.
Chapter 2 Manage experiment data
Manage projects and experiment data
2
Applied Biosystems™ High Resolution Melt Curve Analysis Module
13

c. Wait for the Applied Biosystems™ Software to import the selected data.
When you are prompted that the upload is complete, click Close.
•Delete projects, experiments, or folders:
a. Select the experiments from the Files in this project table that you want to
remove.
b. From the Manage Data screen, select Actions4Delete.
c. When prompted, click OK to remove the experiment(s) from your project.
Note: Click the appropriate analysis module on the left side of the screen to return to
the analysis.
Share experiments, folders, and projects
The Applied Biosystems™ Analysis Software allows you to share any data
(experiments, folders, and projects) with other users that have access to the software.
Sharing data with other users grants them dierent access to the data depending on
the type of object shared:
•Projects – Sharing a project with other users grants them read/write access to the
unlocked project.
IMPORTANT! A project is locked (preventing access) when it is open (in use) by
any user with shared access to the project. For example, User A shares a project
with two colleagues (User B and User C), User B opens the project and begins
data analysis (the project is locked and unavailable to Users A and C) until User B
closes the project at which time it is available again to all three users.
•Experiments – Sharing experiment les with other users grants them full access
to the data, allowing them to import the data to their own projects or download
the experiment data le.
•Folders – Sharing a folder with another user grants access to the contents of the
folder (projects, experiments, and subfolders).
To share projects, experiments, and subfolders with another user:
•Share an experiment, folder, or project:
a. Click (Home), then click All Files to view your data.
b. From the Home Folder screen, select the check box to the left of the object
(project, experiment, or folder) that you want to share, then click (display
details).
Chapter 2 Manage experiment data
Share experiments, folders, and projects
2
14
Applied Biosystems™ High Resolution Melt Curve Analysis Module

c. Enter the email address of the user with whom you want to share the
selected object, then click .
The user is notied via email that you have shared with them and the shared item
will appear in their Home Folder.
IMPORTANT! To share multiple les:
1. Select the desired objects (projects, experiments, and subfolders) from the
Home Folder screen, then click Actions4Share.
2. In the Share Files dialog box, enter the email address of the user with whom
you want to share the selected objects, then click Share.
•Un-share a le, folder, or project:
a. Click (Home), then click All Files to view your data.
b. Select the shared object, then click the display details icon.
c. In the details pane, select the Shared With tab, then click un-share adjacent
to the email address of the user from which you want to remove sharing
privileges.
The selected users are notied via email that you are no longer sharing the
specied le with them and the shared le(s) will no longer appear in their
Home Folder.
Chapter 2 Manage experiment data
Share experiments, folders, and projects
2
Applied Biosystems™ High Resolution Melt Curve Analysis Module
15

About experiment data/files
The Applied Biosystems™ Analysis Software can import and analyze experiment les
(.eds and .sds) that are generated by a variety of Thermo Fisher Scientic real-time
qPCR instruments. Every consumable run on a Thermo Fisher Scientic real-time
qPCR instrument requires the creation of one or more experiment les that store the
associated data. Each experiment le is a virtual representation of a specic
consumable (plate, array, or chip) that contains data for all aspects of the qPCR
experiment.
Experiment les contain the following information:
• Target information and arrangement on the plate
• Sample information and arrangement on the plate
• Method parameters for the run
File compatibility
The Applied Biosystems™ Software can import data the following experiment le
formats generated by Applied Biosystems™ real-time qPCR instruments:
IMPORTANT! The Applied Biosystems™ Analysis Software can import and analyze
data from unsupported versions of the instrument software; however, we cannot
guarantee the performance of the software or provide technical support for the
analyses.
Real-Time PCR System Supported software
version(s)
File
extension
Applied Biosystems™ 7500 and 7500 Fast Real-
Time PCR System v2.0.5 or later
.eds
Applied Biosystems™ StepOne™ and StepOnePlus™
Real-Time PCR System v2.0.1, v2.1, or later
Applied Biosystems™ ViiA™ 7 Real-Time PCR
System v1.1 or later
Applied Biosystems™ QuantStudio™ 12K Flex Real-
Time PCR System v1.1.1 or later
Applied Biosystems™ QuantStudio™ 3 Real-Time
PCR System
v1.0 or later
Applied Biosystems™ QuantStudio™ 5 Real-Time
PCR System
Applied Biosystems™ QuantStudio™ 6 Flex Real-
Time PCR System
v1.0 or later
Applied Biosystems™ QuantStudio™ 7 Flex Real-
Time PCR System
Chapter 2 Manage experiment data
About experiment data/files
2
16
Applied Biosystems™ High Resolution Melt Curve Analysis Module

Set up the project
■Manage samples and targets ........................................... 17
■Manage HRM controls ................................................ 18
■High-resolution melt (HRM) dyes ...................................... 18
■High-Resolution Melt (HRM) reagents and controls ....................... 19
After importing one or more experiments (.eds or .sds les) into your HRM project,
use the Overview screen to set up the project.
Manage samples and targets
The Applied Biosystems™ Analysis Software populates the Overview screen with the
samples and targets present in the experiments added to the project. If necessary, you
can add, edit, or remove the samples and targets as needed before the analysis.
•Create a new sample or target:
a. From the Samples or Targets table in the Overview screen,
click Actions4Add.
b. In the New Sample/Target dialog box, enter a name for the new sample or
target (up to 256 characters), then edit the properties of the new
sample/target.
c. Click OK.
•Update an existing sample or target by editing the entry directly in the table.
Note: Alternately, select a sample or target from the table, then
select Actions4Update.
•Delete a sample or target:
a. From the Samples or Targets table in the Overview screen, select the sample
or target of interest, then click Actions4Delete.
b. In the conrmation dialog box, click OK to delete the sample or target.
3
Applied Biosystems™ High Resolution Melt Curve Analysis Module
17

Manage HRM controls
The Applied Biosystems™ Analysis Software populates the Overview screen with the
controls present in the experiments added to the project.
If necessary, you can add, edit, or remove controls as needed before the analysis:
•Create a new control:
a. From the Controls table in the Overview screen, click Actions4Add.
b. In the New Control dialog box, enter a name for the new control (up to 256
characters), then edit the properties of the new control.
c. Click OK.
•Update an existing control by editing the entry directly in the table.
Note: Alternately, select a control from the table, then select Actions4Update.
•Delete a control:
a. From the Controls table in the Overview screen, select the control of interest,
then click Actions4Delete.
b. In the conrmation dialog box, click OK to delete the control.
For all types of experiments, the Applied Biosystems™ Analysis Software compares
the melt curves of unknown samples against the melt curves of positive controls to
identify groups of variants.
The type of sample used as the positive controls depends on the type of experiment:
•Mutation scanning experiments – One or more samples with the wild type
sequence are used as the control. For unknowns, the call is either “wild type” (if
it matches the control) or “variant X”.
•Methylation studies – Methylated DNA standards that contain from 0% to 100%
methylated DNA are used as the positive controls. The software identies the
percentage methylation of the variants based on their comparison to the
standards.
•Genotyping experiments – Three samples are used as controls: one homozygous
for Allele 1, one homozygous for Allele 2, and one heterozygous for both alleles
(Allele 1 and Allele 2). The software identies the genotypes of the unknown
variants.
High-resolution melt (HRM) dyes
The melt prole of a PCR product is best obtained with high-resolution melt dyes
(HRM dyes). HRM dyes are double-stranded dsDNA-binding dyes that have high
uorescence when bound to dsDNA and low uorescence in the unbound state. HRM
analysis uses dsDNA-binding dyes that are brighter than those previously used, and
they do not inhibit PCR at high-dye concentrations. With traditional dyes (for
example, SYBR™ Green I dye), only limited concentrations of the dye can be used
before the dye inhibits the PCR.
HRM controls
Chapter 3 Set up the project
Manage HRM controls
3
18
Applied Biosystems™ High Resolution Melt Curve Analysis Module

This geing started guide describes procedures for calibrating your instrument and
performing HRM experiments using the MeltDoctor™ HRM Dye. If you use a dierent
HRM dye, prepare a custom HRM calibration plate and then calibrate your Applied
Biosystems™ qPCR Instrument for that dye. When the instrument is calibrated, follow
the procedures provided, but replace the MeltDoctor™ HRM Dye with your own.
Note: See the High-Resolution Melt Curve Geing Started Guide for your Applied
Biosystems™ qPCR Instrument for instructions on performing a custom HRM dye
calibration.
Note: Optimize your reactions for the HRM dye that you use, because each dye
interacts uniquely with all other reaction components.
High-Resolution Melt (HRM) reagents and controls
The example experiments described in this document include the following Applied
Biosystems™ MeltDoctor™ High-Resolution Melting (HRM) reagents and controls that
can be used in your own experiments. For product details and ordering information,
visit: hp://www.thermosher.com/us/en/home/life-science/pcr/real-time-pcr/
real-time-pcr-reagents/meltdoctor-hrm-reagents.html
•Applied Biosystems™ MeltDoctor™ HRM Master Mix contains all PCR
components (excluding template and primers) and has been formulated for
optimal HRM performance across a wide range of genomic targets. It features a
dNTP blend that includes dUTP, which minimizes carryover contamination by
allowing amplicon degradation by uracil DNA glycosylase (UDG) in subsequent
PCR reactions. The MeltDoctor™ HRM Master Mix does not require additional
mixing prior to use, and was developed and optimized solely for HRM
applications.
•Applied Biosystems™ MeltDoctor™ HRM Positive Control Kit provides nucleic
acid controls that can be used to demonstrate and troubleshoot high resolution
melt (HRM) analysis. The kit contains forward and reverse primers and three
DNA templates representing the homozygous and heterozygous genotypes for a
β-actin target gene (ACTB).
•Applied Biosystems™ MeltDoctor™ HRM Calibration Standard contains a DNA
template and primers which, when mixed with PCR reagents and dye, can be
used to prepare a plate for thermal and optical High Resolution Melt (HRM)
calibration for the MeltDoctor™ HRM (High Resolution Melting) dye.
•Applied Biosystems™ MeltDoctor™ HRM Calibration Plates contain all the
components required for dye and HRM calibration on the Applied Biosystems™
qPCR Instrument. These plates provide the thermal and optical calibration
required for accurate and reproducible discrimination between melt curves.
Custom HRM dyes
Chapter 3 Set up the project
High-Resolution Melt (HRM) reagents and controls
3
Applied Biosystems™ High Resolution Melt Curve Analysis Module
19

Edit experiment properties
■Review and edit the plate setups ....................................... 21
■Apply samples and targets ............................................ 21
■Specify and assign tasks ............................................... 22
■Import an HRM calibration from an external le .......................... 23
■Apply plate setup information using a template le ....................... 23
■Set the PCR stage for an experiment .................................... 24
■Template les ........................................................ 25
After populating your project with samples, targets, and controls, use the Plate Setup
screen to make changes to the plate setups of the experiments added to your project.
The editor can be used to edit sample, target, task, and control assignments to correct
missing or incorrect seings.
4
20
Applied Biosystems™ High Resolution Melt Curve Analysis Module
/