Page is loading ...

What Can You Do with
Reporting Services?
In 2003 and 2004, we wrote the first edition of Professional SQL Server Reporting Services. At that time,
I knew that Reporting Services was going to be a big deal, and I also knew that writing a book on
something as substantial as this product wasn’t going to be a walk in the park— so I wanted to work
with a capable, well-rounded team. Fortunately, I have had the pleasure of working with some very
smart, hard-working individuals who love technology and solving problems. Reporting Services was
a new product two years ago, so we did a lot of research and learned some lessons along the way.
Since then, we’ve learned even more by putting reporting solutions in front of many business users
and consulting customers.
What We’ve Learned
I’m not saying that we know absolutely everything there is about this product — we’re learning
more about it on every project, but we’ve certainly made it our mission to be as well versed as pos-
sible. Please bear with me as I toot my horn about those whom I’ve had the pleasure to work
alongside. For the first edition of this book, we worked primarily with the beta product. We have
had many conversations with members of the Reporting Services product team at Microsoft as we
put the product through its paces to learn what Reporting Services could and couldn’t do. We did
our homework, and we wrote about its wonderful capabilities. But as with most Microsoft prod-
ucts, we found that there are about 18 different ways to perform each task. Since then, we have
deployed Reporting Services in dozens of corporate environments. We’ve talked to business users
to understand their reporting needs and then designed reporting solutions for many types of orga-
nizations. We’ve integrated reports into web sites and portals, intranet sites, and desktop applica-
tions. We’ve trained hundreds of users, developers, and administrators and have presented at
conferences. We’ve designed reports for savings and investment banks, support centers, software
05_584979_ch01_2.qxp 8/14/06 10:13 AM Page 3
COPYRIGHTED MATERIAL

companies, sales and customer management system vendors, sportswear companies, and theme park
and entertainment companies. We’ve learned a lot about how not to design reports and how to build
reporting solutions more efficiently. This book is based on this foundation of experience.
Who Uses Reporting Services?
Probably one of the most significant lessons of the past two years spent teaching training courses on
Reporting Services is how diverse the demographics of the audiences are. I’m not talking about age and
gender but the roles and backgrounds of those who design and implement reporting solutions. As an
application developer, I was accustomed to teaching programmers and other technology professionals
whose life quest is to make the world a better place by writing software. However, I quickly learned that
there wasn’t a stereotypical report designer. Some are very business-focused and aren’t necessarily in
love with technology and program code. Many are simply charged with managing or facilitating a line
of business. They need tools to get information quickly and don’t want to reinvent the wheel or work
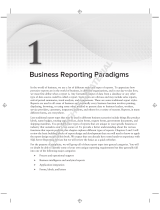
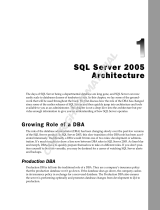
with cumbersome tools. The figures in the following table aren’t substantiated by any kind of survey or
study but are merely my objective observation of those who attend Reporting Services training classes.
Approximate Percentage Role
15% Business Managers
15% System Administrators
30% Software Developers
40% Business Information Workers
Wait a minute! This is a book about creating reports to display information in meaningful and interest-
ing ways. I can’t just display this information in a boring list, so I’ve created a simple report and put it
into a chart (an exploded, semitransparent doughnut chart to be specific) shown in Figure 1-1.
Of those who are working seriously with Reporting Services, have attended classes, or have engaged
consulting services, about one-sixth are nontechnical business managers. Members of this role are
mainly interested in the bigger picture: how reports can address their analytical needs and help them
make informed decisions. These folks have little interest in the implementation details or the technology
used to make it work. They direct people who can do the detail work.
System administrators consist of server system builders, hardware professionals, and database adminis-
trators. In smaller organizations, this role is often shared with the software developer. Administrators
are typically concerned with the setup and ongoing maintenance of servers and the infrastructure to
keep reporting solutions available and working. They typically spend their time and energy managing
security and optimizing the system for efficiency.
The software developer represents slightly less than one-third of the audience. To achieve advanced report-
ing features, software developers will write complex queries and custom programming code to process
business rules and give reports conditional formatting and behavior. Developers typically feel right at
home with the report design environment because it’s very similar to familiar programming tools.
4
Chapter 1
05_584979_ch01_2.qxp 8/14/06 10:13 AM Page 4

Figure 1-1
The largest group of reporting professionals is not the software developers or other technical experts.
They have strong computer user skills, but they don’t spend their time writing code and using tools like
Visual Studio, Enterprise Manager, or SQL Server Management Studio. They are regular business users
who need to design reports to run their businesses. As a software developer, coming to this realization
was a wake-up call. As I taught Reporting Services 2000 classes for Microsoft, I often spent a large por-
tion of the classroom time just teaching students to use the Visual Studio user interface. It was new to
them and unlike any other application they were accustomed to. Report designers who have been using
other tools such as Crystal Reports, for example, will typically be a little intimidated by the Reporting
Services design tools because they may be unfamiliar and may seem to be more “raw” and developer-
centric than what they’re used to using. In order to take advantage of advanced report capabilities, these
individuals must either acquire some simple programming skills or work with software developers to
add custom code and expressions to their reports.
Application and Reporting Technology
The definition of reporting is changing. Like so many components of the computer/information industry,
the lines between one thing and another have become very fuzzy. This applies to so many concepts in our
industry. For example, many traditional desktop applications now run in a web browser. Are these client
or server applications? These days it’s hard to draw a line and categorize a business solution. Not long
ago, if an application opened in a web browser it was considered to be a server-side application— all of
the processing occurred on a web server. Likewise, if an application ran from an icon on your computer, it
was a client-side application, where all of the files and processing occurred on your own computer. Have
you attended an Internet hosted meeting or seminar? If so, you probably navigated to a site in your web
browser, entered a meeting number, and, magically, you were looking at PowerPoint slides and a demon-
stration running on the presenter’s desktop computer. Although you may have started from a web page
5
What Can You Do with Reporting Services?
05_584979_ch01_2.qxp 8/14/06 10:13 AM Page 5

and the conferencing application may have been started from your web browser, it was actually running
in a client-side application, which you allowed to be installed on your computer, using advanced content-
streaming technologies, allowing you to interact with the server-hosted conference.
What does this have to do with reporting? Quite a lot, actually. With Reporting Services, you will have
the ability to integrate reports into applications in such a way that users may not be able to tell the dif-
ference between the two. With a little bit of programming code, reporting features can be extended to
look and act a whole lot like applications. Where do applications stop and reports begin? When do reports
start replacing application functionality? As I said, the lines are becoming blurred. Your task is to decide
which tool best meets a need.
The exciting news is that you now have a tool that can do some incredible things. As my favorite super-
hero’s uncle said, “With great power comes great responsibility.” If you are a simple report designer
with simple needs, the good news for you is that using Reporting Services to design simple reports is . . .
well, simple. If you are a software developer and you intend to use this powerful framework to explore
the vast reaches of this impressive technology, I welcome you to the wonderful world of creative report-
ing. In this chapter, I will introduce the common reporting scenarios, beginning with the most basic and
then moving to the more advanced. In subsequent chapters, you will explore these capabilities in depth
and learn to use them in your own reporting solutions.
Information, Now!
Imagine that you are sitting in a presentation meeting at the corporate office of a key customer. You are a
senior sales representative for a company that sells high-volume data backup systems, and the solution
they decide on will be implemented in several regional data centers around the world. Your team has
been preparing for this meeting for months. Your success depends on your ability to demonstrate your
competence to the customer and a clear understanding of their needs. Your team has done their home-
work, and you know the customer has a history of scanning printed medical records and storing them as
image files. Based on this information, you are certain that a particular product will adequately provide
the file backup facilities for their moderate volume of image files. You have made it a point to familiarize
yourself with the capabilities of the system that appears to be the best fit.
During your customer’s opening presentation, they tell you that they have recently made a huge invest-
ment into full-motion video-imaging equipment. Now they need a backup system that can handle large
file capacities. They are prepared to make an investment that is substantially larger than what you had
anticipated for a capable backup solution. Your company began to offer a large-scale solution just a cou-
ple of weeks ago, but you aren’t very familiar with its capabilities. You’ve spent so much time preparing
to sell the smaller system that you haven’t had time to learn more about this new product. Your associate
is doing introductions, and it will be your turn in about 15 minutes.
Discretely, you open your Pocket PC Phone and access the World Wide Web. You log in to your com-
pany’s secure report server, select the product catalog report, choose the product category, and then drill
down to the new product. The report has a drill-through option that lets you quickly view a detailed speci-
fication report for the new, high-volume backup system. After noting the pertinent specifications, you
save this report to a PDF file and then choose the customer sales inquiry history report. Looking up this
customer, you learn that someone named Julie made an inquiry about two months ago regarding video
media backups from this very company.
6
Chapter 1
05_584979_ch01_2.qxp 8/14/06 10:13 AM Page 6

Looking around the room, you find a name card with her name on it. You explore the details of this call,
and you find that Julie had asked if you offer a solution comparable to a very expensive product from a
competitor. Checking the competition’s web site, you discover that the competing product Julie had men-
tioned uses older technology, has a smaller capacity than the new system, and costs considerably more. You
save a report with all of the pertinent specifications to your memory card, hand the card to the administra-
tive assistant sitting next to you, and ask that he make printed copies of the PDF file it contains.
Your colleague finishes her presentation and then introduces you. Taking another quick glance at the
new product specs, you begin your introduction (see Figure 1-2).
Figure 1-2
You explain that one of your team’s greatest strengths is your real experience and understanding of how
business can change from day to day. In order to be responsive and competitive, it’s necessary to adapt to
these changes. You show the brochure for the midscale product and explain that this product would be an
excellent solution for a company that just scans documents. But for digital video, a more capable solution
is required. You share the product specification and qualify the product to meet your customer’s needs.
During your presentation, the administrative assistant returns with the printed specification report. Not
missing a beat, you distribute copies to everyone and conclude your presentation. You make brief eye
contact with your colleague, who raises an eyebrow just before your customer’s chief decision maker,
Julie, aggressively shakes your hand and thanks you profusely for your time and extra effort.
Solution Types
Reporting solutions come in a variety of sizes and shapes. These range from the standard Report
Manager web interface to a completely customized application with integrated reporting features. The
types of software solutions that might incorporate reporting include:
ACME
DATA
STORAGE
7
What Can You Do with Reporting Services?
05_584979_ch01_2.qxp 8/14/06 10:13 AM Page 7

❑ Out-of-the-box, server-based reporting features, using reports created by report designers and
deployed to a central web server.
❑ Client-side ad hoc reports created by users, on demand with the Report Builder tool using pre-
defined data models.
❑ Reports integrated into web applications using URL links to open in a web browser window.
❑ Reports integrated into SharePoint Portal server applications using SharePoint Web Parts.
❑ Custom-built application features that render reports using programming code. Reports may be
displayed within a desktop or web application interface or saved to a file.
Out-of-the-Box Reports
What does Reporting Services provide if you just want to use its simplest features right out of the box?
Quite a lot, actually. Reporting Services uses the Microsoft Development Environment to design and
deploy reports to a central web server. Prior to the release of SQL Server 2005, the development environ-
ment was exclusively part of Microsoft Visual Studio, a tool for serious application developers to create
custom software. It still is, but now the development environment has been tailored to manage SQL
Server databases, write queries, and design reports. Using this powerful tool is likely the most signifi-
cant challenge for the new report designer.
Once you learn the basics of the development environment, designing reports and managing projects
is actually quite easy. The report designer includes a simple Report Wizard that can lead you through
designing common reports. Tabular, grouped, cross-tab, and chart reports are relatively easy to build just
by following the wizard prompts and perhaps setting a few properties.
After a new report has been designed and tested, it can be deployed to a central report server where it
will be available to all users through a simple web browser application called the Report Manager.
Beyond wizard-built reports, many aspects of more complex reports may be managed by creating simple
programming expressions. An expression builder guides the designer through the simple use of func-
tions and logical expressions that may be used to modify colors, visibility, and formatting aspects and to
perform calculations. Because the expressions in Reporting Services are based on Visual Basic .NET, the
power of conditional expressions is virtually limitless.
Server-Based Reports
It’s important to understand the difference between SQL Server Reporting Services and a desktop
reporting tool like Microsoft Access. Reporting Services isn’t an application that you would typically
install on any desktop computer. It requires Microsoft SQL Server, a serious business-class relational
database management tool. For this and other reasons, Reporting Services is designed to run on a file
server instead of a desktop computer. It also requires Microsoft Internet Information Services, a compo-
nent of Microsoft Windows Server products.
Reporting Services is designed for business use. Therefore, it is a powerful tool that can literally scale to
be used by thousands of users and can report on very large sets of data stored in a variety of database
8
Chapter 1
05_584979_ch01_2.qxp 8/14/06 10:13 AM Page 8

platforms. But just because Reporting Services is a business-sized product, this doesn’t mean that reports
have to be complicated or difficult to design.
Report users need to be connected to a network, or perhaps the Internet, with connectivity to the report
server. When a report is selected for viewing from a folder in the Report Manager, it is displayed as a
web page in the user’s web browser. Optionally, the same report can be displayed in a number of differ-
ent formats including Adobe PDF or Excel, or as a TIFF image. Reports may be saved to files in these
and other formats for offline viewing. Reports may also be scheduled for automatic delivery by the
report server by e-mail or may be saved to files. These features are standard and require only simple
configuration settings and minor user interaction.
User-Designed Reports
Reporting Services in SQL Server 2005 introduces an alternative to predesigned, server-side reports.
Standard reports are designed for users by a report designer or developer ahead of time and deployed to
the server for users to select and display, print. or save to a file. This may be useful for standard reporting
needs shared by most report users. However, savvy users cannot modify the design or these standard
reports without access to the design and development tools. The Report Builder allows users to build their
own reports on the fly, using prepared queries and data models. Using this option, the report designer or
system administrator can prepare a variety of common data models to simplify and expose the underlying
data sources in a concise form. This allows users to construct ad hoc reports using simple drag-and-drop
techniques. These reports may be saved for others to use or to be built upon in later sessions.
The actual design work is performed using a client-side builder tool delivered on demand in the user’s
web browser. The user experience is quite simple. As far as the user is concerned, a new report is created
using a simple web page selection and the Report Builder opens in a browser window without specifi-
cally installing a software package ahead of time. These reports are stored on the server in the same
folder space as other reports. The Report Manager web interface is used to access and maintain standard
Reporting Services reports as well as Report Builder reports and their associated data models.
The advantages of Report Builder reports are that they give users the ability to design and customize
their own reports without involving a report designer or developer. Report styles and features include
standard report layouts like columnar, hierarchal, pivot/matrix, and charts.
Report Builder reports cannot contain custom expressions or custom code. Data-formatting options are lim-
ited and the data models must be prepared ahead of time. Models may be created to mirror the details of
source data tables or may be simplified. This allows the data model designer to hide sensitive data and to
simplify complex data sources with alias columns aggregations and calculated data members.
Designing Reports
The report designer is integrated into the Microsoft Development Environment, which also is the plat-
form used for the SQL Server 2005 design and administration tools. In Reporting Services for SQL Server
2000, report design was performed exclusively using Visual Studio. Now reports may be designed and
created using either Visual Studio 2005 or the Business Intelligent Studio, both of which are implementa-
tions of the development environment.
9
What Can You Do with Reporting Services?
05_584979_ch01_2.qxp 8/14/06 10:13 AM Page 9

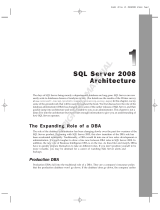
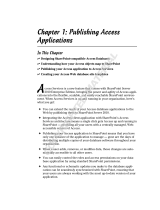
Building standard, server-side reports in the designer can be as simple as 1, 2, 3: First, you create a data
connection to the data source and dataset (query) for the report. The second step is to design the report
layout using simple drag-and-drop tools. Formatting attributes are set by changing properties in the
properties sheet or dialogs. The report may be previewed and debugged within the designer. The third
and final step is to deploy the report to the report server. This may be done using a right-click menu
action. The report designer, shown in Figure 1-3, supports this three-step paradigm with corresponding
designer windows (located on the tabs) and features.
Figure 1-3
Report design is covered in Part II. You’ll learn about the basics in Chapter 4 and about advanced tech-
niques in Chapter 5. Chapter 6 will take you beyond the features and discuss several common business
scenarios. In that chapter, you will learn techniques for designing the best reporting solutions to meet
some common and unique challenges.
Client-side reports are a little different from Reporting Services’ standard server-side reports. Because
this feature is intended to give users the power to create and modify their own reports, it does not
require Visual Studio or Business Intelligence Studio to be installed on their computers. First, a data
model is prepared to support the reports users may build. These data models are stored on the report
server with shared data sources and reports. The data model serves two important purposes: It provides
a simplified view to hide the complexity of relational or hierarchal data. Second, it allows the data model
designer to control access to sensitive or irrelevant data stored in the database. When a user wants to
10
Chapter 1
05_584979_ch01_2.qxp 8/14/06 10:13 AM Page 10

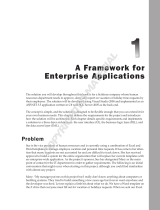
build a report from the Report Manager, the Report Builder design components are downloaded and
activated in the user’s web browser. This design environment shares common features and characteris-
tics with the report designer but is simpler to use and specifically designed for creating these client-side
reports (see Figure 1-4). Report Builder reports are automatically laid-out and formatted for ease of use.
Finished reports may be stored on the server for reuse.
Figure 1-4
Part III, including Chapters 8 and 9, thoroughly covers client-side reporting concepts, data model prepa-
ration, and the Report Builder design environment.
Simple Application Integration
There are a few options available for integrating reports into business solutions. Using reports from an
external application isn’t hard to do, but choosing the right technique depends upon the type of applica-
tion and the desired behavior of the report interface. Even with all of these options, you may still have a
few different implementation choices. There are two recommended methods for rendering reports in a
custom implementation which include:
11
What Can You Do with Reporting Services?
05_584979_ch01_2.qxp 8/14/06 10:13 AM Page 11

❑ A standard web request using a Uniform Resource Locator (URL).
❑ A report embedded into a Windows or web application using an IFrame, Browser control, or
ReportViewer control.
❑ A programmatic web request using the Simple Object Application Protocol (SOAP).
The first option is much easier but may be used in a variety of different ways. In its simplest form, a
hyperlink is used to open the report in the web browser. The user uses a standard toolbar to provide
parameters for filtering and other report options.
Launching Reports from an Application
Hyperlinks and application shortcuts can easily be added to documents and custom applications. Using
this simple technique, report links can be added to Windows forms, documents, and web pages.
Much of the standard report viewing environment may be controlled using parameters passed to the
report server in the URL. By incorporating these commands into a hyperlink, reports may be displayed
with or without toolbar options and features. You can change the zoom factor and modify the rendering
format. For example, clicking a link for one report may open it as a web page in HTML, and another link
for a different report may open it in Excel or the Adobe Reader.
Reports may be designed to prompt users for parameter values used to filter data and to modify the
report format and output. These parameters may also be incorporated into a URL string. This way one
hyperlink will display a report with one set of data, and another hyperlink will display the same report
with different data. Parameters can even be used to change display attributes such as font sizes and col-
ors, and to hide and show content.
User Interaction and Dynamic Reporting
There are many opportunities to use report features to provide a rich user experience. In the past, many
reports were nothing more than a list of values with totals. Now reports can be a starting point that can
guide users to the information they need to make decisions. Report elements, such as text labels, column
headers, and chart points can be used to navigate to different report sections and to new reports. Since
navigation links may be data-driven and dynamically created based on program logic, report links (see
Figure 1-5) may also be used to navigate into business applications. Imagine using your reports to
launch programs and to navigate to document libraries and online content!
Dynamic reporting means that the content and layout of a report can change as the user selects parame-
ter values or clicks on different items. Summary headers, shown in Figure 1-6, may be used to expand
and collapse detail sections, giving users the ability to drill down to more specific information.
12
Chapter 1
05_584979_ch01_2.qxp 8/14/06 10:13 AM Page 12

Figure 1-5
Figure 1-6
13
What Can You Do with Reporting Services?
05_584979_ch01_2.qxp 8/14/06 10:13 AM Page 13

Intranet and Internet Report Access
One of the marvelous things about the SQL Server Reporting Services architecture is that it is based on
modern Internet technologies, namely XML Web services and the .NET Framework. The Report Server,
running under Windows Server Internet Information Services, is essentially a complete web portal. At its
core the Reporting Services exposes all of its features and capabilities as a Web service. This means that
there are virtually no practical limits to how the features of reports and the report server may be
expanded to meet specific needs.
At the simplest level, this simply means that reports may be accessed by privileged users who are con-
nected through a corporate Internet (network) or through the World Wide Web. Reports may be made
available through the out-of-the-box Report Manager web page interface or may be built into custom
applications, as you will see in subsequent chapters.
Seamless Application Integration
How and why you would build reporting into a custom business application is a big question. Although
there are some common (and rather simple) techniques, there isn’t just one way to incorporate reports
into a business environment. Whether you want your users to simply link to a report in a standard
browser-based report viewer or to have report content seamlessly melded into a custom application
user interface, there are a handful of methods to get there. Whatever the chosen technique, users need
not even realize that they are using Reporting Services to view their content. In fact, they may not even
realize that they are viewing a report. From the users’ perspective, their experience is simply a conve-
nient and smooth flow of information as they navigate from one simple interface to another, without
ever leaving your business solution.
Part V will help you explore opportunities for integrating Reporting Services reports into applications
and business solutions. Chapter 12 will show you different techniques for including reporting features
into Windows and web applications. You will learn how to program the Reporting Services Web service
to gain control over the report rendering process and to manage reports through custom applications.
Web Application Integration
It’s impossible to know for sure but by some estimates, as many as 60 to 80 percent of all desktop busi-
ness applications have been replaced by browser-based applications, most in the past five years. The
power of the web and Internet technologies has drastically changed the way we use our computers. For
this reason, web applications have come a long way in just the past few years. Once stodgy, static web
pages, many “web sites” have been replaced with interactive information portals and dynamic applica-
tion interfaces that provide feedback and tactile response to user interaction.
The page paradigm has turned once standard gray window dialogs into artistic-yet-efficient, fashionably
color-coordinated, data input and management screens. One of the reasons that Reporting Services inte-
grates so easily with modern web applications is that it natively supports HyperText Markup Language
(HTML), the standard markup language used to create web pages. Techniques may be used to incorpo-
rate reports into a web application in a variety of ways:
14
Chapter 1
05_584979_ch01_2.qxp 8/14/06 10:13 AM Page 14

❑ Hyperlinks to navigate the web browser window to a report.
❑ Hyperlinks to open reports in a separate web browser window, with control over report display
and browser features.
❑ Embedding reports into a page using a frame, IFrame, or ReportViewer web control.
❑ Programmatically feeding report content to an Active Server Page (ASP or ASPX) using server-
side custom code.
❑ Programmatically writing reports to files available for downloading from a web site.
❑ Using a web part to embed reports into a SharePoint Web Portal.
The fact is that there are a lot of creative ways to integrate reports into a web application. These tech-
niques range from very simple, requiring little more than a little HTML script, to very complex, custom
methods. And if it’s not enough to be able to embed reports into custom web pages, it’s also possible to
use custom program code to embed additional content into reports. Imagine the possibilities . . . actually,
you don’t have to imagine anything. Just keep reading!
Portal Integration
As web technologies and products have matured, a new breed of web applications has evolved. Most
web sites consist of several HTML page files, which contain mainly text content. Portal frameworks, like
Microsoft SharePoint Portal Server, Plumtree, E-Portal, K-Station, and DotNetNuke have replaced many
large, complex web sites. A portal server takes much of the programming out of web site construction by
providing a framework and the building blocks to assemble an intricate web site from modules. Most of
the content is managed in a database rather than in physical pages.
A Reporting Services report can integrate with portal sites in some of the same ways that it integrates
standard web pages: by using IFrames and hyperlinks. SharePoint integration is particularly easy for
nondevelopers because it involves the use of simple menu options rather than writing script or program
code. Adding the report viewer web part to a portal site page is as easy as dragging and dropping it into
a page zone and then setting some simple properties. Microsoft offers a simple portal framework with
limited features with Windows Server, called Windows SharePoint Services (WSS.) The full-featured,
corporate-scale edition, SharePoint Portal Server, is a separate product that adds features and advanced
scalability to the WSS foundation.
Windows Application Integration
Reports may be viewed in custom Windows desktop applications using one of two techniques. The
ReportViewer control or embedded web browser may be used to view server-based reports in a form.
These reports are still managed on the Report Server and maintain all of the security settings and config-
uration options defined by an administrator. Queries and data access are still performed on the server.
The other option is to embed these reports directly into the client-side application. The Windows forms
ReportViewer controls can act as a lightweight report-rendering engine. This means that reports built
into a custom application can run independently from the report server. Figure 1-7 show a report ren-
dered on a Windows form using the ReportViewer control.
15
What Can You Do with Reporting Services?
05_584979_ch01_2.qxp 8/14/06 10:13 AM Page 15

Figure 1-7
Managing and Customizing
the Report Server
Reports may be delivered in a variety of ways (not just when a user navigates to a report in real time).
Reports may be automatically rendered to server cache, so they open very quickly and don’t burden
data sources. They may be delivered via e-mail and to file shares on a regular schedule. Using data-
driven subscriptions, reports may be “broadcast” to a large audience during off-hours. Each user may
receive a copy of the report rendered in a different format or with data filtered differently. You will learn
to plan for, manage, and configure these features.
Chapter 11 (in Part IV) will guide you through report server administration. You will learn how to opti-
mize, back up, and recover the ReportServer database, Web service, and Windows service. You will learn
to use the management utilities, configuration files, and logs to customize the server environment and to
prevent and diagnose problems.
16
Chapter 1
05_584979_ch01_2.qxp 8/14/06 10:13 AM Page 16

Chapter 13 covers programmatic extensions to the Report Server. You will learn to write custom data
source, rendering, delivery, and security extensions. That chapter will show you how to build new fea-
tures on top of the Reporting Services architecture. As a report designer or business manager, you will
learn of these powerful capabilities, enabling you to address specialized requirements and to direct
application developers to develop custom extensions. As a system administrator, you will learn to
enable custom extensions and define appropriate security allowances to enable custom extensions to
run on your report server. As a custom extension developer, you will learn how to use the Reporting
Services object model to extend the features of reports and your server, to solve business problems and
enable advanced capabilities.
Summary
Different people will use Reporting Services in different ways. Our goal is to address the needs of the broad
community of power users, report designers, solution architects, system administrators, and business man-
agers. For some, the material contained in sections of this book will help them build and deploy reporting
solutions to meet their needs. For others, it may open their eyes to powerful capabilities beyond their skill-
set and to work alongside other professionals as educated members of a project team.
As a nonprogrammer report designer using Reporting Services, you are likely to learn to write some cus-
tom expressions and program functions to meet specific reporting needs. Perhaps this is as far as you
will need to take Reporting Services. For the vast majority, this is enough to design, build, and deploy
reports with capabilities far greater than any other reporting tools you may have used in the past. If you
are a serious programmer, then your needs are probably a little different from those of the casual report
designer. For the custom business solution developer, there are very few boundaries set by limitations of
this product. With some creativity and the techniques you will learn in the chapters ahead, you will take
reporting further than you have before and provide your users with real business intelligence rather
than just the ability to print out data.
Reporting Services takes data accessibility to the next level. Microsoft is making good on its promise of
making information available “any time, any place, and on any device.” Reports may be designed using
specific rendering formats and page sizes to support mobile devices, the browser window, Office docu-
ments, and — oh yes — the printed page.
17
What Can You Do with Reporting Services?
05_584979_ch01_2.qxp 8/14/06 10:13 AM Page 17

05_584979_ch01_2.qxp 8/14/06 10:13 AM Page 18
/