Page is loading ...

QuestSuite Professional II (QSP-II)
Quick tour of QSP-II and the Edge Studies
Contents
Welcome to QuestSuite Professional II.......................................................................................................... 2
A brief introduction ................................................................................................................................................2
Functionality....................................................................................................................................................2
License............................................................................................................................................................2
Understanding Start-up screen....................................................................................................................... 3
My Instruments .....................................................................................................................................................3
My Data ................................................................................................................................................................3
Setting up your meter..................................................................................................................................... 4
SoundPro set-up parameters ..................................................................................................................................4
Retrieving your data....................................................................................................................................... 8
Downloaded data............................................................................................................................................ 9
Organizing your folders (nodes)................................................................................................................... 10
Creating and moving a new folder structure (node) ...............................................................................................11
Renaming Nodes, Sessions, and/or Studies............................................................................................................11
Viewing your studies in panels (charts and tables)...................................................................................... 12
Adding panels (charts/graphs)..............................................................................................................................13
Saving your customized layout (charts/graphs)......................................................................................................13
Creating reports...................................................................................................................................................14
Sharing reports....................................................................................................................................................15
Backing up your noise data/Exporting a Node................................................................................................... 15
Figures
Figure 1-A: QSP-II is designed with a bi-pane view...............................................................................................................................2
Figure 1-B: Explaining start-up screen..................................................................................................................................................
3
Figure 1-C: Edge Set-up (dosimeter) screen .........................................................................................................................................
4
Figure 1-D: Setting up the Edge Display...............................................................................................................................................
5
Figure 1-E: Setting up Auto On feature.................................................................................................................................................
5
Figure 1-F: Setting Secure Run Mode...................................................................................................................................................
5
Figure 1-G: Setting a name to the Edge................................................................................................................................................
6
Figure 1-H: Clearing the Edge..............................................................................................................................................................
6
Figure 1-I: Setting Time and Date........................................................................................................................................................
6
Figure 1-J: QSP-II firmware updates....................................................................................................................................................
7
Figure 1-K: Retrieving your data ..........................................................................................................................................................
8
Figure 1-L: Downloaded node/folder structure......................................................................................................................................
9
Figure 1-M: Unorganized Files/Studies Example ..................................................................................................................................
10
Figure 1-N: Example of organizing your studies ..................................................................................................................................
10
Figure 1-O: Add Organizer Node ........................................................................................................................................................
11
Figure 1-P: Add a Node Name............................................................................................................................................................
11
Figure 1-Q: Rename Session..............................................................................................................................................................
11
Figure 1-R: Example of Graphs and Charts ........................................................................................................................................
12
Figure 1-S: Adding panels..................................................................................................................................................................
13
Figure 1-T: Saving a customized layout (charts/graphs) .....................................................................................................................13
Figure 1-U: Sample SoundPro Report in QSP-II...................................................................................................................................
14
Figure 1-V: Saving reports as .pdf file.................................................................................................................................................
15
Figure 1-W: Exporting data for back-up or sharing of data...................................................................................................................15
Figure 1-X: Importing data once it is exported....................................................................................................................................
15

Welcome to QuestSuite Professional II
Quest Technologies, a 3M company Page 2 7/09
Data Pane:
Tree Nodes
Famil
y
of Devices
Working and
Managing meter’s
functionality
Family of Devices/instruments:
(Acoustics, Vibration, Heat,
etc..)
S
p
ecific instrument
(
i.e., Ed
g
e
)
M
y
Instruments Pane
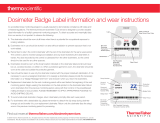
Figure 1-A: QSP-II is designed with a bi-pane view
A brief introduction
QuestSuite Professional II (QSP-II) is a software application from Quest
Technologies that runs under the Windows operating system which includes the
following instruments: Acoustic meters (i.e., SoundPro, NoisePro, Q300, Q400,
Q500), Vibration meters (i.e., HAVPro, VI-400Pro), and Heat Stress (i.e.,
QT34/QT36).
Functionality
You can use QSP-II for a variety of functions including the ability to display and
manipulate data after it is uploaded to the computer. Additionally, QSP-II is
used to download information to the instrument, including configuration files, as
well as updating the instrument’s parameter settings, clock, and storing
calibration and serial number information.
License
QSP-II is available with a single user-license, a 10-use license and an unlimited
license. Please contact Quest at www.questtechnologies.com or your Quest
dealer for ordering information.

Understanding Start-up screen
The user interface in QuestSuite Professional II uses the tree view and file menu concept
used by most file browsers.
The main window is divided into (2) sections (or window “panes”): “My Instruments”
and “My Data”.
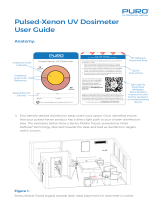
My Instruments
My Instruments enables you to manage multiple instruments in one program
which encompasses the following functions:
Selecting your setup parameters and saving these setups as templates in the
software.
Store calibration certification information
Set Date and Time on the instrument
Retrieve data (or “download” data) from the meter into QSP-II
My Data
In the “My Data” pane (also referred to as “control pane”), you will find your
downloaded studies. This tree view section is also used to manage your studies
by naming them, grouping them, and exporting/importing the studies. When
QuestSuite Professional II is opened, "My Data” pane will always be to the far
left.
My Instruments
Select a meter and
then use it to retrieve
data, setup
parameters, and set
date and time.
My Data
A section of the
screen (called
“pane”) used to
view your
saved studies
Meter Functionality
Retrieve Data, Setup,
Clear Memory, and set
Date-Time, etc.
Select instrument
(
i.e., Ed
g
e
)
Figure 1-B: Explaining “My Instruments”
Quest Technologies, a 3M company Page 3 7/09

Setting up your meter
As you are setting up your instrument, QuestSuite Professional II is designed in easy to use set-
up screens with an index tab structure. All meters can be customized with industry standard
set-up parameters which can then be saved in case you wish to create a couple or several
customized setups (i.e., xxx city ordinance 1, xxx city ordinance 2, etc..) Once the setups are
saved, you can then send (or retrieve) these settings from (to) your pc to (from) the instrument.
Edge set-up parameters
The following example outlines how to manipulate and customize your set-up parameters with
the Edge.
Customizing set-up parameters and saving the configuration (or setup)
1. Dock the dosimeter on the EdgeDock1 (or 5) and turn on the dosimeter by pressing the
On/Off Enter button.
2. Plug the USB cable into the computer (see “A”) and plug the opposite end into the
docking station (see “B and “C”).
C
A
B
3. In QSP-II, select the Edge (from the Acoustics’ family of “My Instruments”), and select
Setup button.
4. You
have the following setup screens to modify:
a. Dosimeter screen
Dosimeter 1 & 2 parameters
refer to F and G
Send setup to instrument
Dosimeter tab
(under Config tab)
Edge Units:
Select All
**Or**
Click on specific
dosimeter(s)
Dosimeter settings
Timed Response (A)
RMS weighting (B)
Peak wei
g
htin
g
(
C
)
E
D
B C
A
Save As
LED indicator settings
Alarm enable (D)
Heartbeat enable (E)
Figure 1-C: Edge Set-up (dosimeter) screen

b. Display screen
In the display screen of QSP-II, you can customize the Edge display.
For example, if
you only want SPL, Peak, and RT to appear on the dosimeter’s display, you would select
these in the first three fields and then select “OFF” for all other fields.
Quest Technologies, a 3M company Page 5 7/09
Figure 1-D: Setting up the Edge Display
Edge Units
Click select All
Or chose a
specific Edge (s)
Display Tab – click
Configuration and
then select Display
Item to display
click on a field you
wish to change
Set selected item
then chose an item
from “set selected
item”
c. Auto-On screen
If setting the “Auto on” feature in QSP-II, you can pre-program one study based on
each study’s length (or duration), start date, and start time. (Note: in the next
software release, you will have an option of two Auto On settings called Auto On 1 and
Auto On 2.)
Figure 1-E: Setting up Auto On feature
Date
Click to enable
Auto On mode
Auto On settings
Select appropriate
duration, time, and
date
Send setup to instrument
d. Security screen
You can prevent people from inadvertently terminating a study or changing settings with
the lock feature enabled. Initially, this feature is set through QSP-II and is then
activated after the dosimeter is running. There are three lock or secure run settings:
unlocked, locked (allow measurement view ) , and locked (no measurement
view) .
Security
Setting lock mode
Click on one of
the lock modes.
Select All
-
Or select specific
dosimeter
Figure 1-F: Setting Secure Run Mode

e. Identity screen
With the identity setting on the Edge, you have the option of adding a name to the
dosimeter. This is a very useful feature if, for example, you have a handful of
dosimeters or a couple hundred dosimeters and you want to track who is assigned to
each specific dosimeter.
Quest Technologies, a 3M company Page 6 7/09
Identity string:
type in a name
and/or numbers
Set Identity
Status field
Figure 1-G: Setting a name to the Edge
f. Clear screen
To clear your data, also referred to as resetting your data, ensure your Edge is docked
and you are viewing the setup screen in QSP-II.
Clear tab
Edge selected
Clear memory
Figure 1-H: Clearing the Edge
g. Set Time Screen
As you begin using the Edge, you will want to set the date and time which is
performed via QSP-II setup.
Set Time Tab
Edge selected
Figure 1-I: Setting Time and Date
Current time
Specific time –
enter in a
date/time
Set Date/Time

h. Update Screen
Latest firmware (i.e., software) releases are available in the Setup screens via the
“Update” screen. When updating, only one dosimeter can be updated at a time and
must be updated in bay 1 of an EdgeDock5.
Update
Select
Firmware
location
Edge selected
Update
Figure 1-J: QSP-II firmware updates
5. To save your customized settings (to use in the future), click the Save As button in the
“Saved Setups” section and type a name (i.e., OSHA standards) (refer to Figure 1-C).
Or to Save over an existing settings, click on a name in the Saved Setups section and
then click Save.
6. To Send settings at any time, make sure the Edge is docked and connected to your pc via
the USB cable. On any of the setup screens under the “configuration” tier, click on the
“Send setup to instruments” button.
Quest Technologies, a 3M company Page 7 7/09

Retrieving your data
Whether you’re working with a meter from the family of acoustics, vibration, and/or heat stress, the
“Retrieve Data” function performs a similar process of pulling (or “retrieving”) your logged data from the
instrument to the software. (
NOTE
:
please reference your user manual for specific communication
details
.)
Example of retrieving data from the SoundPro meter.
(1) Ensure your Edge
is powered on and connected with a USB cable from the docking station to your pc (see “1” below).
(2) From “My Instruments” in QSP-II, select Acoustics, select Edge, and click on Retrieve Data
button (see “2” below). (3) In the Retrieve Data screen, either click on Select All or click in specific
dosimeter’s checkbox. (see 3 below). (4) Click on the Download button. (see 3 below). When
completed, it will state that the download was successful. (A prompt will appear asking you to clear the
data, click Yes or No.
Note:
Quest recommends clearing the data after it is stored in QSP-II or if you
wish to delete the data.)
Figure 1-K: Retrieving your data
1
2
3
Edge
Turn On
Acoustics
Dock the Edge
and connect with
USB cable
Edge Retrieve Data screen
Select All
Or
Click in specific
dosimeter’s checkbox
Download
Retrieve Data
T
he Ed
g
e

Downloaded data
Where your studies are stored
Downloaded node
When you retrieve data from the Edge into QSP-II, these studies are automatically stored in the
downloaded” node and a generic name is assigned to the session. If you pressed run stop a
couple of times these will appear as “studies” under the downloaded session. The summation of
the studies will store as a session in a hierarchy structure.
✍ Analogy:
The concept of storing files is similar to how your inbox works in Microsoft Outlook.
In Outlook, the files are automatically sent to a general inbox and it is up to you to organize your
mail into subfolders. Likewise, with QSP-II, once the files are collected, they are stored in a
general inbox called “Downloaded” node. With a simple right-click, you can quickly rename the
file and create a user-friendly filing system to manage your studies. The next step for organizing
your files would be to drag and drop the sessions into a newly created organizer.
Quest Technologies, a 3M company Page 9 7/09
Downloaded node
Click on Downloaded and
then click the “+” to expand
the tree view.
It will reveal the Session,
Meter configuration (same
as your set-up parameters),
and Study data
Downloaded files appear in the
bi-pane view when you select
Downloaded. In this view, you
can manage your files by
renaming, moving, and or
selecting multiple files at one
time.
Session
Click on a session and
expand (“+”) to view
Session details
appear in the
layout view as
panels in bi-pane
view. The panels
(or charts and
graphs) are
customizable
using the toolbars
in QSP-II
study
data.
Figure 1-L: Downloaded node/folder structure

Organizing your folders (nodes)
As explained previously, imported instrument data is automatically stored in a folder system called
“Downloaded” (node). Leaving all your data in one huge list under the downloaded node is
confusing and can be inefficient since generic names are assigned to sessions and studies. In
order to categorize your data, use the “Add Organizer Node” menu option and assign descriptive
names. A quick drag and drop of the data will enable you to organize and manage your data.
Un-organized Session
Example 1:
Displays a generic name assignment for the Edge data that is currently stored under
“Downloaded” node as “Laura’(EHG120008)” which contains 3 studies.
Note: The Edge will save the
data in a session using the name assigned to the dosimeter (which is set in the “Identity” screen of QSP-
II.)
Downloaded Node
Unorganized
Figure 1-M: Unorganized Session
Renamed:
Right-clicked and selected Rename study.
Typed in a new name and clicked Ok.
Created New Node
Clicked, dragged and dropped session
from “Downloaded” to “Edge Data” node.
3. Lastly, the session and studies were renamed by right-clicking on the session and study and typing in a
new name.
Organized into a node with renamed studies
Example 2: Displays an organized node. This was accomplished by:
1. A new node title was assigned by right-clicking on My Data and choosing Add Organizer Node.
2. Next, the session was moved by clicking, dragging and dropping the session icon directly over the
newly named node icon (called “Edge”).
Figure 1-N: Example of organizing your studies

Creating and moving a new folder structure (node)
The following steps outline how to create a node and how to move a node around in
the tree view structure.
1. Right-click on “My data” . (This will create a node directly under the root of
“My Data”.)
✍
NOTE: If you want it placed under an existing node (similar to a sub-folder
node), click on an existing node.
2. Select Add Organizer Node from right-clicking My Data menu. An Add
Organizer Node dialog appears.
Right click “My Data” and select “Add
Organizer Node”
Figure 1-O: Add Organizer Node
3. Type a name for the node.
T
ype in a name and click Ok
Figure 1-P: Add a Node Name
4. Click OK. The new node will dock underneath the existing nodes if you selected
“My Data”.
5. To move the node, click, drag, and drop it directly on My Data or another
node.
✍
NOTE: If it is disallowed, the following icon will appear: . When you drop
it directly on another node, the node icon will appear indicating an
“allowable” place.
Renaming Nodes, Sessions, and/or Studies
1. Right-click on the node, session, or study you wish to rename and select
Rename.
Rename Session
Figure 1-Q: Rename Session
2. Type in a specific name and click Ok. The new name will appear.

Viewing your studies in panels (charts and tables)
You can add, edit, print, and export data in QSP-II. The following diagram illustrates
the main features and menu bars in QSP-II.
Panel (or chart/graph) icons
Used to expand, collapse, and
customize values.
Layout icon toolbar
Used to customize your panels.
B
A
Layout
Panel
Also referred to as
“Charts and Graphs”
C
D
Figure 1-R: Example of Graphs and Charts
Graphs & Charts
layout view
Explanation
A. Layout QSP-II is divided into two panes (or sections). One is the layout view and the second
pane is the “control pane”. The layout is divided into “panels” which contain charts and
graphs, calibration history, etc. You can add charts and/or graphs (by adding panels),
move them in the appropriate position, and/or customize the data values.
B. Panel For the Edge, the standard layout (or default template) has three panels. The panels can
be moved, edited, and expanded or collapsed. (see “Chart and Graph icons)
C. Chart & Graph
icons
Used to enlarge or hide a panel (also called chart or graph), edit the data, or close the
view.
Expand or Collapse the panel (graph/chart)
Edit (edit the parameters of the selected screen)
Delete (closes the window)
D. Layout icon
toolbar
This toolbar is used to add tables and/or charts, arrange tables or charts, manage the
layout view, lock it, print reports and access to the help files.
Quest Technologies, a 3M company Page 12 7/09

Adding panels (charts/graphs)
Add
Mana
g
e
1. Ensure you selected the appropriate study and are
viewing panels (graphs/charts) on the right-hand side
of your screen. (See Figure 1-K, page 8 for details.)
2. Click on the Add icon .
3. Select a ch
art or graph. An edit screen may appear.
Select the appropriate settings and click Ok. It will
display on your screen.
Figure 1-S: Adding panels
Saving your customized layout (charts/graphs)
You may have spent some time organizing your data by adding new charts and/or graphs,
rearranging the panes (left-click on a graph/chart heading and drag and drop to a specific
spot), and/or editing the logged data values. With the save template button, you can save
your customized layout so every time you open a study the appropriate charts and graphs are
displayed.
How to save and apply a layout
1. Ensure you selected the appropriate study and are viewing panels (graphs/charts) on
the right-hand side of your screen. (See Figure 1-K, page 8, for details.)
2. Click on the Manage Templates icon (see layout icon toolbar in Figure 1-R.)
a. The Manage Session Templates screen will appear.
3. To create a new template, type a name in the Template Name field.
4. Click the Save Template button.
5. Select the appropriate template name in the “available templates field” and click the
Set Default Template button
✍
NOTE:
If you want to share the template with other users (i.e., create a
corporate template and share the template with your co-workers), use the
export/import buttons.
a. Save Template
T
emplate Name field
c. Set Default Template
b. Apply Template
e. Export
d. Import
Figure 1-T: Saving a customized layout (charts/graphs)

Creating Reports
QSP-II reports are saved in Adobe® PDF format for easy viewing and printing.
✍
NOTE:
The report will print in the order that the panels (charts/graphs) appear on your
computer screen. To rearrange, click on the title of a chart or table, drag, and drop a
chart/table on the title bar of a panel.
: If your cursor displays this icon,, it indicates the panel cannot be dropped into
the current position of your cursor.
: If your cursor displays this icon,, it indicates the panel can be inserted into the
current position of your cursor.
Generating a Session or Study Report
1. Left click on desired session (it will expand the session and the views will appear in the
window).
2. Right-click a Session or Study Node and select Print Session from the menu.
The report will dock under the session or study (depending on if you chose session or
study).
To remove, right-click the report and click Delete Report.
To save the report in an alternative folder/directory (i.e., on your desktop and then you
can email it and share the information.), select Save As and add it to a directory or
folder on your pc (or network).
3. Alternatively, select the Printer Icon when the Session or Study data is displayed in
the chart and tables panels.
When the Generate Reports Icon is selected, the following screen will appear.
Quest Technologies, a 3M company Page 14 7/09
Figure 1-U: Sample SoundPro Report in QSP-II

Sharing reports
Once reports are created, you have the option of saving the data as an Acrobat Adobe file
incase you want to back up the data and/or share the information with others via email. The
following steps outline this process.
1. Right-click on the study report and select Save As.
2. Type in a file name, select the appropriate folder/file directory, and click Save.
a. If emailing, you will want to locate the file and attach it in a new memo.
Quest Technologies, a 3M company Page 15 7/09
Figure 1-V: Saving reports as .pdf file
Backing up your noise data/Exporting a Node
QSP-II enables you to back-up your noise data; and at the same time, you can share this
information with someone who also has QSP-II software through your network or email system.
1. Right-click on the node you wish to share (left-hand side of screen.)
2. Click Export. Type in a name and place it in an appropriate folder.
If you want to email the noise data, attach this as a file. The person receiving the
file would then follow step 3 below.
This creates a “node” file and will save a .node file.
Figure 1-W: Exporting data for back-up or sharing of data
3. To view this data, right-click on “My Data” and select Import. Select the file from
the location you saved it to. (If it is in an email, first save the node file in one of your
folders and then follow this step).
The noise study will be stored (or filed) under “Downloaded” node.
Export
Impor
t
Study Repor
t
Save As
Figure 1-X: Importing data once it is exported
/