Page is loading ...

SoundPro® SE/DL Series Sound Level Meters
QUICK START
GUIDE

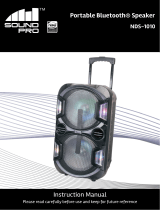
SoundPro® Display and
User Keypad
2
Indicators
+ Battery power:
+ Stop:
+ Run time: 00:00:00
Softkey Menu
Measurement type
+ Repeatedly press 1st softkey
to toggle through to select
1/1, 1/3, SLM (if purchased)
Backlight Key
Stop Key
Left Arrow Key
Up/Down Arrow Keys
Run/Pause Key
Softkeys
AltF Key
Enter Key
Right Arrow Key
On/O and
ESC (Escape) Key

3
Turning On/O and Navigating
1. To turn on the SoundPro, press the key until the start screen appears.
2. To navigate, press the up/down arrows and left/right arrows for most
of the navigational functions.
+ The key is used to move back one level (or escape from a menu/screen).
Press repeatedly to return to the start screen.
+ The key is used to open the selected menu/screen.
Resetting
1. Format the card or delete the session les from the SoundPro (optional).
+ To format, select the File softkey from the start screen. Press the down arrow
continuously to select Format. Press key.
Settings
1. Adjust the settings to t the specications of your sound study.
+ To open the Setup menu from the start screen, press the arrow keys
and press key when selected. The setup menu will appear. To change
the parameters, navigate to the appropriate menus and make changes
as needed. (See the user manual for specic details and term
explanations for more information.)

4
Calibrate the SoundPro (Pre/Post Cals)
1. Ensure the SoundPro is turned On and is either
stopped or paused.
2. Attach the calibrator and cal adapter to the
SoundPro. Set the calibrator to 1 KHz and 114 dB
(if it is a selectable).
3. From the Start screen, press the Cal softkey and
the Cal screen will open. Press when Calibrate is
highlighted. The Pre-Cal screen will open.
4. Allow the measurement to stabilize and press
Arrows to set 114.0 dB level (see A). Then, press
key. When set, the Calibration history screen
appears (see B).
5. Press key to exit the Cal screen.
6. For a Post Calibration, ensure the SoundPro is
in “Pause” mode. (Essentially, run a measurement
and press the run/pause key.) The Pause indicator
will appear at the top of the display.) Then repeat
the Calibration steps above and press Enter to store
the Post Calibration information. A sample screen is
displayed below with post calibration history.
Microphone
Place calibrator
over microphone
QC10/QC20
Select 1kHz
and 114 dB
Cal Softkey
+ Select softkey
to open
A. Calibrate
Press corresponding
softkey to 114.0 dB
level.
B. Pre-Cal
Displays
pre-calibration
information

5
Run/Pause/Stop Measurements
Position the SoundPro in the eld. Press the run key to start measuring. To pause a study (for example:
lunch breaks), press the run/pause key. To start measuring again, press the run/pause key. Continue this
process until your measurements are complete by press the Stop key. This will end the session.
1. From the Start screen, select either View Session or select View Current Study by press the
arrows and key to select.
2. Press key to begin measuring. Press key to Pause (optional). At any time, press
to end the session/study.
Run Time
Measurement
Value (Average SPL)
Lookup Softkey:
Select to change
measurement
parameter
(Lpk, Lmx, Lmn,
Leq, Las)
Run Icon

6
Measurements Displayed
Filtered Bar Chart Screen
For the ltered bar chart screen, the dominant
characteristic of this screen is the multi-element
bar chart. The chart displays measurements in each
lter band and broadband values for both meters. For
octave band analysis, the screen contains 13 bars (11
for lters and 2 for broadband), and for third-octave
analysis the screen contains 35 bars (33 for lters
and 2 for broadband) of measurement values. The
bars appear (and usually uctuate) if the measured
value for the bar is above the minimum value for the
selected measurement range.
Bar Chart Screen
For the bar chart screen, the amplitude of the
displayed measurement is shown both graphically
by the length of the bar and numerically below the
bar. The bar appears (and usually uctuates) if the
measured value is above the minimum value for the
selected measurement range.
Community Noise Screen
This screen shows the results of measurements
commonly associated with community noise studies.
Dosimetry Screen
The Dosimetry screen provides several types
of measurements of the accumulated personal
exposure to noise.
Amplitude
in the Band
Shows SPL
average ampli-
tude (or value) of
Meter 1
+ Will display
only if SLM is
selected as the
measurement
mode.
Shows accumulated
personal exposure
to noise.
+ These measurements
are aected by the
settings in the
“Meter Set” screen
Only appears on Meter 1 when you are not viewing
the current study and when the community noise
parameters are activated.
Exceedance Levels
+ L1 = 99% dB
+ L10 = 85.1% dB
+ L50 = 82.9% dB
Taxtmaximal
+ Value is 90 dB at
3 sec. intervals
Selected
Band
Broadband
Amplitude
Shows SPL average amplitude (or value) of Meter 1
+ Will display only if octave band is enabled

7
Detection Management Software DMS and
Working with SoundPro Data
Viewing data and Data Finder Page
1. Communicating/Connecting the
SoundPro to the PC
A. Turn On the Sound Pro.
B. Plug in USB cable from SoundPro to pc.
2. DMS Welcome Page and
Instrument Communication
A. Click on icon (see A) to access the
Instrument download panel.
3. SoundPro and Downloading
A. Select the SLM family and the SoundPro mode from
the Instrument window (see A). Click on “Go to session
nder after download” box.
B. Click the button (See B).
C. Once downloaded, click the Data Finder tab
(if you did not select “go to session nder
in step A”.) (See C).
4. Selecting and Viewing Data
A. The Data Finder page is used to view, select,
and preview reports. Note: Click Browse to
view all data les.
B. Select the data by clicking on either the session/study
(Note: you may need to expand to see the study data.
C. To view in Graphs and Tables, click on
or buttons.
5. Viewing Data in Graphs, Tables and Report View
The graphs and tables page is noted as the panel
layout view page.
A. The session/study data page displays the data in
logged data charts/tables (see A).
B. Click on to view the panels in a report
format (see B).
A
A
A
C
A
B
B

Quest is a trademark, and SoundPro,
TSI and the TSI logo are registered
trademarks of TSI Incorporated.
TSI Incorporated
- Visit our website www.tsi.com for more information.
North America and Asia Pacic
Telephone: +1 800-680-1220 (USA)
+1 651-490-2860 (Outside USA)
Fax: +1 651-490-3824
E-mail: [email protected]
Europe, Middle East, and Africa
Telephone: +49 241-52303-0
Fax: +49 241 52303-49
E-mail:
P/N 053-776 Rev B ©2018 TSI Incorporated
/