Page is loading ...

Avaya SMON
Manager User
Guide
May 2004

Avaya SMON Manager User Guide
Copyright Avaya Inc. 2004 ALL RIGHTS RESERVED
The products, specifications, and other technical information regarding the products
contained in this document are subject to change without notice. All information in this
document is believed to be accurate and reliable, but is presented without warranty of any
kind, express or implied, and users must take full responsibility for their application of any
products specified in this document. Avaya disclaims responsibility for errors which may
appear in this document, and it reserves the right, in its sole discretion and without notice, to
make substitutions and modifications in the products and practices described in this
document.
Avaya™ and SMON™ are registered trademarks and trademarks of Avaya Inc.
© 2004 Avaya Inc. All rights reserved. All trademarks identified by the ® or TM are registered
trademarks or trademarks, respectively, of Avaya Inc. All other trademarks are the property
of their respective owners.
Release 4.002

Avaya SMON Manager User Guide iii
Table of Contents
Preface . . . . . . . . . . . . . . . . . . . . . . . . . . . . . . . . . . . . . . . . . . . . . . . . . .vi
The Purpose of This Guide . . . . . . . . . . . . . . . . . . . . . . . . . . . . . . . . vi
Who Should Use This Guide . . . . . . . . . . . . . . . . . . . . . . . . . . . . . . . vi
Organization of This Guide . . . . . . . . . . . . . . . . . . . . . . . . . . . . . . . . vi
Chapter 1 — Overview . . . . . . . . . . . . . . . . . . . . . . . . . . . . . . . . . . . . . 1
What is RMON . . . . . . . . . . . . . . . . . . . . . . . . . . . . . . . . . . . . . . . . . .1
What is SMON . . . . . . . . . . . . . . . . . . . . . . . . . . . . . . . . . . . . . . . . . .2
Switch Monitoring . . . . . . . . . . . . . . . . . . . . . . . . . . . . . . . . . . . .3
Enterprise Monitoring . . . . . . . . . . . . . . . . . . . . . . . . . . . . . . . . .3
SMON Management Applications . . . . . . . . . . . . . . . . . . . . . . . .3
Overview of SMON Concepts . . . . . . . . . . . . . . . . . . . . . . . . . . . . . . .4
SMON Devices . . . . . . . . . . . . . . . . . . . . . . . . . . . . . . . . . . . . . . .5
Top-Down Monitoring . . . . . . . . . . . . . . . . . . . . . . . . . . . . . . . . .6
Top-Down Monitoring for the MAC Layer . . . . . . . . . . . . . .6
Top-Down Monitoring for the Upper Layers . . . . . . . . . . . .7
SMON Tools . . . . . . . . . . . . . . . . . . . . . . . . . . . . . . . . . . . . . . . . . . . .9
Avaya SMON Manager Tools . . . . . . . . . . . . . . . . . . . . . . . . . .10
Enterprise Switch Statistics . . . . . . . . . . . . . . . . . . . . . . . . .10
Enterprise Port Statistics . . . . . . . . . . . . . . . . . . . . . . . . . . .11
Enterprise Voice Port Statistics . . . . . . . . . . . . . . . . . . . . . .11
Enterprise History . . . . . . . . . . . . . . . . . . . . . . . . . . . . . . . .11
Enterprise Switch History . . . . . . . . . . . . . . . . . . . . . . . . . .12
Port History . . . . . . . . . . . . . . . . . . . . . . . . . . . . . . . . . . . . .13
Device SMON Tools . . . . . . . . . . . . . . . . . . . . . . . . . . . . . . . . . .14
Chapter 2 — Introduction to Avaya SMON Manager . . . . . . . . . . . . 15
Starting Avaya SMON Manager . . . . . . . . . . . . . . . . . . . . . . . . . . . .15
The Online SMON User Interface . . . . . . . . . . . . . . . . . . . . . . . . . . .15
SMON Tabs . . . . . . . . . . . . . . . . . . . . . . . . . . . . . . . . . . . . . . . .16
Online SMON Toolbar . . . . . . . . . . . . . . . . . . . . . . . . . . . . . . . .16
Dialog Area . . . . . . . . . . . . . . . . . . . . . . . . . . . . . . . . . . . . . . . .17
Desktop . . . . . . . . . . . . . . . . . . . . . . . . . . . . . . . . . . . . . . . . . . .17
Working with SMON Tools . . . . . . . . . . . . . . . . . . . . . . . . . . . . . . .18
Configuring Display Options . . . . . . . . . . . . . . . . . . . . . . . . . . .19
Polling Interval . . . . . . . . . . . . . . . . . . . . . . . . . . . . . . . . . .19
Display Mode . . . . . . . . . . . . . . . . . . . . . . . . . . . . . . . . . . .20
Items Per Screen . . . . . . . . . . . . . . . . . . . . . . . . . . . . . . . . .20
TopN Number of Elements . . . . . . . . . . . . . . . . . . . . . . . . .20

iv Avaya SMON Manager User Guide
Table of Contents
Configuring Report Options . . . . . . . . . . . . . . . . . . . . . . . . . . .21
Using Dialog Box Options . . . . . . . . . . . . . . . . . . . . . . . . . . . . .21
Generating Reports . . . . . . . . . . . . . . . . . . . . . . . . . . . . . . . . . .22
Report Now . . . . . . . . . . . . . . . . . . . . . . . . . . . . . . . . . . . . .23
Auto Report . . . . . . . . . . . . . . . . . . . . . . . . . . . . . . . . . . . .24
Managing Windows . . . . . . . . . . . . . . . . . . . . . . . . . . . . . . . . . .25
Chapter 3 — Switch Statistics. . . . . . . . . . . . . . . . . . . . . . . . . . . . . . . 26
Accessing Switch Statistics . . . . . . . . . . . . . . . . . . . . . . . . . . . . . . . .26
Using Switch Statistics . . . . . . . . . . . . . . . . . . . . . . . . . . . . . . . . . . .27
Understanding the Switch Statistics Window . . . . . . . . . . . . . .27
Selecting Switches to Poll . . . . . . . . . . . . . . . . . . . . . . . . . . . . .29
Filtering the Switch Statistics Display . . . . . . . . . . . . . . . . . . . .31
Switch Statistics Counters . . . . . . . . . . . . . . . . . . . . . . . . . . . . .31
Sorting the Display . . . . . . . . . . . . . . . . . . . . . . . . . . . . . . . . . .32
Searching for Switches . . . . . . . . . . . . . . . . . . . . . . . . . . . . . . .33
Chapter 4 — Port Statistics . . . . . . . . . . . . . . . . . . . . . . . . . . . . . . . . . 34
Accessing Port Statistics . . . . . . . . . . . . . . . . . . . . . . . . . . . . . . . . . .34
Using Port Statistics . . . . . . . . . . . . . . . . . . . . . . . . . . . . . . . . . . . . .35
Understanding the Port Statistics Window . . . . . . . . . . . . . . . .35
Selecting Ports and LAGs to Poll . . . . . . . . . . . . . . . . . . . . . . . .37
Filtering the Port Statistics Display . . . . . . . . . . . . . . . . . . . . . .39
VLAN Filtering . . . . . . . . . . . . . . . . . . . . . . . . . . . . . . . . . .40
TopN Filtering . . . . . . . . . . . . . . . . . . . . . . . . . . . . . . . . . . .41
Port Statistics Counters . . . . . . . . . . . . . . . . . . . . . . . . . . . . . . .42
Sorting the Display . . . . . . . . . . . . . . . . . . . . . . . . . . . . . . . . . .43
Searching for Ports and LAGs . . . . . . . . . . . . . . . . . . . . . . . . . .44
Chapter 5 — Voice Port Statistics . . . . . . . . . . . . . . . . . . . . . . . . . . . . 46
Accessing Voice Port Statistics . . . . . . . . . . . . . . . . . . . . . . . . . . . . .46
Using Voice Port Statistics . . . . . . . . . . . . . . . . . . . . . . . . . . . . . . . . .47
Understanding the Voice Port Statistics Window . . . . . . . . . . .47
Selecting IP Telephones to Poll . . . . . . . . . . . . . . . . . . . . . . . . .49
Filtering the Voice Port Statistics Display . . . . . . . . . . . . . . . . .51
Voice Port Statistics Counters . . . . . . . . . . . . . . . . . . . . . . . . . .52
Sorting the Display . . . . . . . . . . . . . . . . . . . . . . . . . . . . . . . . . .53
Searching for IP Telephones . . . . . . . . . . . . . . . . . . . . . . . . . . .54
Chapter 6 — Introduction to SMON History . . . . . . . . . . . . . . . . . . . 55
Accessing SMON History . . . . . . . . . . . . . . . . . . . . . . . . . . . . . . . . .55
The SMON History User Interface . . . . . . . . . . . . . . . . . . . . . . . . . .55
SMON Tabs . . . . . . . . . . . . . . . . . . . . . . . . . . . . . . . . . . . . . . . .56
SMON History Toolbar . . . . . . . . . . . . . . . . . . . . . . . . . . . . . . .56
Desktop . . . . . . . . . . . . . . . . . . . . . . . . . . . . . . . . . . . . . . . . . . .57
Info Box . . . . . . . . . . . . . . . . . . . . . . . . . . . . . . . . . . . . . . . . . . .57
Managing Windows . . . . . . . . . . . . . . . . . . . . . . . . . . . . . . . . . . . . .58

Avaya SMON Manager User Guide v
Table of Contents
History Text Report . . . . . . . . . . . . . . . . . . . . . . . . . . . . . . . . . . . . .58
Chapter 7 — Using SMON History . . . . . . . . . . . . . . . . . . . . . . . . . . . 59
Using Enterprise History . . . . . . . . . . . . . . . . . . . . . . . . . . . . . . . . . .60
Understanding the Enterprise History Window . . . . . . . . . . . .60
Collection Parameters . . . . . . . . . . . . . . . . . . . . . . . . . . . . . . . .63
Activating/Deactivating History Collections . . . . . . . . . . . . . . .63
Activating Auto Save . . . . . . . . . . . . . . . . . . . . . . . . . . . . . . . . .64
Viewing the Collection Log . . . . . . . . . . . . . . . . . . . . . . . . .65
Refreshing the Device List . . . . . . . . . . . . . . . . . . . . . . . . . . . . .66
Saving the Enterprise History Window . . . . . . . . . . . . . . . . . . .67
Using Switch History . . . . . . . . . . . . . . . . . . . . . . . . . . . . . . . . . . . .68
Opening a Switch History Window . . . . . . . . . . . . . . . . . . . . . .68
Understanding the Switch History Window . . . . . . . . . . . . . . .69
Saving a Switch History Report . . . . . . . . . . . . . . . . . . . . . . . . .71
Using Port History . . . . . . . . . . . . . . . . . . . . . . . . . . . . . . . . . . . . . . .72
Opening the Port History Chart . . . . . . . . . . . . . . . . . . . . . . . . .72
Understanding the Port History Chart . . . . . . . . . . . . . . . . . . . .73
Modifying the Port History Display . . . . . . . . . . . . . . . . . . . . . .74
Appendix A — Avaya SMON Manager Menus . . . . . . . . . . . . . . . . . 75
Online SMON Menus . . . . . . . . . . . . . . . . . . . . . . . . . . . . . . . . . . . .75
File Menu . . . . . . . . . . . . . . . . . . . . . . . . . . . . . . . . . . . . . . . . .75
Edit Menu . . . . . . . . . . . . . . . . . . . . . . . . . . . . . . . . . . . . . . . . .75
View Menu . . . . . . . . . . . . . . . . . . . . . . . . . . . . . . . . . . . . . . . .76
Window Menu . . . . . . . . . . . . . . . . . . . . . . . . . . . . . . . . . . . . . .76
Help Menu . . . . . . . . . . . . . . . . . . . . . . . . . . . . . . . . . . . . . . . . .77
SMON History Menus . . . . . . . . . . . . . . . . . . . . . . . . . . . . . . . . . . . .77
File Menu . . . . . . . . . . . . . . . . . . . . . . . . . . . . . . . . . . . . . . . . .77
Edit Menu . . . . . . . . . . . . . . . . . . . . . . . . . . . . . . . . . . . . . . . . .77
View Menu . . . . . . . . . . . . . . . . . . . . . . . . . . . . . . . . . . . . . . . .78
Actions Menu . . . . . . . . . . . . . . . . . . . . . . . . . . . . . . . . . . . . . .78
Window Menu . . . . . . . . . . . . . . . . . . . . . . . . . . . . . . . . . . . . . .78
Help Menu . . . . . . . . . . . . . . . . . . . . . . . . . . . . . . . . . . . . . . . . .79
Appendix B — Setting Up the SMON License . . . . . . . . . . . . . . . . . . 80
Index. . . . . . . . . . . . . . . . . . . . . . . . . . . . . . . . . . . . . . . . . . . . . . . . . . . 81

Avaya SMON Manager User Guide vi
Preface
Welcome to Avaya SMON Manager. This chapter provides an
introduction to the structure and assumptions of the guide. It includes
the following sections:
• The Purpose of This Guide
- A description of the intended
purpose of this guide.
• Who Should Use This Guide
- A description of the intended
audience of this guide.
• Organization of This Guide - A brief description of the subjects
covered in each chapter of this guide.
The Purpose of This Guide
This guide contains the information needed to operate Avaya SMON
Manager efficiently and effectively.
Who Should Use This Guide
This guide is intended for use by network managers familiar with
network management and its fundamental concepts. It is assumed that
the user has the basic responsibility for monitoring Avaya’s intelligent
switching devices and the network traffic.
Organization of This Guide
This guide is structured to reflect the following conceptual divisions:
• Introduction - An introduction to Avaya SMON Manager
including the following chapters:
— Preface - This chapter describes the guide’s purpose, intended
audience, and organization.

Avaya SMON Manager User Guide vii
Preface
— Overview - This chapter provides an overview of the RMON
standard and Avaya Inc.’s SMON concepts, a graphical
example of SMON’s position in a network, a description of the
Avaya Inc. switch architecture and monitoring concepts, and
an introduction to the SMON tools.
• Online SMON - Instructions on how to use Online SMON
Manager applications.
— Introduction to Avaya SMON Manager - This chapter
describes how to launch Avaya SMON Manager and the
SMON tools. It also describes the Online SMON user interface.
— Enterprise Switch Statistics - This chapter describes the
Enterprise Switch Statistics tool in detail, including sample
screens and filtering options.
— Enterprise Port Statistics - This chapter describes the
Enterprise Port Statistics tool in detail, including sample
screens and filtering options.
— Enterprise Voice Port Statistics - This chapter describes the
Enterprise Voice Port Statistics tool in detail, including sample
screens and filtering options.
• SMON History - Instructions on how to use SMON History.
— Introduction to SMON History - This chapter explains
how to open SMON History and provides a detailed
description of the SMON History user interface.
— Using SMON History - This chapter describes the SMON
History tools in detail.
The following Appendices are included at the end of this guide:
• Appendix A - The full menu structure in Avaya SMON
Manager.
• Appendix B - How to set up the Avaya SMON Manager license.

Avaya SMON Manager User Guide 1
1
Overview
This chapter describes Avaya SMON Manager, Avaya Inc.’s switched
network monitoring system, and includes the following sections:
• What is RMON
- A brief description of the RMON standard.
• What is SMON
- A general description of SMON switch
monitoring technology.
• Overview of SMON Concepts
- An introduction to SMON
concepts.
• SMON Tools
- An introduction to different types of SMON tools.
What is RMON
RMON is the internationally recognized and approved standard for
detailed analysis of shared Ethernet and Token Ring media. It ensures
consistency in the monitoring and display of statistics between different
vendors.
RMON’s advanced remote networking capabilities provide the tools
needed to monitor and analyze the behavior of segments on a network.
In conjunction with an RMON agent, RMON gathers details and logical
information about network status, performance, and users running
applications on the network.
An RMON agent is a probe that collects information about segments,
hosts, and traffic, and sends it to a management station.
The network administrator uses software tools to view the information
collected by the RMON agent on the management station.
RMON has two levels:
• RMON I analyzes the MAC layer (Layer 2 in the OSI seven-layer
model).
• RMON II analyzes the upper layers (Layers 3 and above).
Avaya SMON Manager User Guide 2
Overview
RMON is an industry standard that Avaya Inc. and other companies
have adopted in their network management applications. Avaya has
taken the RMON standard and extended it to the switching
environment.
What is SMON
SMON is an extension of the RMON standard. SMON adds to the
monitoring capabilities of RMON in the following ways:
• It provides additional tools and features for monitoring in the
switch environment.
• It provides a global view of traffic flow in a network with multiple
switches.
SMON extends both RMON I for the MAC layer, and RMON II for the
network layer and above. SMON monitoring collects and displays data in
real-time.
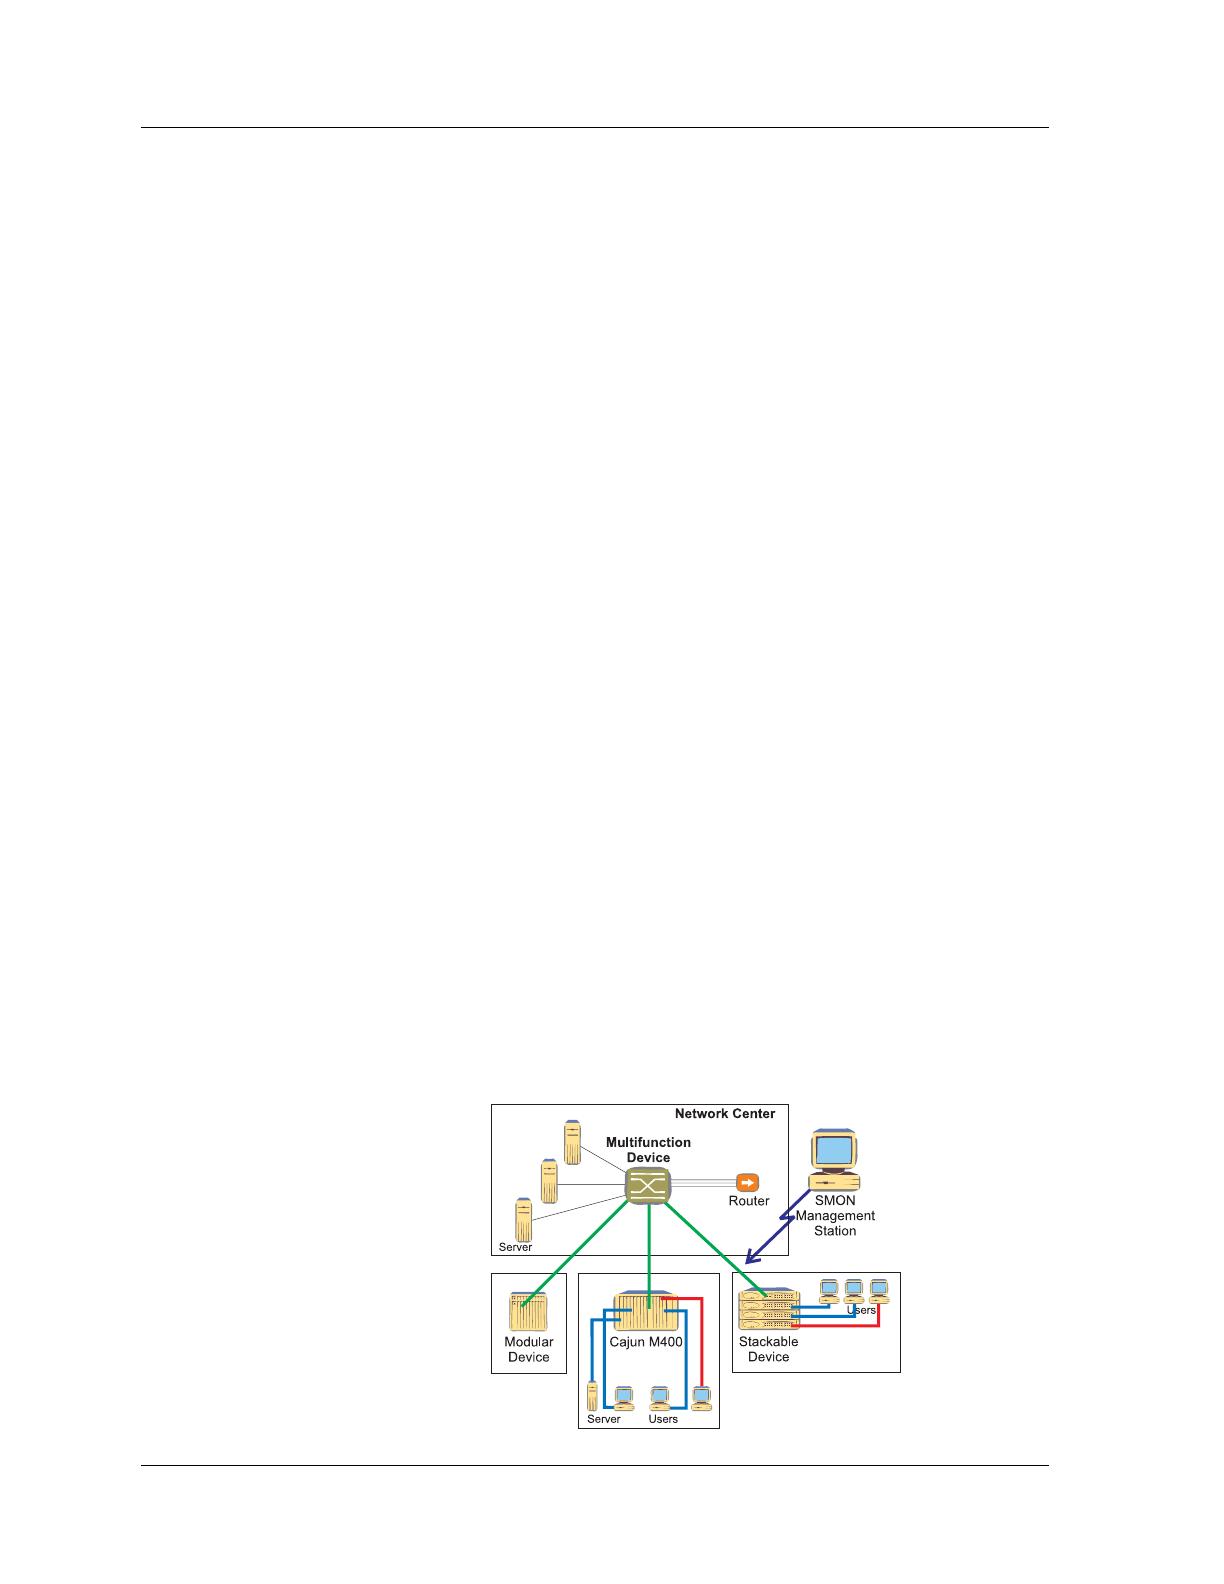
Using SMON monitoring, you can get:
• A global view of traffic for all switches on the network.
• An overall view of traffic passing through a specific switch.
• Detailed data about the hosts transmitting packets or cells
through a switch.
• An analysis of traffic passing through each port connected to a
switch.
• A view of traffic between various hosts connected to a switch.
Figure 1-1. SMON Monitoring

Chapter 1
3 Avaya SMON Manager User Guide
Switch Monitoring
Effective switch management requires a comprehensive monitoring
mechanism. RMON monitoring is not sufficient for switches. RMON
probes can only be used to monitor and analyze a single segment. When
you deploy a switch in the network, there are additional components in
the network that can not be monitored using RMON, such as switch
ports, VLAN, and statistics for all ports.
SMON meets this challenge by extending RMON to the switched
network. The SMON extensions of RMON allow the network
administrator to analyze the switched network and all of its components.
Enterprise Monitoring
Switches are often used in networks with a complex topology. Switches
are typically deployed at the center of an enterprise network between
clients and servers, or in backbones to provide high bandwidth and
secure connectivity.
Avaya SMON Manager uses a client/server architecture for enterprise
monitoring.
SMON extends RMON to provide global monitoring for complex
networks. Avaya SMON Manager tools provide a network-wide view of
all switched devices in the network. They enable you to monitor the
entire network in a single window.
SMON Management Applications
The management applications provided by the SMON extension of
RMON include SMON I tools on the MAC layer, and AnyLayer SMON
tools on the network layer and above.
The SMON I tools extend RMON I to provide switch monitoring and
global network monitoring on the MAC layer. These tools include:
• Enterprise Switch Statistics
• Enterprise Port Statistics
• Enterprise History
• Switch Statistics
• Switch-wide Quality of Service (QoS) indication (provided as part
of Switch Statistics)

Avaya SMON Manager User Guide 4
Overview
•VLAN Statistics
• Port Statistics
• Extended Port Statistics
• Ethernet Segment Statistics
• Host Statistics
• Host Matrix Statistics
• Port History
The AnyLayer SMON tools extend RMON II to provide switch
monitoring on the network layer and above. These tools include:
• Protocol Directory
• Protocol Distribution
• Network Layer Host Statistics over IP
• Network Layer Subnet Statistics over IP
Overview of SMON Concepts
The SMON applications include Avaya SMON Manager and Avaya
Device SMON applications for Avaya Campus devices. These applications
comprise an RMON-compliant network management suite that
implements the SMON extensions to RMON. Avaya SMON Manager and
Avaya Device SMON applications work with the other components of
Avaya Network Management to provide a full spectrum of in-depth
monitoring of switch traffic and network performance.
Avaya SMON Manager and Avaya Device SMON applications consist of a
software console application on a workstation and remote monitoring
probes in network devices that support SMON.
The console applications communicate constantly with the SMON
devices on your network. The console uses the SNMP protocol to gather
information from the devices. Avaya SMON Manager and Avaya Device
SMON applications provide you with a suite of powerful graphic display
tools to view this information.
Avaya’s SMON tools give you detailed analysis of the traffic flow on your
switched network, from a global view down to a specific host, and from
total MAC layer traffic down to a specific application protocol - all in
real-time.

Chapter 1
5 Avaya SMON Manager User Guide
SMON Devices
Avaya’s SMON tools provide monitoring capabilities for network devices
that support the SMON extensions of the RMON standard.
For Avaya M770, Avaya P130, Avaya C360, Avaya W310, and
Avaya P330 Devices, SMON monitoring capabilities can be activated by
purchasing an SMON license from Avaya Inc.
Avaya M770 M-MLS Devices and Avaya P333R Devices also support the
AnyLayer SMON extensions of RMON II.
The following table shows the SMON monitoring components supported
by the various network devices.
1
As part of Switch Statistics application.
Table 1-1. SMON Monitoring Support by SMON Devices
Avaya P330
Devices
Avaya
M770
Device
DomainX
Avaya P460,
P580, P882,
W310, C360
and P130
Devices
Enterprise Switch Statistics √√√
Enterprise Port Statistics √√√
Enterprise Voice Port
Statistics
√
Enterprise Port History √√
Switch Statistics √√√
Switch-wide QoS Indication √
1
VLAN Statistics √√√
Port Statistics √
2
√√
2
Ethernet Segment Statistics √√
Host Statistics √
4
Host Matrix Statistics √
4
Port History √√√
Protocol Directory √
4
√
3
Protocol Distribution √
4
√
3
Network Layer Host
Statistics (IP)
√
3
Network Layer Subnet
Statistics (IP)
√
4
√
3

Avaya SMON Manager User Guide 6
Overview
2
Extended Port Statistics are also supported.
3
Supported when using the Avaya M770 M-MLS.
4
Supported when using a Avaya P333R module.
Top-Down Monitoring
Avaya’s SMON applications provide multi-tiered monitoring capabilities,
both for the MAC layer (SMON I) and for upper layers (AnyLayer
SMON). Multi-tiered monitoring enables you to use powerful top-down
network monitoring techniques.
Top-down monitoring begins when you notice particular traffic flow
patterns in a global view of your network. You then progessively focus in
until you find the specific source or sources of the traffic. Using this
method, the amount of information you need to assess is kept to a
minimum. Top-down monitoring is robust enough to keep you in
control of even the most complex and sophisticated networks.
Top-D own
Monitoring
for the MAC
Layer
The top tier for Avaya SMON monitoring at the MAC layer (SMON I) is
Enterprise Switch Statistics. The Enterprise Switch Statistics tool shows
summary traffic statistics for all switches in your network.
The next two tiers provide a general look at the traffic passing through a
specific switch. In this way, you can view at a glance whether the switch
is functioning efficiently and effectively. These tiers provide answers to
questions such as:
• Is there more traffic than usual passing through this switch?
• Are there more error packets than usual?
• How much traffic is passing through the VLANs?
• Do the VLANs have equal loads?

Chapter 1
7 Avaya SMON Manager User Guide
The lower monitoring tiers provide more focused views of the traffic on
the device. They allow you to zero in on a specific host or port on a
switch. You can then pinpoint the exact source of the traffic discovered
in the upper tiers.
Figure 1-2. Top-Down Monitoring for the MAC Layer
Top-D own
Monitoring
for the
Upper
Layers
Avaya’s SMON applications provide a series of AnyLayer SMON tools for
implementing top-down monitoring techniques at the network layer
and above. Top-down monitoring on upper layers allows you to view
aspects of your network that extend beyond the router, or that apply to a
specific application protocol.
The upper tier of SMON top-down monitoring for upper layers is
Protocol Distribution. The Protocol Distribution tool gives a general view
of traffic through a switch, organized by protocol. Some of the types of
questions Protocol Distribution may provide answers to are:
• What proportion of the traffic consists of IP maintenance
protocols, such as ARP, RIP, or SAP?

Avaya SMON Manager User Guide 8
Overview
• Is there an unusual amount of traffic for a specific type of
application protocol, such as e-mail, name service, or HTTP?
• Is there an unusual amount of ICMP traffic that may be caused by
flood pinging?
The lower tiers then allow you to locate the IP subnet or specific IP host
that is the source of the traffic discovered using Protocol Distribution.
Figure 1-3. Top-Down Monitoring for Upper Layers


Avaya SMON Manager User Guide 10
Overview
Avaya SMON Manager Tools
Avaya SMON Manager tools provide global monitoring capabilities for
multiple SMON devices on a network. There are two types of SMON
Manager tools:
• Online SMON Tools - Tools providing network-wide switch and
port monitoring information in real-time. These tools include:
— Enterprise Switch Statistics
— Enterprise Port Statistics
— Enterprise Voice Port Statistics
• SMON History Tools - Tools providing views and reports of
monitoring information gathered over time. These tools include:
— Enterprise History
— Enterprise Switch History
— Port History
— Enterprise Voice Port Statistics
In addition, the Port History tool can be accessed from Enterprise
History. These tools enable the network administrator to monitor and
control history activities of all switches from two central control screens.
Enterprise
Switch
Statistics
The Enterprise Switch Statistics tool enables the network administrator
to monitor network statistics of all switches on the network level, in a
network which supports SMON.
As more and more switches are implemented in networks, it becomes
increasingly important to be able to get a quick view of all the switches.
The Enterprise Switch Statistics application gives you a bird’s-eye view of
the switched network, allowing you to see at a glance which switches
are functioning properly and which require attention.
All devices on the network which have been discovered by the
management umbrella and possess an SMON probe are displayed in a
bar.
Enterprise Switch Statistics displays a concise analysis of the traffic
traversing the switch. Data is displayed as a bar graph, for an
understanding of the exact levels of traffic traversing the switches.

Chapter 1
11 Avaya SMON Manager User Guide
The basic counters (displayed in the bar charts) provide a view of the key
counters for each switch. Placing the cursor over each bar displays an
Info Box, containing the Type, IP address, and MAC address of the
associated device. This allows you to easily track switches.
The Enterprise Switch Statistics view forms the top layer of the MAC
level top-down monitoring concept. It allows you to view the level of a
specific user to isolate network problems quickly and accurately.
The relevant Device SMON application for each specific device can be
opened from within Enterprise Switch Statistics.
Enterprise
Port
Statistics
Enterprise Port Statistics is an integral part of Avaya SMON Manager. It
allows you to see the data passing through selected ports on switches.
For each port, Avaya SMON Manager summarizes the traffic, such as
good and error unicasts into the switch, and packets from the switch.
If you notice that a particular port displays a disproportionate number of
errors, this may indicate that a specific device connected to the port is
responsible. If the attached port supports a Gigabit Ethernet connection,
only a few hosts will be attached to this port. This makes it easy to locate
the responsible host.
Enterprise
Voice Port
Statistics
Enterprise Voice Port Statistics allows you to see the information on the
data passing through Avaya IP telephones.
For each Avaya IP telephone, Avaya SMON Manager summarizes the
traffic, such as good and error unicasts into the switch, and packets from
the IP telephone.
If you notice that a particular IP telephone displays a disproportionate
number of errors, this may indicate that the specific IP telephone
connected to the port may be faulty. In addition, very high traffic
statistics for an IP telephone may indicate heavy usage.
Enterprise
History
Using the Enterprise History tool, you can easily activate the history
mechanism, and upload data from the Avaya M770, Avaya P130,
Avaya P330, Avaya C360, Avaya G350, Avaya W310, Avaya C460, Avaya
P580, and Avaya P882 Device probes.
In addition, you can perform an automatic, periodic upload of data
stored in the probes during the collection period and store this data for
later analysis.

Avaya SMON Manager User Guide 12
Overview
For the Enterprise History application, the agent stores up to 360
separate data samples at equal time intervals that can later be retrieved
from the SMON console. This is called History data, and provides an
alternative method for analyzing the data in a switched network. The
agent collects port history counters for all the ports in a device.
The Enterprise History application is a control center for managing the
collection of History data on all agents in the network. Its main tasks are:
• Showing the status of Port History on each agent.
• Enabling the uploading of History data stored on each of the
agents.
• Activating Port History on the console to display the History data
stored on an agent.
The main advantages of using History data are:
• Quality information about network performance are received.
After analyzing the performance, you can plan accordingly for
expected times when ports on the network are reaching their full
capacity.
• Data is collected on all switch ports at the same time.
• Statistics can be imported into an external application, such as a
database or spreadsheet, for more detailed analysis.
• Data can be graphically displayed to view history behavior.
The Enterprise History application can save History data from the agents
in the network manually or automatically. Manual upload means that
you must select an agent and then activate the upload. Automatic
upload means that the Enterprise History application saves the data
according to a predefined interval for selected agents.
Enterprise
Switch
History
Enterprise Switch History provides the option to use two collections at
the same time, a long term collection and a short term collection. The
short term collection consists of data collected at brief intervals. This
provides a complete breakdown of network performance over a few
hours or days. The long term collection consists of data collected at
longer intervals over a period of a few days or weeks. This method
provides a long term view of the network.
A collection period is divided into a maximum number of separate
samples. You can upload the data at any time during the collection
period, even before it is completed. By analyzing this data using Port
History, you can view the times and locations of the peak activity periods
on the network.

Chapter 1
13 Avaya SMON Manager User Guide
The key parameters for collections are:
• Collection Duration - The interval for each collection. This
defines how long the agent collects and stores the History data.
For example, a collection duration of 2 weeks, results in the agent
collecting and storing data for 2 weeks. The longer the collection,
the longer the interval between when the agent collects data.
• Status - This defines whether a collection is active (the agent
collects data) or inactive (the agent does not collect data). When
setting an automatic upload of data for a Collection, the
management station only uploads data for active Collections.
Port History Using the Port History tool, you can access detailed history information
collected by an SMON probe. This application is launched from the
Enterprise Switch History application.
The benefits of Port History include:
• Quality information reports about the performance of specific
ports.
• The ability to work on all switch ports at the same time.
• The ability to plan for expected times when ports on the network
are reaching their full capacity after analyzing the performance.
• The ability to view the effect of a change of configuration on the
performance of the network. You can also view the exact details
of the change itself in terms of which modules were inserted or
removed.
• The ability to discover the time a reported problem occurred and
on which port.
• The ability to view the ports and times where the traffic is at its
highest or lowest.
• The ability to import the statistics into an external application,
such as a database or spreadsheet, for more detailed analysis.
• The ability to view individual port history statistics in graph form.
/