Page is loading ...

SET UP GUIDE
MODEL NUMBER V23
Wi-Fi COLOR WIND SPEED
+ WEATHER SYSTEM

Register Your Product
and Double Your Warranty
Scan Here
Scan the QR Code or visit: bit.ly/v23_register
to register your product and to double the standard one-year
warranty for free by opting to receive occasional product emails.

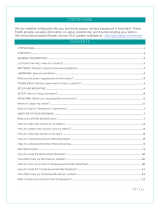
BASICS
SUPPORT
LA CROSSE VIEW
APPENDIX
Initial Setup
Display Settings
Buttons
LCD Display Brightness
Auto-Dim Settings
Time & Calendar Display
We’re Here to Help
Factory Reset
Stay in Touch
Connecting to the App
Connecting Your Display
Adding Your Sensors to
the App
Data Stream Technology
Specifications
Cautions & Statements
Recycling & Disposal
02
06
07
08
08
09
WIND
Viewing Wind Data
Wind Speed Records
Customizable Alerts
14
15
18
SENSORS
Placement & Mounting
Glide Pro Sensor
Installation
Add-On Sensors
Adding Sensors to Your
Display
Viewing Your Add-On
Sensor Data
19
20-21
22-23
24
24
FORECAST
Viewing Forecast Data
Viewing Extended Daily
and Hourly Forecast Data
Day/Night Forecast
Moon Phase
10-12
11
12
12
PRESSURE
Relative Pressure 13
TEMP. AND HUMIDITY
Viewing Temperature and
Humidity Data
Temperature and Humidity
Records
“Feels Like” Temperature
Customizable Alerts
16
17
17
18
28
28
28
03
04
05
09
25
25-28
28
Table of Contents

02
Initial Setup
BASICS
Power Up
Note: It may take up to 10 minutes for the sensor data to appear on your display.
Thermo-Hygro Sensor
Slide the battery cover down to remove it. Install 2 fresh “AA” batteries according to polarity and snap
the cover back into place. The blue LED light will flash when transmitting.
Glide Pro Sensor
Slide the outer cover down to remove it. Then remove the inner battery cover and install 3 fresh “AA”
batteries according to polarity. Replace both the battery cover and outer cover.
Display
Insert the 5V Power Adapter into an outlet, and then plug it into the Power Jack on the bottom of
the display. Next, remove the Insulation Tab from the Battery Compartment. About 30 seconds after
powering on, it will automatically enter the Settings Menu. See page 06 for more details.
Power Jack
Glide Pro Sensor (LTV-W3) Back of Display (V23)Thermo-Hygro Sensor
(LTV-TH2i)

Connecting to the App
LA CROSSE VIEW
Download the La Crosse View App
Visit the App Store or Google Play Store to download the free
La Crosse View app onto your mobile device.
Launch the App
Connecting Your Display to the App
Open the La Crosse View app. Follow the on-screen setup
instructions to create an account, add new devices, and connect
your display to your Wi-Fi network.
Stay connected to your home anytime, anywhere with the
La Crosse View app.
Monitor your home environment and set custom alerts to notify
you when conditions change.
Connecting is optional and the display will function as a
standalone unit without the Wi-Fi connection. However, we
recommend connecting during the initial setup, as it will save you
time and allows access to some advanced features right away.
Stay Connected to Your Home
Anytime, Anywhere.
Now that you’ve created your La Crosse View account, it’s time to add your system to your
account and connect it to your home router using the La Crosse View app.
Note: For the steps listed on the next page, you’ll need your Wi-Fi network name (SSID)
and password. Make sure your mobile device is connected to the same Wi-Fi network.
03

Adding & Connecting Your Display to Wi-Fi
LA CROSSE VIEW
04
Checking Your Display’s Wi-Fi Status
Press the SET button on the top of the display to view your Wi-Fi Status.
Having Trouble Connecting to Wi-Fi?
The app should guide you through the best method for your Wi-Fi network and router. However,
if you have trouble connecting, please go to: bit.ly/wifi_questions or scan the QR code. This will
explain additional connectivity options, including connecting by WPS or contacting our technical
support team for further assistance.
The La Crosse View app is required to connect the display to your Wi-Fi network. Download, install,
and log into your La Crosse View account first.
New User Initial Setup: When first setting up your
system, the app will lead you through a series of
instructions to help get your system added into your
account and connected to your home Wi-Fi network.
Manually Add & Connect Display: After the initial walkthrough,
displays can be added and connected via the Devices tab in
the app’s main menu. Simply tap the Add Device or + button
at the bottom of the Devices page in the app.
1.
Follow the initial app instructions or manually add the display into your account. 2.
Next, the app will prompt you to use your phone to scan the device ID barcode located on the back of
the display. Please note, adding a device to your account and connecting it to Wi-Fi are two dierent
steps. You can complete either step separately if you have any trouble.
When connected, the display will beep, and time and forecast information should appear on the screen.
The indicator will also become solid.
3.
4.
ALL OK CONNECTED: Your system is connected to your
Wi-Fi and its data should be available on the display and
in the app.
SEE APP TO CONNECT: Check the app for notifications.
NO WEATHER SERVICE: Your Internet weather and time
services are not connecting. These should resolve on their
own, please be patient.
LOST WIFI: Check your router and network connections.

* This step is only required if you do not receive the Add Device
notification within the app.
Prior to mounting/positioning your sensors, make sure your
display is receiving sensor data.
Upon getting the display connected to your Wi-Fi network, the app will
explain how your connected sensors should be brought in. Within the
next 15 minutes, you should receive an Add Device notification in your
app. This is indicated by the Red Cloud and the number inside of it. Tap
this icon to begin adding your sensors into the app.
1.
Manually Add Your Sensors to the App*
3.
4.
2.
Open your La Crosse View app. On the
Main Menu, scroll to ADD/EDIT and select
DEVICES.
Scan the Barcode on your Sensor or type
in the Device ID manually.
Confirm the sensor image and Device
ID and add a Device Name and Location
Name. Select DONE.
On the Devices page, select the ADD
DEVICE or PLUS (+) button.
100%
Add Device SaveCancel
12:34
2
Please wait up to 15 minutes
for your additional devices
to connect to your account.
If you do not receive device
notifications, go to the Main Menu
and select Add/Edit Devices to
add your devices separately.
Check the notification icon when
your devices are ready to add.
Adding Your Sensors to the App
LA CROSSE VIEW
02
123456-ABC
123456-ABC
123456-ABC
▲ Back of Thermo-Hygro Sensor
Inside of Glide Pro Sensor
05

06
Display Settings
BASICS
About 30 seconds after powering on, the display will automatically enter the Settings Menu.
Use the steps below to navigate the menu and get your display working the way you’d like.
Settings Menu Order
HELLO Greeting
Language (English/Spanish/French/German)
Beep On/O
Time Format (12 or 24 Hour)
Hour | Minute | Year | Month | Date
Calendar Order (Month/Date or Date/Month)
Temperature Units (Fahrenheit or Celsius)
Temperature Decimal On/O
Pressure Units (InHg or hPa)
Custom Pressure Value
Wind Speed Units (MPH or KPH)
Wind Direction (Letters or Degrees)
THANK YOU Message
Important: Settings such as language and units of measure must
be set manually within the display Settings Menu. These are not
controlled by the La Crosse View app.
The language selected will aect menu instructions as well as
weekday and month readouts.
Weekday will set automatically after year, month, and date
settings are adjusted.
When in 24 hour time format, seconds will show in place of
AM/PM markings.
If you’re connected to Wi-Fi, the time/date will automatically
update from the Internet. See pages 03-05 for more info.
Navigating the Settings Menu
To manually set language, time/date, and
other settings, hold the SET button to enter
the Settings Menu.
1.
Use the +/- buttons on the top of the display
to adjust the values.
2.
Press the SET button to confirm your
selection and move to the next setting.
3.
You may exit the Settings Menu at any time
by pressing the LIGHT button.
4.

Front of Display Back of Display
07
Buttons
BASICS
* Your display must be connected to Wi-Fi to receive Daily/Hourly forecast information.
1. ALERTS: Hold to enter Alert Settings. Press to confirm and move to next item. Use the + or - buttons
to arm or disarm an alert, and to adjust alert values.
2. WIND: Press to view Wind Speed History. While viewing, hold the MINUS (-) button to reset the
history value. Hold the WIND button to search for the Glide Pro sensor.
3. SET: Press to view Wi-Fi status. Hold to enter the Settings Menu.
4. PLUS/MINUS (+/-): Use to adjust values. When in Alert Settings, press to arm/disarm alert.
5. TEMP: Press to view Temperature & Humidity History. While viewing, hold the MINUS (-) button to reset
history value. Hold the TEMP button to search for the Thermo-Hygro Sensor.
6. LIGHT: Press to adjust backlight or to exit settings. Hold to enter Auto-Dim settings.
7. EXTRA SENSOR ( ): Tap to view sensor ID numbers. While viewing, hold the MINUS (-) button
delete the sensor. Hold the EXTRA SENSOR ( ) button to search for new sensors.
8. EXTENDED FORECAST ( ): Tap to see Daily or Hourly Forecast. Hold to auto-scroll forecast data.*
9. WIFI: Press during initial setup for Wi-Fi Connection. Hold to re-enter Configuration Mode and
clear previous Wi-Fi settings.

Adjusting the LCD Display Brightness
Press the LIGHT button on the top of the display
to adjust the backlight intensity. There are four
brightness levels, plus an o option.
08
LCD Display Brightness
BASICS
Note: Only the starting and stopping hours can be set. The Auto-Dim Icon ( ) will appear on the
LCD when the Auto-Dim feature is activated.
Auto-Dim Settings
Program your display to automatically dim during preselected times.
1. Hold the LIGHT button to enter the Auto-Dim
Settings Menu.
2. Press the +/- buttons to turn the Auto-Dim
feature on/o. Press LIGHT to confirm.
4. Press the +/- buttons to adjust the stopping
hour. Press LIGHT to confirm and exit.
3. Press the +/- buttons to adjust the starting
hour. Press LIGHT to confirm.

09
BASICS
Time & Calendar Display
Data Stream Technology®
Data Streams allow you to see additional AccuWeather information in the time and calendar
section on the display. Learn how to set these up in our video here: bit.ly/datastream_vid
* Your display must be connected to Wi-Fi to receive Data Stream information.
Check the La Crosse View app
for a comprehensive list of
Data Stream options.
Stream Options Examples:
• UV Index
• Sunrise/Sunset Times
• Chance of Thunderstorms
• Air Quality
• Personal Message
1. WEEKDAY: Full day of the week display.
2. 12/24 HOUR TIME: Time will automatically update
when connected to Wi-Fi.
3. WI-FI ICON ( ): Indicates active Wi-Fi connection.
4. AUTO-DIM ICON ( ): Indicates Auto-Dim is active.
5. LOW BATTERY INDICATOR ( ): Appears when
station battery needs to be replaced.
6. CALENDAR: Select Month/Date or Date/Month
order in the Settings Menu.

Note: The Forecast Icons may not represent your current weather. They are a future prediction of weather to come
over the next 12 hours.
10
Viewing Your Forecast Data
FORECAST
When using as a standalone unit, the display uses changes in barometric pressure to predict your weather
to come. This is represented by the 6 forecast scenes below. High and low temperatures will come from
the Thermo-Hygro Sensor. Watch our Forecast Icon Video for more details: bit.ly/forecast_vid
When connected to Wi-Fi, the display will receive additional weather icons, chance of precipitation values,
and future forecast information from AccuWeather. Additional forecast scenes include:
Sunny
Sunny
Light Snow
Partly Sunny
Partly Sunny
Snowy
Snowy
T-Storms
Foggy
Rainy
Light Rain
Windy
T-Storms
Rainy
Icy
Cloudy
Cloudy
Wintry Mix
The Internet Indicator icon ( ) and word FORECAST will appear at
the top of the forecast section when your display is connected and
receiving AccuWeather data.
Enhanced Forecast Data Powered by

Viewing Extended Forecast Data
FORECAST
11
Hourly & Daily Extended Forecasts
When connected to Wi-Fi and opted in for weather services
in the La Crosse View app, tap the EXTENDED FORECAST
( ) button on the front of the display to toggle through your
next 12 hours and next 7 days of forecast data.
Hourly and daily forecast predictions provide dierent sets
of data from AccuWeather. They use Internet sources and
do not include measurements from your outdoor sensors.
Hourly Forecast Example Daily Forecast Example
Hourly Forecast Data Includes: Daily Forecast Data Includes:
Forecast Icons
Chance of Precipitation
Wind Speed & Gust
Wind Direction
Forecast Icons
Chance of Precipitation
Wind Speed & Gust
Wind Direction
Current Temperature
“Feels Like” Temperature*
Outdoor Humidity
UV Index
MIN/MAX Temperatures
UV Index
* “Feels Like” Temperature only appears when conditions are met, see page 17 for more information.
Note: Your display must be connected to Wi-Fi to receive Extended
Forecast data. These are Internet predictions from AccuWeather
and do not use data from your outdoor sensors.

Viewing Your Forecast Data
FORECAST
12
Spring (March 20th to June 20th)Summer (June 21st to Sept. 20th)Fall (Sept. 21st to Dec. 20th)Winter (Dec. 21st to March 19th)
Seasonal Trees
The foliage scene in the forecast section changes seasonally. The dates are pre-programmed.
Daytime Forecasts & Moon Phase
When clear or partly clear conditions are predicted during
the daytime (7:00am to 6:59pm), the sun icon will show. From
7:00pm to 6:59am, the Moon Phase will appear regardless
of forecast. These times are preprogrammed and cannot be
adjusted. The moon icon is based on the lunar calendar and
year, month, & date settings. The phases include:
Trend Arrows
The arrows represent changes in pressure over the past 3 hours.
Rapid Increase Steady Pressure Rapid DecreaseSlow Increase Slow Decrease
Day Forecast (partly clear example)
Night Forecast (partly clear example)
New Moon
Full Moon
Small Waxing
Crescent
Large Waning
Gibbous
Large Waxing
Crescent
Small Waning
Gibbous
First Quarter
Last Quarter
Small Waxing
Gibbous
Large Waning
Crescent
Large Waxing
Gibbous
Small Waning
Crescent

The Relative Pressure reading will come from your
display’s internal barometer.
• Please allow up to 10 days for automatic
calibration, or program your local pressure
value in the Settings Menu.
• The default pressure reading is 29.91 InHg
(1013 hPa). The display will acclimate on its
own if the pressure value is not set.
• Select your preferred unit of measurement
(hPa or InHg) in the Settings Menu.
13
Relative Pressure
PRESSURE
Relative Pressure Example Water Leak Sensor Example
Pressure & Add-On Sensor Data
Your relative pressure and add-on sensor data share the same section on the display. Whether you
choose to connect to the La Crosse View app or not, this display can show data for up to 4 extra
sensors. This data will appear in the blue section on the display and in the app if connected.
Note: Add-on sensors are sold separately. See pages 22-24 for add-on sensor information.

Viewing Wind Data
WIND
14
1. LOW BATTERY INDICATOR ( )
Indicates the batteries in the Glide Pro Sensor
should be replaced soon.
2. INTERNET INDICATOR ( )
Indicates the display is receiving Wind Direction
from AccuWeather.*
3. TOP WIND SPEED
Top wind speed in the past 60 minutes.
4. CURRENT WIND DIRECTION*
Choose between cardinal points (letters)
or degrees in the Settings Menu.
5. HIGH WIND SPEED ALERT ICON
Appear if a wind speed alert is set & active.
6. RECEPTION INDICATOR ( )
Indicates if the display is receiving data from
the Glide Pro Sensor.
7. WIND SPEED GRAPH
Visual representation of current wind speed.
8. CURRENT WIND SPEED
Top wind speed in the past 31 seconds.
* Your display must be connected to Wi-Fi to receive
wind direction data.

WIND
15
24 Hour Record Example 1 Month Record Example 1 Year Record Example
Wind Speed Records
When viewing the monthly record, press the PLUS (+)
button to toggle through the current month and past
11 months of top speed records.
Press the WIND button to view wind speed
records.
Next, hold the MINUS (-) button until dashes
appear on the display. This reading will now
reset to the current wind value.
Reset Wind Speed Records
Viewing Wind Speed Records
Press the WIND button on the top of the display to
toggle through wind speed records with time and
date stamps.
This system measures high wind speed records for the past 24 hours, 7 days, 1 month, and 1 year.

16
Viewing Temperature & Humidity Data
TEMPERATURE & HUMIDITY
1. THERMO-HYGRO SENSOR ICON ( )
Indicates Temperature readings are coming from
a Thermo-Hygro Sensor.
2. LOW BATTERY INDICATOR ( )
Indicates the batteries in the Thermo-Hygro Sensor
should be replaced soon.
3. RECEPTION INDICATOR ( )
Indicates if the display is receiving data from
a Thermo-Hygro Sensor.
4. “FEELS LIKE” TEMPERATURE
Current Heat Index or Wind Chill when conditions
are met.
5. OUTDOOR HUMIDITY TREND ARROWS
Indicate humidity trend over the past 3 hours
6. OUTDOOR HUMIDITY
Current relative humidity
7. OUTDOOR HUMIDITY ALERT ICONS ( )
Appear if a high ( ) or low ( ) alert is set & active.
8. OUTDOOR TEMPERATURE ALERT ICONS ( )
Appear if a high ( ) or low ( ) alert is set & active.
9. OUTDOOR TEMPERATURE TREND ARROWS
Indicate temperature trend over the past 3 hours
10. OUTDOOR TEMPERATURE
Current temperature (decimal/no decimal option)
11. INDOOR TEMPERATURE ALERT ICONS ( )
Appear if a high ( ) or low ( ) alert is set & active.
12. INDOOR HUMIDITY ALERT ICONS ( )
Appear if a high ( ) or low ( ) alert is set & active.
13. INDOOR TEMPERATURE
Current temperature (decimal/no decimal option)
14. INDOOR HUMIDITY
Current relative humidity
Note: You can choose decimal/no decimal display option in the Settings Menu (see page 6).

Wind Chill: When temperature is below 50ºF (10ºC) and there is 5 MPH (8 KPH)
of sustained wind speed.
Heat Index: When temperature is above 80ºF (27ºC).
Current Temperature When the temperature is between 50°F and 80°F
(10.5ºC and 26.1ºC), the readings will remain the same as the outdoor
value regardless of wind speed.
Temperature & Humidity Records
17
Viewing Temperature & Humidity Records
This reading indicates both Wind Chill and Heat Index values when conditions are met.
“Feels Like” Temperature
TEMPERATURE & HUMIDITY
Viewing Temperature & Humidity Records
Press the TEMP. button to toggle through records with time and date stamps.
Press the TEMP. button to view temperature
and humidity records.
Reset Temperature & Humidity Records
Next, hold the MINUS (-) button until dashes
appear on the display. This reading will now
reset to the current value.
Records Viewing Order
1. Outdoor High Temperature
2. Outdoor Low Temperature
3. Outdoor High Humidity
4. Outdoor Low Humidity
5. Indoor High Temperature
6. Indoor Low Temperature
7. Indoor High Humidity
8. Indoor Low Humidity
9. “Feels Like” High Temperature
10. “Feels Like” Low Temperature
11. Dew Point
High Outdoor Temperature Record Example

Customizable Alerts
18
ALERTS
Hold the ALERTS button to enter alert settings.
Activating/Deactivating Alerts
Use the +/- buttons to activate/deactivate alerts.
Alert Setting Order
1. High Wind Speed
2. Outdoor High Temperature
3. Outdoor Low Temperature
4. Outdoor High Humidity
5. Outdoor Low Humidity
6. Indoor High Temperature
7. Indoor Low Temperature
8. Indoor High Humidity
9. Indoor Low Humidity
High Wind Speed Alert Example
Outdoor Low Temperature Alert Example
Triggered Alerts
• When an alert value is reached, the corresponding
value and alert icon will flash on screen.
• The display will also beep 5 times each minute until
the value moves out of the alert range. Press any
button to stop the alert sound.
• Alerts set on the display are separate from those
created within the La Crosse View app.
Setting Custom Alerts
1. Hold the ALERTS button to enter the Alert Settings Menu.
2. Use the +/- buttons to activate/deactivate individual alerts,
or press the ALERTS button to skip to the next option.
3. Once activated, use the +/- buttons to adjust the values.
Press the ALERTS button to confirm and move forward.
Note: The default setting for alerts is OFF.
Active alerts are indicated by the and / icons
located in their respective sections on the LCD.
/