Page is loading ...

Document No.: M-W3811AE-4.0
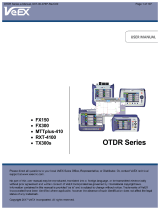
Quick Reference Guide
MT1000A
Network Master Pro
OTDR Modules
Fourth Edition
Power button
Touch Screen display
Battery
• Additional safety and warning information is
provided within the “MT1000A Network Master Pro
OTDR Modules” Operation Manual.
• Please refer to that document before using the
equipment.
• Keep this manual with the equipment.

Contents
Panel .................................................................................. 1
Power ................................................................................. 2
To Power Up ............................................................................... 2
To Power Down .......................................................................... 3
Forced Power Down ................................................................... 3
Toolbars ............................................................................. 4
Basic Screens and Navigation ........................................... 4
Standard OTDR (Optical Time Domain Reflectometer)
........... 6
Measurement condition setup .................................................... 6
Test setup ................................................................................... 8
Measurement ........................................................................... 10
Fiber Visualizer ........................................................................ 11
Trace ........................................................................................ 13
FTTA (Fiber to the Antenna) ............................................. 17
Construction ..................................................................... 18
OLTS (Optical Loss Test Set) ........................................... 21
File saving and loading .................................................... 27
Saving the file ........................................................................... 27
Loading the file ......................................................................... 27
Creating the report ........................................................... 29
Copying a file ................................................................... 31
Copyright © 2015-2018, ANRITSU CORPORATION
All rights reserved. No part of this manual may be reproduced without the
prior written permission of the publisher.
The contents of this manual may be changed without prior notice.

1
Panel
MU100021A panel is shown below. MU100020A and MU100022A do not
have the OTDR/OLS (0.85/1.3
m) connector.
*: OTDR/OLS (1.31/1.55/1.625
m) is printed on MU100022A.
VFL: Visual Fault Locator (Option 002)
Visible red light is output.
OPM: Optical Power Meter
Input port for the power measurement. 1.25 mm
or
2.5mm
ferrule can be connected by using the supplied
Universal Connectors.
Universal Connector
OTDR/OLS: Optical Time Domain Reflectometer / Optical Light Source
Port for the OTDR measurement and light source output.
SMF (Single mode fiber) OTDR/OLS connector depends on the
option:
•
Option 010: UPC Connector
•
Option 011: APC Connector
*

2
Power
Power button indication shows the following status.
Gray: Power off
Orange flashing (fast): Booting on AC power
Green flashing: Booting on battery
Orange flashing (slow): Charging
Orange: Stand by
Green: Operating
To Power Up
AC Operation
Connect the AC adaptor to the Network Master. The power button
flashes in orange during booting and remains on after booting.
Press the power button to light it up in green. After a model name is
displayed, the Network Master enters Operating status and the
Application Selector appears.
Figure 1 Application Selector

3
Battery Operation
Press the power button. The Network Master shows a model name and
flashes the power button in green during booting.
Then, the Network Master enters Operating status and shows the
Application Selector.
To Power Down
When you press the Power button, a pop-up menu containing Shut Down
will appear.
Touch Shut Down and then confirm by touching Yes in a dialog box.
AC Operation
After you shut the Network Master down, the Network Master stays
Stand by or charging state until you disconnect the AC adapter.
Battery Operation
After you shut the Network Master down, the power goes off.
Forced Power Down
If it is not possible to power down the Network Master using the power
button menu, the following procedure can be used to make an emergency
power down.
1. Disconnect AC adapter if it is connected.
2. Hold the Power button depressed for a couple of seconds.

4
Toolbars
General functionalities such as start/stop of test, creation of the report,
displaying the help etc. are placed in expandable toolbars.
Application toolbar Instrument toolbar
Start Averaging
Instrument information
Stop the measurement
Network setting and
General settings (ex.
Date, Language)
Start Realtime*
1
Skip a measurement*
2
File manager
Accept the result*
2
Displays Help
Create a report Resource monitoring
Displays Help
Save a file
Load a file
Close the application
*1: Appears on Standard OTDR and FTTA application.
*2: Appears on Construction application.
Basic Screens and Navigation
You can navigate freely both horizontally and vertically between the
various screens, as shown in the figure in next page. Set the
measurement conditions on the Setup screen, and configure the test
setups on the Test screen. Touching the Start Averaging or Start Realtime
on the Application toolbar will display the Result screen.

5
Application Selector screen
Result Files Browser screen
Setup screen
Test screen
Result screen
”Navigation
area”

6
Standard OTDR (Optical Time Domain Reflectometer)
To locate where the reflection happens, and measure the
fiber loss, touch Standard OTDR in the Application selector.
Measurement condition setup
1. To display the Setup screen, touch SETUP at the bottom of the
screen.
2. For MU100021A, touch Port in the navigation area.
Set Output Port to Single Mode or Multi Mode.
3. Touch Measurement in the navigation area.
If selecting Auto, the parameters will be set automatically.
Selecting Manual allows user to set parameters.
Select Wavelength used for the measurement.
4. Touch IOR/BSC. Set IOR, BSC, and Fiber Type.
5. Touch Header. Set each items if you need. These items are saved to
the file. The following items will be printed on the report:
Cable ID, Fiber ID, Location A, Location B, and Operator.
6. Touch Preference. Set each item if you need.

7
Connection Check: If selecting the check box, confirms whether or
not the fiber is connected correctly to the OTDR measurement port.
Active Fiber Check: If selecting the check box, performs a "live
fiber" check on the currently attached fiber under test to detect
whether the fiber is carrying traffic before firing any OTDR laser
sources.
Note:
The Active Fiber Check feature does not apply for the 850/1300
nm multimode fiber.

8
Test setup
1. To display the Test screen, touch TEST at the bottom of the screen.
2. Touch Fiber in the navigation area. Set the length of the patch code
connecting to the fiber under the test. If Output port is set to Single
Mode, set the splitter configuration.

9
3. Touch Auto Detect. Set the thresholds to detect events
automatically.
4. Touch Pass/Fail. Set the thresholds to judge results to pass or fail.

10
Measurement
1. After cleaning the connector of the optical fiber, connect it to the
measurement port of the Network Master.
2. Touch (Start Averaging) or (Start Realtime) on the
Application toolbar.
During the measurement icon blinks to indicate that laser is
output from the measurement port.
If Connection Check is selected, the connection check runs.
Good connection
The gauge is green when connection is good.
Bad connection
The gauge is red when connection is bad. And it is yellow when
connection is not good. Touch Continue soft key to perform the
test.
If the connection state is not improved even if the fiber is cleaned,
the fiber needs to be replaced.
3. If the connection check result is "Good", the measurement starts
and the Fiber Visualizer screen or Trace screen appears.

11
Fiber Visualizer
Touching the Fiber Visualizer button in the navigation area will display
the following screen.
Touching or in Event icon display area allows users to scroll the
icons to right or left. The event positions and displayed range are shown
in the Fiber Schematic.
The events judged as Fail are displayed in red icon. The Trace around
the event displayed enlarged in the center appears at right bottom.
Event Edit
Touch the event icon, and then touch Event Edit to opens the Event Edit
dialog box.
Note:
Start icon and End icon cannot be edited.
Fiber
Schematic
Event icon
dis
p
la
y
area
Total Results
Trace image of
the event
Distance of Far End even
t
Output Port
Pass/Fail result
Distance Range
Pulth Width
Average Time
Wavelength
Latenc
y
to Far End even
t

12
Start of the fiber Splitter Event
Reflective Event
End of the fiber
Non-Reflective Event
Questionable Event
Grouped Event Patch cord (Launch)
Macro Bend Event
Patch cord (Receive)
For soft keys on right hand, refer to the description in Trace. Note that
only Swap Overlay appears for Overlay key in Fiber Visualizer.
Event distance
Event number
Distance from previous event
Event icon
Connection loss at event point
Fiber loss
Reflection at event point
"S" appears if the reflection
level is saturated.
Trace image of the event

13
Trace
Touching the Trace button in the navigation area will display the
following screen.
When this icon is green, allows users to zoom the trace in
by dragging area on the trace window.
When this icon is green, allows users to zoom out the trace
by touching a point on the trace window.
Touching this icon shows the trace in full range.
When this icon is green, touching the trace window allows
users to drag the trace.
Touching this icon displays the buttons to move a cursor
and A, B, Utility buttons under the trace window.
Touching this icon displays the event table.

14
Event Table
The event type is shown by the icon at event position of the trace or in
the event table.
Event Types
Reflective Event
Reflection from a splice point, such as a Fresnel reflection
caused by a mechanical splice or connector.
Non-Reflective Event
Non-reflective events include such low loss events as fusion
splices and Macro Bends.
Grouped Event
Events spaced too close to each other for Analysis to
distinguish them as separate events are reported as
Grouped events.
Far End Event
Any event with a loss equal to or greater than the Fiber
End threshold is reported as the Far End event.
Questionable Event
The last event is set to Questionable End in following case:
• When the fiber length is longer than Distance Range
• When Far End event is not found
Splitter Event
All events other than far end events with losses greater
than the far end threshold are displayed as Splitter events.
Launch Event
Launch Event appears at Launch fiber position. Does not
appear if Launch Fiber is set to None on Fiber screen.
Receive Event
Receive Event appears at Launch fiber position. Does not
appear if Receive Fiber is set to None on Fiber screen.

15
Cursor
Cursor display varies depending on the selected loss type.
Touch A, B, or LSA1 to LSA4.
Touch the position where moving the cursor. Touch < or > to adjust the
cursor position.

16
Soft keys
Switches between Auto and Manual. When Manual
is set, Parameter soft key is available.
Selects the wavelength using for the test.
When Test Mode is set to Manual, opens dialog box
to set Distance Range, Pulse Width, Sampling Mode,
and Average Time.
This key is available when the overlay traces are
loaded.
• Drop Overlay: Opens the dialog box for selecting the trace to drop.
• Swap Overlay: Opens the dialog box for selecting the trace to swap.
• Align Overlay: Switches how to align overlay traces.
• Show Overlay: Turns the overlay trace display on or off.
Analyze: Starts the event analysis.
Add Event: Opens the Add Event dialog box.
Edit Event: Opens the Edit Event dialog box.
Delete Event: Deletes the event.
Bi-Directional is the function to display the Overlay
trace in the reverse direction of distance and analyze
the losses from the two traces.
OFF: Does not display Overlay trace in the reverse
direction.
ON: Displays Overlay trace in the reverse direction
and analyzes the loss.
Active Cursor to Launch: Sets the active cursor
position to Launch Length of Patch-cord Setup.
Active Cursor to Receive: Sets the active cursor
position to Receive Length of Patch-cord Setup.
Switches the output of VFL.

17
FTTA (Fiber to the Antenna)
FTTA application is the optimized application for the short
range fiber measurement such as between the antenna and
controller in the radio base station.
1. Touch FTTA in the Application selector. The Setup screen appears
in the same way as in Standard OTDR application. However the
measurement parameters are more simplified than Standard OTDR
application.
2. Set parameters on the Setup screen and Test screen in the same way
as in Standard OTDR application. There are no Splitter settings in
FTTA application.
3. After cleaning the connector of the optical fiber, connect it to the
measurement port of the Network Master.
4. Touch on the Application toolbar.
During the measurement icon blinks to indicate that laser is
output from the measurement port.
If Connection Check is selected, the connection check runs.
The measurement result appears on the Fiber Visualizer screen or
Trace screen.
For the operation of screens, refer to the description in Standard OTDR
application.

18
Construction
Construction application is optimized for performing
multiple fiber measurements sequentially.
1. Touch Construction in the Application selector. The Setup screen
appears in the same way as in Standard OTDR application.
2. Touch Project and enter the value in Number of Fiber.
3. Touch Measurement in the navigation area.
Touch Wavelength tab and select the wavelength of tests.
For MU100021A, set Output Port to Single Mode or Multi Mode.
Touch Test Parameters tab and set Test Mode to Auto or Manual.
When Manual is selected, set the values of Distance Range, Pulse
Width, Resolution, and Average Time.
/