Page is loading ...

For Research Use Only. Not for use in diagnostic procedures.
Applied Biosystems™ Standard Curve Analysis
Module
USER GUIDE
Publication Number MAN0014819
Revision B.0

The information in this guide is subject to change without notice.
DISCLAIMER
TO THE EXTENT ALLOWED BY LAW, LIFE TECHNOLOGIES AND/OR ITS AFFILIATE(S) WILL NOT BE LIABLE FOR SPECIAL, INCIDENTAL, INDIRECT,
PUNITIVE, MULTIPLE, OR CONSEQUENTIAL DAMAGES IN CONNECTION WITH OR ARISING FROM THIS DOCUMENT, INCLUDING YOUR USE OF IT.
REVISION HISTORY: History of Pub. no. MAN0010504
Revision Date Description
B.0 March 2015 Software user interface updates
A.0 September 2015 Document release
NOTICE TO PURCHASER: DISCLAIMER OF LICENSE: Purchase of this software product alone does not imply any license under any process,
instrument or other apparatus, system, composition, reagent or kit rights under patent claims owned or otherwise controlled by Life Technologies
Corporation, either expressly, or by estoppel.
Corporate entity: Life Technologies Corporation | Carlsbad, CA 92008 USA | Toll Free in USA 1 800 955 6288
TRADEMARKS: All trademarks are the property of Thermo Fisher Scientific and its subsidiaries unless otherwise specified.
©2016 Thermo Fisher Scientific Inc. All rights reserved.

Contents
■CHAPTER 1 Getting Started ............................................. 6
About the software .............................................................. 6
Analysis workflow ............................................................... 7
Compatible Real-Time PCR System Data ........................................... 8
System requirements ............................................................ 9
About the software interface ..................................................... 10
Best practices and tips for using the software ..................................... 10
■CHAPTER 2 Manage experiment data ................................ 11
Create a project and add experiment data ......................................... 11
Manage projects and experiment data ............................................ 12
Share experiments, folders, and projects ......................................... 13
About experiment data/files ..................................................... 15
■CHAPTER 3 Set up the project ......................................... 16
Manage samples and targets .................................................... 16
Import sample information from design files ...................................... 17
Import target information from AIF files .......................................... 17
■CHAPTER 4 Edit experiment properties .............................. 18
Review and edit the plate setups ................................................. 19
Apply samples and targets ...................................................... 19
Specify and assign tasks ........................................................ 20
Specify and assign standards .................................................... 21
Apply plate setup information using a template file ................................. 23
Template files ................................................................. 24
Applied Biosystems™ Standard Curve Analysis Module
3

■CHAPTER 5 Review the quality data and results ..................... 26
Specify a master standard curve and/or inter-plate controls ......................... 26
Configuring the analysis settings ................................................. 30
Reviewing amplification and quality data .......................................... 32
About the quality data summary ................................................. 34
Omit wells from the analysis .................................................... 35
■CHAPTER 6 Export the results ........................................ 36
Export the analyzed data from a project ........................................... 36
Export project data as a slide presentation ........................................ 37
Export plots for presentation and publication ...................................... 38
Export data for use in other projects .............................................. 39
■CHAPTER 7 Screens and plots ......................................... 41
Amplification Plot .............................................................. 42
Multicomponent Plot ........................................................... 43
Standard Curve Plot ............................................................ 44
Well Table ..................................................................... 46
■CHAPTER 8 Quality flags ............................................... 48
AMPNC (Amplification in negative control) quality flag .............................. 49
AMPSCORE (Low signal in linear phase) quality flag ................................ 49
BADROX (Bad passive reference signal) quality flag ................................ 50
BLFAIL (Baseline algorithm failed) quality flag ..................................... 50
CQCONF (Calculated confidence in the Cq value is low) quality flag ................... 51
CRTAMPLITUDE (Broad Cq Amplitude) quality flag ................................. 51
CRTNOISE (Cq Noise) quality flag ................................................. 51
CTFAIL (Cq algorithm failed) quality flag .......................................... 51
DRNMIN (Detection of minimum DRn due to abnormal baseline) quality flag ........... 52
EXPFAIL (Exponential algorithm failed) quality flag ................................. 52
HIGHSD (High standard deviation in replicate group) quality flag ..................... 53
LOWROX (Low ROX™ Intensity) quality flag ......................................... 54
MTP (Melt curve analysis shows more than one peak) quality flag .................... 54
NOAMP (No amplification) quality flag ............................................ 54
NOISE (Noise higher than others in plate) quality flag ............................... 55
NOSAMPLE (No sample assigned to well) quality flag ............................... 55
NOSIGNAL (No signal in well) quality flag ......................................... 55
OFFSCALE (Fluorescence is offscale) quality flag ................................... 56
OUTLIERRG (Outlier in replicate group) quality flag ................................. 57
Contents
4
Applied Biosystems™ Standard Curve Analysis Module

PRFDROP (Passive reference signal changes significantly near the Cq/Ct) quality flag .. 57
PRFLOW (Average passive reference signal is below the threshold) quality flag ........ 58
SPIKE (Noise spikes) quality flag ................................................. 59
THOLDFAIL (Thresholding algorithm failed) quality flag ............................. 59
■APPENDIX A Documentation and support ............................ 61
Customer and technical support ................................................. 61
Limited product warranty ....................................................... 61
Glossary ................................................................... 62
Contents
Applied Biosystems™ Standard Curve Analysis Module
5

Getting Started
■About the software .................................................... 6
■Analysis workow .................................................... 7
■Compatible Real-Time PCR System Data ................................. 8
■System requirements .................................................. 9
■About the software interface ........................................... 10
■Best practices and tips for using the software ............................. 10
The Applied Biosystems™ Analysis Software is a secure web application for analysis
of data generated on Thermo Fisher Scientic real-time PCR instruments. The
software provides project-based analysis of real-time and end-point data for a variety
of quantitative and qualitative PCR applications.
About the software
The Standard Curve (SC) module of the Applied Biosystems™ Analysis Software
performs absolute quantication analysis of standard curve experiments run on
Thermo Fisher Scientic real-time qPCR instruments. The standard curve method is
used to determine the absolute target quantity in samples. With the standard curve
method, the Applied Biosystems™ Analysis Software measures amplication of the
target in samples and in a standard dilution series. Data from the standard dilution
series are used to generate the standard curve. Using the standard curve, the software
interpolates the absolute quantity of target in the samples.
Required experiment components
The following components are required to perform a standard curve analysis and
must be present on all experiments added to the project:
•Samples – The sample in which the quantity of the target is unknown.
•Standard – A sample that contains known standard quantities; used in
quantitation experiments to generate standard curves.
•Standard dilution series – A set of standards containing a range of known
quantities. The standard dilution series is prepared by serially diluting standards.
•Replicates – The total number of identical reactions containing identical samples,
components, and volumes.
•Negative Controls – Wells that contain water or buer instead of sample
template. No amplication of the target should occur in negative control wells.
1
6
Applied Biosystems™ Standard Curve Analysis Module

Analysis workflow
The following gure shows the general workow for analyzing standard curve
projects using the Applied Biosystems™ Analysis Software.
START
q
Create a project
q
Import and add experiment data
q
(Optional) Add and define samples and targets
q
Review/edit the sample, target, task, and standard configurations of
the experiments
q
Review the results of the analysis and adjust the settings (if necessary)
q
Publish the project data
q
FINISH
Chapter 1 Getting Started
Analysis workflow
1
Applied Biosystems™ Standard Curve Analysis Module
7

Compatible Real-Time PCR System Data
The Applied Biosystems™ Analysis Software can import and analyze data generated
by any of the supported instruments listed in the following table. The software
versions listed in the table represent only those tested for use with the Applied
Biosystems™ Software. Data generated by versions other than those listed can be
imported and analyzed by the software, but are not supported by Thermo Fisher
Scientic.
IMPORTANT! The Applied Biosystems™ Analysis Software can import and analyze
data from unsupported versions of the instrument software; however, we cannot
guarantee the performance of the software or provide technical support for the
analyses.
Real-Time PCR System Supported software
version(s)
File
extension
Applied Biosystems™ 7900 HT Fast Real-Time PCR
System v2.4 or later
.sds
Applied Biosystems™ 7500 and 7500 Fast Real-
Time PCR System
v1.4.1 or later
v2.0.5 or later
.eds
Applied Biosystems™ StepOne™ and StepOnePlus™
Real-Time PCR System v2.0.1, v2.1, or later
Applied Biosystems™ ViiA™ 7 Real-Time PCR
System v1.1 or later
Applied Biosystems™ QuantStudio™ 12K Flex Real-
Time PCR System v1.1.1 or later
Applied Biosystems™ QuantStudio™ 3 Real-Time
PCR System
v1.0 or later
Applied Biosystems™ QuantStudio™ 5 Real-Time
PCR System
Applied Biosystems™ QuantStudio™ 6 Flex Real-
Time PCR System
v1.0 or later
Applied Biosystems™ QuantStudio™ 7 Flex Real-
Time PCR System
Chapter 1 Getting Started
Compatible Real-Time PCR System Data
1
8
Applied Biosystems™ Standard Curve Analysis Module

System requirements
The following table summarizes the system requirements for the user environment.
Applied Biosystems™ Analysis Software performance may vary based on your system
conguration.
Category Requirement
Web Browser • Apple™ Safari™ 8 Browser
• Google™ Chrome™ Browser Version 21 or later
• Microsoft™ Internet Explorer™ Browser Version 10 or later
• Mozilla™ Firefox™ Browser Version v10.0.12 or later
Operating
System
• Windows™ XP, Vista, 7, or 8
• Macintosh™ OS 8 or later
Network
Connectivity
An internet connection capable of 300kbps/300kbps (upload/download)
or better.
If your network employs a firewall that restricts outbound traffic, it
must be configured to allow outbound access to
apps.lifetechnologies.com on HTTPS-443.
Chapter 1 Getting Started
System requirements
1
Applied Biosystems™ Standard Curve Analysis Module
9

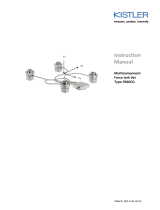
About the software interface
The Applied Biosystems™ Software features a simple interface for analyzing
experiment data and includes the following buons/icons in many of the screens and
plots:
3
2
1
8 97654
11
10
12
1Analysis Modules – Click to analyze the current project
using the selected module.
2 (Data Manager) – Click to view the Data Manager,
which can be used to view, add, or remove data from the
current project.
3 (Project Manager) – Click to view the Project
Manager, which can be used to modify the current project
or open another.
4 (Account Management Menu) – Click to manage your
application licenses or storage.
5Project name – The name of the current project.
Note: Click to close the project.
6Project tabs – Click to view the settings, data, or plot(s)
for the current project.
7 (Notifications) – Click to view important information
and notifications for the current project. The digit within
the icon indicates the number of messages.
8 (Help) – Click to access help topics relevant to the
current settings, data, or plot that you are viewing.
9 (Profile Menu) – Click to change your profile settings
or to log out of the Applied Biosystems™ Software.
10 Analyze – Click to analyze the project after you have
made a change.
11 (Zoom) – Click to magnify the related table or plot to
fill the screen.
Note: Once expanded, click (Close) to collapse the
plot or table to its original size.
12 Actions – Click to select from a list of actions that pertain
to the related table or plot.
Best practices and tips for using the software
The Applied Biosystems™ Analysis Software provides a variety of useful user
interface elements that will enable you to beer organize your data for analysis and
presentation. This topic describes the essentials of the user interface and how to best
use them.
Perform the following actions to help ensure optimal performance of the Applied
Biosystems™ Software:
• Refresh your browser regularly
• Clear your browser cache
Chapter 1 Getting Started
About the software interface
1
10
Applied Biosystems™ Standard Curve Analysis Module

Manage experiment data
■Create a project and add experiment data ................................ 11
■Manage projects and experiment data ................................... 12
■Share experiments, folders, and projects ................................. 13
■About experiment data/les ........................................... 15
Use the Data Manager screen to add and remove experiments to and from your
project. The screen displays all experiments associated with the current project. You
can also use the Data Manager to upload new .eds and .sds les or view the details of
individual experiments already added to the project.
Create a project and add experiment data
1. Click (Manage Projects) to view the Dashboard.
2. Create the project:
a. Click New Project.
b. In the Create Project dialog box, enter a name for the project, select the
folder within which you want to place the project, then click OK.
Note: The project name cannot exceed 50 characters and cannot include any
of the following characters: / \ < > * ? " | : ; & % $ @ ^ ( ) !
2
Applied Biosystems™ Standard Curve Analysis Module
11

3. From the Manage Data screen, add any additional experiment data to the project.
To import
experiment data
stored on…
Action
Your computer
1. Click Import from local.
2. From the Open dialog box, select one or more experiment
files (.sds or .eds), then click Open.
Note: Ctrl- or Shift-click to select multiple files.
Wait for the Applied Biosystems™ Software to upload the
selected data.
3. Click Close prompted that the import is complete.
Thermo Fisher
Cloud
1. Click Import from Thermo Fisher Cloud.
2. Select one or more experiment files (.sds or .eds) from
the table, then click Add.
3. When you are done adding files to the queue, click OK.
4. Click Close prompted that the import is complete.
4. Repeat step 3 until your project contains all of the desired experiment data.
5. Click the appropriate analysis module on the left side of the screen to begin the
analysis.
Manage projects and experiment data
Use the Manage Data screen to add and remove experiment data to/from your project:
•Add experiment data to your project:
a. While viewing your project, click (Manage Data) from the bar on the left
side of the screen.
b. From the Manage Data screen, add any additional experiment data to the
project.
To import
experiment data
stored on…
Action
Your computer
1. Click Import from local.
2. From the Open dialog box, select one or more
experiment files (.sds or .eds), then click Open.
Note: Ctrl- or Shift-click to select multiple files.
Thermo Fisher
Cloud
1. Click Import from Thermo Fisher Cloud.
2. Select one or more experiment files (.sds or .eds)
from the table, then click Add.
3. When you are done adding files to the queue, click OK.
Chapter 2 Manage experiment data
Manage projects and experiment data
2
12
Applied Biosystems™ Standard Curve Analysis Module

c. Wait for the Applied Biosystems™ Software to import the selected data.
When you are prompted that the upload is complete, click Close.
•Delete projects, experiments, or folders:
a. Select the experiments from the Files in this project table that you want to
remove.
b. From the Manage Data screen, select Actions4Delete.
c. When prompted, click OK to remove the experiment(s) from your project.
Note: Click the appropriate analysis module on the left side of the screen to return to
the analysis.
Share experiments, folders, and projects
The Applied Biosystems™ Analysis Software allows you to share any data
(experiments, folders, and projects) with other users that have access to the software.
Sharing data with other users grants them dierent access to the data depending on
the type of object shared:
•Projects – Sharing a project with other users grants them read/write access to the
unlocked project.
IMPORTANT! A project is locked (preventing access) when it is open (in use) by
any user with shared access to the project. For example, User A shares a project
with two colleagues (User B and User C), User B opens the project and begins
data analysis (the project is locked and unavailable to Users A and C) until User B
closes the project at which time it is available again to all three users.
•Experiments – Sharing experiment les with other users grants them full access
to the data, allowing them to import the data to their own projects or download
the experiment data le.
•Folders – Sharing a folder with another user grants access to the contents of the
folder (projects, experiments, and subfolders).
To share projects, experiments, and subfolders with another user:
•Share an experiment, folder, or project:
a. Click (Home), then click All Files to view your data.
b. From the Home Folder screen, select the check box to the left of the object
(project, experiment, or folder) that you want to share, then click (display
details).
Chapter 2 Manage experiment data
Share experiments, folders, and projects
2
Applied Biosystems™ Standard Curve Analysis Module
13

c. Enter the email address of the user with whom you want to share the
selected object, then click .
The user is notied via email that you have shared with them and the shared item
will appear in their Home Folder.
IMPORTANT! To share multiple les:
1. Select the desired objects (projects, experiments, and subfolders) from the
Home Folder screen, then click Actions4Share.
2. In the Share Files dialog box, enter the email address of the user with whom
you want to share the selected objects, then click Share.
•Un-share a le, folder, or project:
a. Click (Home), then click All Files to view your data.
b. Select the shared object, then click the display details icon.
c. In the details pane, select the Shared With tab, then click un-share adjacent
to the email address of the user from which you want to remove sharing
privileges.
The selected users are notied via email that you are no longer sharing the
specied le with them and the shared le(s) will no longer appear in their
Home Folder.
Chapter 2 Manage experiment data
Share experiments, folders, and projects
2
14
Applied Biosystems™ Standard Curve Analysis Module

About experiment data/files
The Applied Biosystems™ Analysis Software can import and analyze experiment les
(.eds and .sds) that are generated by a variety of Thermo Fisher Scientic real-time
qPCR instruments. Every consumable run on a Thermo Fisher Scientic real-time
qPCR instrument requires the creation of one or more experiment les that store the
associated data. Each experiment le is a virtual representation of a specic
consumable (plate, array, or chip) that contains data for all aspects of the qPCR
experiment.
Experiment les contain the following information:
• Target information and arrangement on the plate
• Sample information and arrangement on the plate
• Method parameters for the run
File compatibility
The Applied Biosystems™ Software can import data the following experiment le
formats generated by Applied Biosystems™ real-time qPCR instruments:
IMPORTANT! The Applied Biosystems™ Analysis Software can import and analyze
data from unsupported versions of the instrument software; however, we cannot
guarantee the performance of the software or provide technical support for the
analyses.
Real-Time PCR System Supported software
version(s)
File
extension
Applied Biosystems™ 7900 HT Fast Real-Time PCR
System v2.4 or later
.sds
Applied Biosystems™ 7500 and 7500 Fast Real-
Time PCR System
v1.4.1 or later
v2.0.5 or later
.eds
Applied Biosystems™ StepOne™ and StepOnePlus™
Real-Time PCR System v2.0.1, v2.1, or later
Applied Biosystems™ ViiA™ 7 Real-Time PCR
System v1.1 or later
Applied Biosystems™ QuantStudio™ 12K Flex Real-
Time PCR System v1.1.1 or later
Applied Biosystems™ QuantStudio™ 3 Real-Time
PCR System
v1.0 or later
Applied Biosystems™ QuantStudio™ 5 Real-Time
PCR System
Applied Biosystems™ QuantStudio™ 6 Flex Real-
Time PCR System
v1.0 or later
Applied Biosystems™ QuantStudio™ 7 Flex Real-
Time PCR System
Chapter 2 Manage experiment data
About experiment data/files
2
Applied Biosystems™ Standard Curve Analysis Module
15

Set up the project
■Manage samples and targets ........................................... 16
■Import sample information from design les ............................. 17
■Import target information from AIF les ................................ 17
After importing one or more experiments (.eds or .sds les) into your HRM project,
use the Overview screen to set up the project.
Manage samples and targets
The Applied Biosystems™ Analysis Software populates the Overview screen with the
samples and targets present in the experiments added to the project. If necessary, you
can add, edit, or remove the samples and targets as needed before the analysis.
•Create a new sample or target:
a. From the Samples or Targets table in the Overview screen,
click Actions4Add.
b. In the New Sample/Target dialog box, enter a name for the new sample or
target (up to 256 characters), then edit the properties of the new
sample/target.
c. Click OK.
•Update an existing sample or target by editing the entry directly in the table.
Note: Alternately, select a sample or target from the table, then
select Actions4Assign/Update.
•Delete a sample or target:
a. From the Samples or Targets table in the Overview screen, select the sample
or target of interest, then click Actions4Delete.
b. In the conrmation dialog box, click OK to delete the sample or target.
3
16
Applied Biosystems™ Standard Curve Analysis Module

Import sample information from design files
This Applied Biosystems™ Analysis Software Analysis Module does not support
sample import by design le. To populate your project with samples, enter them
directly into the Samples list in the Overview screen. For more information on
entering sample information, see “Manage samples and targets“ on page 16.
Import target information from AIF files
For convenience, the Applied Biosystems™ Software can import target information
directly from assay information les (.aif), which are supplied with assays
manufactured by Thermo Fisher Scientic. AIF are tab-delimited data les provided
on a CD shipped with each assay order. The le name includes the number from the
barcode on the plate.
1. From the Targets table in the Overview screen, click Actions4Import AIF File.
2. Locate the .aif le with the target information, then click Open.
If the import is successful, the target is populated to the appropriate table. If a target
of the same target name is already present in the project, it is overwrien with the
information from the AIF.
Note: Assay/target name matching is not case sensitive.
Chapter 3 Set up the project
Import sample information from design files
3
Applied Biosystems™ Standard Curve Analysis Module
17

Edit experiment properties
■Review and edit the plate setups ....................................... 19
■Apply samples and targets ............................................ 19
■Specify and assign tasks ............................................... 20
■Specify and assign standards .......................................... 21
■Apply plate setup information using a template le ....................... 23
■Template les ........................................................ 24
After populating your project with samples, targets, and controls, use the Plate Setup
screen to make changes to the plate setups of the experiments added to your project.
The editor can be used to edit sample, target, task, and control assignments to correct
missing or incorrect seings.
4
18
Applied Biosystems™ Standard Curve Analysis Module

Review and edit the plate setups
After conguring your project with all necessary samples and targets, use the Plate
Setup screen to review the experiments for problems that can prevent the analysis of
the project. The Applied Biosystems™ Analysis Software displays plate conguration
errors that can prohibit analysis in the margin beneath each image of the related
experiment. Before you can analyze your project, you must use the Plate Setup screen
to address them.
To review the plate setup information for your project:
1. Select Plate Setup to display Plate Setup screen.
2. From the Plate Setup screen, review the experiment records for errors.
3. If errors are present, click the experiment record of interest and address the
problem that is preventing the analysis of the le.
Note: The software displays plate conguration problems that will prevent
analysis of an experiment beneath the image of the related plate.
Apply samples and targets
If the sample or target assignments of one or more of your experiments contain errors
or are missing, you can use the Applied Biosystems™ Analysis Software to correct the
problem prior to analysis.
Note: When reviewing a plate layout, click Actions4Clear Well Setup to remove the
well information (sample, task, and target assignments) from the selected wells in the
plate grid.
1. From the Plate Setup screen, select the experiment that you want to modify.
2. (Optional) From the Edit Plate screen, click View , then select Target and
Sample to color the plate setup according to the element that you intend to
modify.
3. Select the wells of the plate layout to which you want to apply the target or
sample.
Chapter 4 Edit experiment properties
Review and edit the plate setups
4
Applied Biosystems™ Standard Curve Analysis Module
19

4. When the wells are selected, click the appropriate eld to the right of the plate
grid, then select the appropriate item from the list.
Note: If you have not yet created a sample or target, enter the name in the
appropriate eld and press Enter to create the new sample or target.
5. Once you are nished making changes to the plate layout, click Analyze to
reanalyze your project.
Specify and assign tasks
If the task assignments of one or more of your experiments contain errors or are
missing, you can use the Applied Biosystems™ Analysis Software to correct the
problem prior to analysis.
Note: When reviewing a plate layout, click Actions4Clear Well Setup to remove the
well information (sample, task, and target assignments) from the selected wells in the
plate grid.
1. From the Plate Setup screen, select the experiment record that you want to
modify.
2. From the Edit Plate screen, click View , then select Task to color the plate
setup according to task assignment.
3. Select the wells of the plate layout to which you want to apply a task.
Chapter 4 Edit experiment properties
Specify and assign tasks
4
20
Applied Biosystems™ Standard Curve Analysis Module
/