Page is loading ...

Model 2800
Integrating Sound
Level Meter
and
Model OB-100
Octave Band Filter
and
Model OB-300
1/1 - 1/3 Octave Band Filter
instructions for
Note: Due to the new ATEX Directive in Europe, all references in this document to "Ex"
or "EEx" for intrinsic safety approvals should be disregarded effective 7/1/03 within the
member countries of the European Union (EU). At this time, this product is not approved
in accordance with the new ATEX Directive and is not sold for use in hazardous
atmospheres or explosive zones by customers within the EU. Outside of the EU, all
references to intrinsic safety continue without change.
59-333 Rev C
8/97
TABLE OF CONTENTS
MODEL 2800 IMPULSE INTEGRATING SOUND LEVEL METER
WITH THE OB-100/OB-300
I. INTRODUCTION TO THE MODEL 2800 ................. 1
A. Assembling the Meter ..................... 1
Microphone Handling and Storage ............... 1
II. ABOUT THE METER ......................... 2
A. The Display .......................... 2
B. Meter Controls ........................ 3
HOLD Button ......................... 3
RESET Button ........................ 3
RUN Button ......................... 3
PRINT Button ........................ 3
BATTERY Button ....................... 3
RESPONSE Switch ....................... 4
WEIGHTING Switch ...................... 4
MODE Switch ......................... 4
dB RANGE Switch ....................... 5
POWER Switch ........................ 5
C. Overload Detection ...................... 5
D. Output Jacks ......................... 6
PRINT ............................ 6
DC ............................. 6
AC ............................. 6
DATA ............................ 6
E. Internal Switches ....................... 7
Baud Rate .......................... 7
Display Time ........................ 7
F. Printout ........................... 8
III. CHECKING THE METER INTEGRITY .................. 10
A. Battery Check ......................... 10
B. Calibration .......................... 10
IV. GENERAL OPERATING CONSIDERATIONS ................ 11
A. Meter / Microphone Placement ................. 11
B. Background Noise ....................... 11
C. Wind Screen Effects ...................... 12
D. Chart Recording ........................ 13
E. Data Logging with the NL-15 .................. 14
V. TECHNICAL INFORMATION ...................... 15
A. Principles of Operation .................... 15
B. Microphone .......................... 17
C. Microphone Preamp Extension Cables .............. 17
D. Input Buffer Circuitry .................... 18
E. Weighting Characteristics ................... 18
F. Internal Electrical Noise ................... 19
G. Response Charts ........................ 20
VI. SPECIFICATIONS ......................... 23

VII. INTRODUCTION TO THE MODEL OB-100 ................ 26
VIII. ABOUT THE FILTER ........................ 26
A. Filter Controls ........................ 26
POWER Switch ........................ 26
START Buttons ........................ 26
-20 dB Button ........................ 26
TIME ............................ 26
B. Filter Connector ....................... 27
IX. GENERAL OPERATING PROCEDURE ................... 27
A. Operational Check ....................... 27
B. Taking a Measurement ..................... 28
MANUAL Filter Operation ................... 29
AUTO Filter Operation .................... 29
C. Reviewing the Data ...................... 30
X. TECHNICAL INFORMATION ...................... 30
XI. SPECIFICATIONS ......................... 31
XII. INTRODUCTION TO THE MODEL OB-300 ................ 33
XIII. ABOUT THE FILTER ........................ 33
A. Filter Controls ........................ 33
POWER Switch ........................ 33
START Buttons ........................ 33
-20 dB Button ........................ 33
MODE Switch ......................... 34
TIME ............................ 34
B. Filter Connector ....................... 34
XIV. GENERAL OPERATING PROCEDURE ................... 34
A. Operational Check ....................... 35
B. Taking a Measurement ..................... 35
MANUAL Filter Operation ................... 36
AUTO Filter Operation .................... 36
C. Reviewing the Data ...................... 37
XV. TECHNICAL INFORMATION ...................... 37
XVI. SPECIFICATIONS ......................... 38
XVII. ADDENDUM FOR THE MODEL 2800-5 ................. 40
SERVICE AND WARRANTY POLICY ...................... 41
Service Policy .......................... 41
Warranty Policy ......................... 41
1
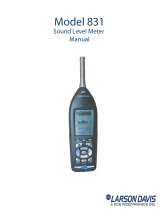
Figure 1 Preamp Assembly
I. INTRODUCTION TO THE MODEL 2800
The Quest Model 2800 functions as a Sound Level Meter, Impulse or Integrating
Sound Level Meter. In all modes, the Model 2800 delivers Type 2 accuracy for
noise measurements and statistical analysis. Applications include
laboratory, industrial, community and audiometric measurement and analysis.
The Model 2800 is a user-friendly hand held meter with an LCD display that
provides a numerical and bar graph readout. It is housed in a tough
injection molded plastic case with internal shielding. The meter is
configured and operated with easy-to-use slide switches and push buttons.
Two output jacks are provided for connecting to external peripherals such as
chart recorders, printers, or the Quest Model NL-15 Data Logger.
Plug in the Model OB-300 combination 1/3 - 1/1 Octave Filter Set and create
a 1/3 or 1/1 octave band analyzer covering 33 bands from 12.5 Hz to 20 kHz.
The addition of the Model OB-100 Octave Filter Set will create an octave band
analyzer covering 10 bands from 31.5 Hz to 16
kHz.
If sound measurements need to be made from a
distance, simply remove the
microphone/pre-amplifier and insert either an
ICM-10 (10 foot) or an ICM-50 (50 foot)
extension cable. Distances of up to 100 feet
can be accommodated by adding two ICM-50 (50
foot) extension cables in series.
With the microphone and preamplifier removed,
the meter can accept other input devices such
as the Quest Model VI-90 Vibration Integrator.
The VA-508C Vibration Assembly, combined with
the Model 2800, provides a quick and precise
method of measuring and analyzing many types of
industrial vibration.
A. Assembling the Meter
The microphone and preamplifier must be
assembled prior to making any measurements.
Microphone Handling and Storage
The microphones used with the model 1900
will provide years of reliable use, but certain
precautions should be followed with regard to
handling and storage.
1. Never remove the microphone grid.
This will expose the diaphragm,
making it susceptible to physical
damage. When removing a microphone
from the preamplifier be careful not
to unscrew only the grid.

2
2. Never touch the diaphragm.
3
3. Electret (prepolarized) microphones should never be stored at high
temperatures, as long term degradation of the polarization charge
may occur. This results in a decrease in microphone sensitivity.
4. An electret microphone should be stored in its protective box when
not in use for long periods of time.
To attach the microphone to the preamplifier, screw the microphone onto
the threaded end of the preamplifier. Attach the preamplifier to the meter
by placing the connector ends together and rotating the preamplifier until it
drops onto the meter. Finger tighten the black locking ring by screwing it
onto the meter.
II. ABOUT THE METER
A. The Display
The LCD display contains both a numeric readout and a bar indicator along
with BAT (battery), RUN, HLD (hold), and OL (overload) annunciators. The
rate at which the numeric display is updated depends upon the setting of a
switch located in the battery compartment. Either a one-second or a
one-quarter second display rate can be selected.
The bar indicator portion of the display will indicate the current SPL (Sound
Pressure Level), except when the BATTERY button is pressed. (See III. A.,
Battery Check). When using the bar indicator for SPL, the 0 to 60 range of
the bar indicator represents the selected range on the Range switch. If on
the 80 to 140 range, for example, the bar indicator represents 80 to 140 dB.
The MODE switch selects what data is to be displayed in the digital portion
of the readout (i.e. SPL, MIN, MAX etc.). Sound levels are shown to the
nearest 0.1 dB. RUN time (or OL time) is displayed in MIN:SEC if the total
time is less than 20 minutes, and in HRS:MIN if the total time is greater
than 20 minutes.

4
B. Meter Controls
HOLD Button
When the HOLD button is depressed, the current value in the numerical
portion of the display is frozen and the HLD annunciator appears in the
display. If the meter is in the RUN mode while or prior to pressing the
HOLD button, the last stored values of MIN, MAX, SEL, TIME, and LEQ that
occurred can be viewed. Simply use the MODE switch to select the value
of interest. Pressing HOLD will NOT stop an LEQ measurement
accumulation. It simply saves the current value for viewing.
HOLD is a toggle function. To exit the HOLD mode simply press HOLD
again.
RESET Button
To reset ALL data stored within the Model 2800, press the RESET button.
This will erase all stored data prior to taking new readings.
NOTE: Pressing RESET while the RESPONSE is set to PEAK only resets
PEAK. All other data remains unaffected.
RUN Button
The RUN indicator will appear in the display when the RUN button is
pressed. The meter will begin integration at this point. MAX, MIN,
SEL, TIME, and LEQ data is collected only during the RUN mode. Pressing
the RUN button again will exit the RUN mode and the instrument will
enter the PAUSE mode where MAX, MIN, SEL, TIME, and LEQ are held at
their last values. Press the RUN button again to continue updating MAX,
MIN, SEL, TIME, and LEQ. Press RESET to erase all existing data before
taking new data.
PRINT Button
If the Model 2800 is connected to a printer via the PRINT output jack,
pressing the PRINT button will send all of the current data stored in
the meter to the printer. During the printout period, the numeric
display will read 'Prn'. To stop the printout just press the print
button again. (See Figure 5, sample Printout.)
BATTERY Button
Pressing the BATTERY button will indicate relative battery strength in
the bar portion of the display. This button may be pressed at any time
without affecting the meter signal processing. (See III. A., Battery
Check for more information.)
5
RESPONSE Switch
The RESPONSE switch controls the rate at which the meter responds to
changing input signals. Most sound measurements are done with the
response set to SLOW. The FAST response is generally used when
measuring short duration noises such as moving vehicles. PEAK is only
used in the SPL mode and has no meaning when making integrated
measurements. The RESPONSE switch positions are as follows:
SLOW - 1 second time constant. (See Figure 14)
FAST - 125 millisecond time constant. (See Figure 15)
PEAK - 50 microsecond rise time constant with the peak sound
level being captured and held until the RESET button is
pressed. (See Figure 16)
NOTE: Pressing the RESET button while in the PEAK
response will not clear out the integration data.
IMPulse - 35 millisecond rise time constant with a decay rate of
2.9 dB/sec. (See Figures 17 and 18)
WEIGHTING Switch
The WEIGHTING switch controls the frequency response of the meter.
Weightings A, B, C, or LINear (flat) may be selected. (See V. E.,
Weighting Characteristics for further details.)
MODE Switch
The MODE switch selects either the sound pressure level or the
integrating function to be shown in the digital portion of the display.
(MIN, MAX, SEL, TIME, and LEQ will only have values if the meter has
been in the RUN mode accumulating data.)
SPL - Sound Pressure Level will be displayed. (SPL is also
always shown in the display bar indicator.)
MAX - The Maximum Sound Pressure Level obtained in the RUN mode
is shown in the numeric display.
MIN - The Minimum Sound Pressure Level obtained while in the
RUN mode is shown in the numeric display.
SEL - The Sound Exposure Level, or sound energy averaged over
one second that is equivalent to the energy accumulated
while in the RUN mode, is displayed.

6
TIME - The total RUN time will be displayed. The format is
MIN:SEC for any time less than 20 minutes and HRS:MIN for
any time greater than 20 minutes.
LEQ - The average integrated sound level accumulated while in
the RUN mode is displayed.
dB RANGE Switch
The displayed range of the Model 2800 is 60 dB and is switchable between
the following: 20-80 dB, 40-100 dB, 60-120 dB, or 80-140 dB.
POWER Switch
When turned ON, the meter begins with all data reset to zero and is in
the pause mode (non-RUN mode). By switching the unit OFF, all
accumulated data is cleared from the memory.
C. Overload Detection
In the SPL mode, the overload indicator (OL) is displayed whenever the
incoming signal saturates (overloads) the circuitry. It appears as OL in the
upper right-hand corner of the display. If the OL indicator is on, increase
the dB RANGE switch until the OL condition is removed causing OL to
disappear.
The Model 2800 also stores the length of time that the OL condition existed
during the RUN mode. If an OL condition occurs while in the RUN mode, the OL
indicator will come on and remain on until RESET is pressed. The time
duration of the overload condition can be viewed by sliding the MODE switch
to TIME and then holding the BATTERY button in. The overload time will also
be printed on the hard copy printout.
Note: OL can be reset for use in the SPL mode without losing accumulated
data. Place the meter into PAUSE, slide the RESPONSE switch to
PEAK and then press the RESET button. Then return the RESPONSE
switch back to the desired position. OL is now reset for normal
use in the SPL mode only. It still remains latched when switched
back to either the SEL, TIME, or LEQ mode.
7
Figure 2. Output Jack
Connections
D. Output Jacks
All output jacks use a
3.5 mm stereo plug.
(See Figure 2, Output
Jack Connections.)
The following describes
each output function:
PRINT - Pressing the PRINT button causes serial ASCII data to be
transmitted from the print jack at appropriate RS-232 levels. This
data may be sent to a serial printer or a computer. The baud rate
is determined by two switches located in the battery compartment.
(See Figure 4, Battery Compartment Internal Switches, for switch
settings).
DC - The Sound Pressure Level (SPL) over the 60 dB range selected is
linearly represented by a 0 to 1 volt DC output. Zero volts is
equal to the bottom of the range and 1 volt is equal to full scale.
This output is primarily provided for connecting to a 0 to 1 volt
input chart recorder. (See IV. D., Chart Recording and Figure 6,
Chart Recording of SPL)
AC - This jack furnishes an amplified SPL, (either weighted or
unweighted), depending on the WEIGHTING switch setting. The full
span of 60 dB is represented between 3.16
millivolts and 3.16 volts RMS.
DATA - When the Model 2800 is in the RUN mode, an SPL reading will be
serially transmitted through the DATA jack at a rate of 16 times
per second. To make use of this function, the meter range switch
must be set in one of its two highest positions.

8
Figure 3. Data Jack Format
The data is an 8-bit signal proportional to the integrated sound
level for the last 1/16 second. The signal is normally at +6.5
volts. If the meter is in the RUN mode, data is sent as in Figure
3. Signal description is as follows:
The signal goes to -6.5 volts every 0.55 msec.
If the bit is a 0 it will return to plus after 0.1 msec.
If the bit is a 1 it will return plus after 0.45 msec.
The signal is sent least significant bit first.
The resolution is 3/8 dB.
All 0's = 30 dB if the meter is set to the 60 - 120 dB range.
50 dB if the meter is set to the 80 - 140 dB range.
All 1's = 30 dB + 95.6 dB when set to the 60 - 120 dB range.
50 dB + 95.6 dB when set to the 80 - 140 dB range.
The example in Figure 3 is 10101100 binary = 172 decimal. The level is (172
x 3/8) + 50 = 114.5 dB when on the 80 - 140 dB range.
E.
Internal
Switches
There is
an
internal
switch
located in
the
battery
compartmen
t that is accessible to the user. (Refer to Figure 4.)
Baud Rate - Actuators 1 and 2 of the dip switch, located through the
hole in the lower left, control the baud rate at which
the meter transmits data to a printer. Baud rates
available are 300, 600, 1200, and 2400.
Display Time - The recessed dip switch controls the rate at which the
display updates. The options are 1.0 second or 0.25
second.
9
Figure 4. Battery Compartment Internal Switches.
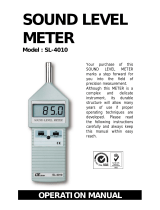
F.
Printout
The Sound
Level
Meter
produces a
hard-copy
of the
informatio
n
accumulate
d during
the total
RUN MODE
period.
When used
with the
filter set
OFF, this
informatio
n includes :
1. Meter WEIGHTING and RESPONSE settings.
2. LEQ, MAX, MIN, and SEL Levels.
3. RUN TIME and OL TIME.
4. Table of EXCEEDANCE LEVELS (dB)*
*EXCEEDANCE LEVELS: Tabulated from 1 to 99, the sound level that was exceeded
for that percentage of run time. (See Figure 5, Sample
Printout.)
If an OB-100 or OB-300 is actively used as part of the sound measuring
system, all of the information above the OCTAVE FILTER SET header will
pertain only to the last Octave Band measurement. This allows the user to
perform, for example, a 500 Hz Octave Band Measurement on "A" Weighting,
"SLOW" Response, and obtain a printout that includes proper switch settings
and exceedance levels for that frequency.
NOTE: For forty column printers, the Sound Level Meter allows for a
compressed print mode. Pressing the HOLD button before printing
causes the meter to send a printer control code [ LPRINT CHR$ (15)
] that produces a compressed print form for many printers. Consult
your printer manual for details.

10
QUEST MODEL 2800 IMPULSE INTEGRATING SOUND LEVEL METER
DATE:_______ SERIAL NO. _______ CALIBRATED: __________
LINEAR WEIGHTING / SLOW RESPONSE
LEQ(dB) MAX(dB) MIN(dB) SEL(dB) RUN-TIME OL-TIME
100.8 107.2 49.4 116.3 :00:36
EXCEEDANCE LEVELS(dB)
0 1 2 3 4 5 6 7 8 9
L00 107 107 107 107 107 107 107 107 107 107
L10 107 107 107 107 107 107 107 107 107 107
L20 107 106 106 106 106 105 104 103 101 100
L30 98 97 95 94 93 92 91 90 89 89
L40 89 89 88 88 88 88 88 88 88 88
L50 88 88 88 88 88 88 88 88 87 87
L60 87 87 87 87 87 87 86 84 83 81
L70 80 78 77 75 74 73 71 70 68 67
L80 65 64 63 62 61 59 58 57 56 56
L90 55 54 53 53 52 52 51 51 50 50
MODEL OB-300 1/1-1/3 OCTAVE FILTER SET - SERIAL NO. ______
FREQ(Hz) LEQ(dB) MAX(dB) MIN(dB) SEL(dB) RUN-TIME OL-TIME
12.5 70.1 70.8 70.1 77.8 :00:05
16 88.0 88.8 86.9 92.3 :00:02
20 106.2 107.2 104.6 111.3 :00:03
25 105.1 108.3 93.7 117.1 :00:15 :00:05
31.5 92.3 97.4 84.7 97.3 :00:03
40 76.6 80.9 70.4 81.0 :00:02
50 66.2 75.7 53.6 76.8 :00:11
63 53.3 56.2 51.7 59.2 :00:03
80 65.9 71.6 60.3 72.1 :00:04
100 70.0 70.8 68.9 75.8 :00:03
125 88.2 89.2 86.9 92.7 :00:02
160 115.3 120.3 104.6 127.5 :00:16
200 111.2 116.2 106.4 116.5 :00:03
250 95.2 103.1 86.2 103.5 :00:06
315 74.6 83.2 61.4 85.9 :00:13
400 70.9 71.9 69.7 76.0 :00:03
500 88.8 89.9 87.7 92.7 :00:02
630 107.2 108.3 105.7 113.1 :00:03
800 98.2 103.8 91.8 104.3 :00:04
1,000 77.9 88.4 71.2 89.2 :00:13
1,250 87.8 88.8 86.6 92.3 :00:02
1,600 113.0 120.3 64.1 126.6 :00:23 :00:04
2,000 109.8 116.2 100.8 118.2 :00:07 :00:06
2,500 91.3 96.7 82.8 96.9 :00:03
3,150 72.9 79.4 66.3 81.3 :00:06
4,000 90.1 91.1 89.2 92.1 :00:01
5,000 106.0 106.8 104.6 110.3 :00:02
6,300 99.6 102.7 95.9 102.1 :00:01
8,000 80.8 84.3 77.2 83.6 :00:01
10,000 67.5 74.2 61.4 75.0 :00:05
12,500 71.2 71.9 70.8 75.5 :00:02
16,000 90.3 91.1 88.8 94.6 :00:02
20,000 100.8 107.2 49.4 116.3 :00:36
Figure 5. Sample Printout
11
III. CHECKING THE METER INTEGRITY
A. Battery Check
At any time (except during PRINT), the BATTERY push button can be pressed to
get an indication of battery strength. The weaker of the two 9 volt
batteries is shown on the bar indicator of the Model 2800's display. Good
batteries will be indicated with the bar extending well beyond the indicating
arrow (5 on the 0-60 scale). If the bar falls below the indicating arrow,
then BOTH ALKALINE batteries must be replaced. Because erroneous readings
will occur if the battery check registers below the indicating arrow, it is
good practice to perform a battery check before using the 2800. Collected
data and output port signals are NOT affected by performing a battery check.
B. Calibration
To check the calibration of the Model 2800, perform the following procedure
using a Quest Calibrator.
1. Perform a battery check.
2. Turn the Calibrator ON to produce the level specified on the label
at 1 kHz.
3. An adapter is needed to mate the microphone size to the calibrator
coupler. Insert it fully into the calibrator.
4. Place the Calibrator with adapter fully onto the microphone.
5. Set the Model 2800 to LIN, SLOW or FAST, the SPL mode, and the 60-
120 range.
6. Use a small screwdriver to adjust the calibration potentiometer,
located through the small hole on the left side of the meter, until
the display matches the calibration level.
NOTE: Most Calibrators (including Quest Calibrators) are affected by
changes in altitude and barometric pressure. The rated SPL is
set at standard barometric pressure at sea level (760 mm Hg).
Consult the Calibrator Manual for correction factors at
different altitudes and how to apply them.

12
IV. GENERAL OPERATING CONSIDERATIONS
Before taking measurements with the Model 2800, there is a series of quick
checks and considerations that should be performed or noted. After switching
the unit ON, the batteries should be checked (and replaced if needed).
Although the Model 2800 will maintain accurate calibration over a long period
of time, the calibration should be checked and the meter slightly adjusted,
if necessary, before each use.
Set the RESPONSE, WEIGHTING, MODE, and dB RANGE switches as needed. Hold,
set, or tripod mount the meter in the desired location. If performing
integrating measurements, press the RUN button making sure "RUN" is indicated
in the display. If the meter is in the RUN mode and you want to change a
switch setting (particularly the dB RANGE switch), it is a good idea to stop
accumulating data by entering the pause mode. To do this depress the RUN
button again and "RUN" will disappear from the display. Change the desired
switches, and then depress RUN again to continue accumulating data.
It is always a good idea to document all measurement conditions and meter
settings for possible future needs. If a printer is used, the settings will
all appear on the printout.
A. Meter / Microphone Placement
Whenever possible, the meter should be tripod-mounted in a relatively open
area to minimize reflections from the body or other large reflective
structures. Avoid placement against a wall or in a corner. If reflections
are of concern, a microphone extension cable may be used for better
microphone placement.
The QE7052 microphone cartridge used on the Model 2800 is a free-field
microphone. Point it directly at the noise source ( 0 degrees ).
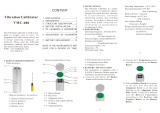
B. Background Noise
Background noise can cause considerable error in measurement when its
intensity is close to that of a particular noise source of interest. When it
is not possible to eliminate or reduce the background noise, use the curve
shown in Figure 6 to correct for the effect of the background noise on the
measurement.
13
Figure 6 Effect of Background on Measurement
Figure 7. Acoustic Effect of WS-7 Windscreen
C. Wind
Screen
Effects
To prevent
erroneous
measuremen
t of sound
levels
caused by
wind
blowing
across the
microphone
, the use
of a
windscreen
is
recommende
d. The
wind
screen
will
reduce
wind
effects and will also help protect the microphone under dusty, oily, or humid
conditions. Acoustic attenuation effects of the (WS-7) windscreen is shown in
Figure 7.

14
D. Chart Recording
The Model 2800 has a DC output that is linearly related to the 60 dB LCD
analog bar movement as follows:
Analog Bar (dB) 0 10 20 30 40 50 60
DC Output (V) .00 .17 .33 .50 .67 .83 1.00
This output, capable of driving up to 100 feet of shielded or twisted pair
cable, is intended for use with a 0 to 1 volt DC input chart recorder that
has an input impedance greater than 20K ohms.
Refer to Figure 8, Chart Recording of SPL. Connect the Model 2800 to the
chart recorder input with proper polarity such that the pen is on the proper
side of the chart paper with respect to time and that the pen moves in the
proper direction with increasing dB level. Use a 1 kHz acoustic calibrator
to calibrate the chart recorder as follows:
1. Turn the meter to ON. Set the meter RESPONSE to FAST, WEIGHTING to
A, MODE to SPL, and dB RANGE to 80-140.
NOTE: An adapter is needed to mate the microphone size to the
calibrator coupler. Insert it fully into the calibrator.
2. Place the calibrator with adapter fully onto the microphone - do
not turn the calibrator on yet. The meter shall read less than 80
dB which generates .00 volts DC out to the chart recorder. Adjust
the zero control on the recorder so that the pen represents a
relative dB of 0.
3. Turn the Calibrator ON to produce the level specified on the label
at 1 kHz. Set the 2800 dB RANGE for the highest bar graph level
without causing and overload. The recorder pen should rise to the
correct RELATIVE dB. A small adjustment may be needed. Use the
zero adjust to do this.
4. Be sure to document all chart recorder settings and meter settings
when taking measurements.
Note that any range position can be set on the Model 2800 and the 60 dB span
of the meter range will always correspond to the full 60 dB range on the
chart recorder.
Use QUEST CHART PAPER # 58-653.
15
Figure 8. Chart Recording of SPL
E. Data
Logging
with the
NL-15
The Quest
Model
NL-15
Noise Data
Logger can
be used
with the
Quest
Model
2800.
When used
with the
meter, the
following
conditions
must be
observed:
1. Set the RESPONSE switch on the meter to FAST. (The NL-15 will
convert FAST to SLOW as required.)
2. Set the dB RANGE switch to either 80 - 140 dB or 60 - 120 dB. (If
used on other ranges, all data will be in error by either 20 dB or
40 dB.)
3. Set the WEIGHTING switch on the meter to either A or C. If other
weightings are used, the weighting data on the printout will be in
error. The rest of the readings will be correct.
In addition, the internal switches in the NL-15 must be set to agree with the
sound level meter settings.
1. If the meter is to be used on the 80 - 140 dB range, set NL-15
internal switch 1, position 4 to OFF. If the meter is to be used
on the 60 - 120 dB range, set NL-15 internal switch 1, position 4
to ON.
2. If the meter is set to A-weighting, set NL-15 internal Switch 1,
position 3, to OFF.
If the meter is set to C-weighting, set NL-15 internal switch 1,
position 3, to ON.

16
The remainder of the internal switch settings are set the same as they would
be for a Micro-15. Consult the NL-15 manual for complete instructions.
The NL-15 will accumulate data when it is connected to the meter DATA OUTPUT
jack if the following two conditions are met:
1. The LED on the NL-15 is blinking.
2. The RUN annunciator on the meter display is on.
To operate:
1. Connect the two units. Note: An adapter cable from Quest is needed
to adapt the NL-15 micro plug to the 3.5 mm DATA jack on the meter.
(Quest Part Number 59-748, 1800/2800 to NL-15 Cable)
2. Turn ON the NL-15 and RESET it.
3. Press the RUN button on the meter.
4. After sufficient data is accumulated, press the RUN button on the
meter to enter the Pause mode.
5. Connect the NL-15 to a printer and print the data. The setting of
the remainder of the switches and push buttons will not affect the
data stored in the NL-15. MODE, HOLD, PRINT, and BATTERY will not
change the data stored. If RUN (on the meter) is toggled off, the
NL-15 will accumulate null data. If toggled back on, it will
accumulate additional data.
If an octave filter is connected to the meter when used with the NL-15, the
NL-15 will accumulate the filtered data. To obtain data on multiple filter
bands, print out the data after each filter frequency and then reset the
NL-15. (The weighting in the summary will, of course, be wrong since the
filter is now in series with either A, B, C, or LIN.)
V. TECHNICAL INFORMATION
A. Principles of Operation
The Quest Model 2800 utilizes low noise, low power analog and digital
integrated circuitry to ensure long battery life, maximum stability, and
superior reliability over a wide range of environmental conditions. Figure
9 is a block diagram of the Model 2800's internal circuit operations.
17
Figure 9. Block Diagram of the Model 2800

18
Figure 10. Typical Frequency Response for the Model QE7052
.5 Inch Microphone
B. Microphone
The Model 2800 is designed to accept a prepolarized (electret) microphone
Model QE7052 exclusively.
The microphone screws directly onto the preamp which, in turn, connects
directly to the meter. The preamp converts the high output impedance of the
microphone into a low output impedance. This allows the microphone to drive
up to 100 feet of cable for remote operation.
A typical response curve for the .5 inch microphone is shown in Figure 10.
C.
Microphone
Preamp
Extension
Cables
The
microphone
preamp
converts
the high
output
impedance
of the
microphone
to a low
output
impedance,
thus
allowing
the insertion of an extension cable of up to 100 feet in length between the
preamp and meter. Quest Electronics offers the following lengths of remote
cables:
# 59-733 ICM-10 10 Ft. Remote Cable.
# 59-734 ICM-50 50 Ft. Remote Cable.
The preamp is removable by turning the black plastic collar below the preamp
housing counter-clockwise when viewed from the top of the meter.
19
Figure 11 Meter Electrical Input (Direct)
D. Input Buffer Circuitry
The high impedance input circuitry (1 Megohm in series with 0.1 MFD) will
accept up to a 10 volt RMS signal. With the microphone and preamp removed,
other transducer devices (such as the Quest Model VI-90 Vibration Integrator)
can be interfaced to give a dB readout on the meter.
When interfacing other input devices to the Model 2800, Use pins 1 and 3 for
the AC signal input. NEVER connect to pins 2 and 4.
To remove the preamp, keep the preamp housing steady while unscrewing the
black plastic collar below the preamp housing. Turn in a counter-clockwise
direction when viewed from the meter top.
To input an AC voltage electrically requires a special connector - Quest part
number 14-739. Figure 11 describes the function of each of the pins within
the meter input connector.
E.
Weighting
Characteri
stics
The
weighting
characteri
stics
(frequency
response)
for A, B,
C, and
LINear are
shown in
Figure 12.
The "A"
weighting
response emulates the response of the human ear and is used for most
industrial and community noise measurements. "B" weighting is seldom used.
"C" weighting is often used for measuring noise reduction in hearing
protectors and for other scientific purposes. The "LINear" weighting has a
flat frequency response over the range of human hearing and is useful in many
applications such as audiometric analysis. It is also used when taking
octave and 1/3 octave measurements.

20
Figure 12 Weighting Characteristics
F.
Internal
Electrical
Noise
The
maximum
measurable
SPL of the
2800 Meter
is 140 dB.
When used
with
either the
OB-100 or
OB-300
filter
set, the
specific
minimum measurable SPL's in each octave band are as shown in Figure 13. The
inherent noise level is typically at least 5 dB below the RMS values shown in
the table.
Octave
Band
Weighting Scale
ABCLIN
All Pass
31.5 and 63
125 and 250
500 and 1K
2K and 4K
8K and 16K
35
10
21
24
27
29
37
25
27
25
25
27
40
35
31
25
25
27
48
37
31
25
25
30
Figure 13. Minimum measurable SPL's for the Model 2800 with the
QE7052 Microphone
21
Figure 14. SLOW Response
G. Response Charts
Figures 14 through 18 are plots for each of the response settings of the
meter. They show how the meter responds to a given sinewave input of varied
pulse duration.
SLOW RESPONSE (1000 msec time constant) Figure 14.
FAST RESPONSE (125 msec time constant) Figure 15.
PEAK RESPONSE (50 microsecond time constant) Figure 16.
IMPULSE RESPONSE (35 msec rise time constant with a decay rate of
2.9 dB/sec) Figure 17 and Figure 18.

22
Figure 15 FAST Response
Figure 16
PEAK Response
Figure 17 IMPULSE Response
23
Figure 18 IMPULSE Response to Repeated Impulses

24
VI. SPECIFICATIONS
Standards: Meets or exceeds ANSI S1.4-1983, Type 2 and relevant sections of
IEC 651-1979, Type 2(I) and IEC 804-1985.
Display: 3 1/2 Digit Liquid Crystal Display with an additional
Quasi-Analogue 60 dB indicator in 2 dB increments. Level display indicates
to 0.1 dB resolution. Time display indicates either Min:Sec or Hr:Min.
Annunciators are included for Battery Check, Hold, and Overload Indication.
Printout: When used with a printer, a one page printout is produced. It
consists of the following: Heading; WEIGHTING and RESPONSE settings; LEQ,
MAX, MIN, and SEL levels; RUN TIME and OL TIME ; EXCEEDANCE LEVELS (dB) with
1 dB resolution; and Filter Data for each frequency (LEQ, MAX, MIN, and SEL)
along with the RUN TIME and OL TIME for each frequency.
Modes of Operation: Sound Pressure Level (SPL), Maximum Level (MAX), Minimum
Level (MIN), Sound Exposure Level (SEL), and Equivalent Level (LEQ). Peak
Level (PEAK) and Impulse Level (IMP) can also be measured.
Minimum Measurement: Meter only; With Model QE7052 Microphone -- 35 dBA.
Using Linear Weighting with an Octave Filter Set; See Figure 13. The minimum
measurement varies depending on the filter frequency selected.
Maximum Measurement: With Model QE7052 Microphone -- 120 dB with 20 dB Crest
Factor. (140 dB if measuring a sinusoidal signal.) Overload indication will
occur if upper range is exceeded.
Frequency Weighting Networks: A, B, C, and Linear. When using a filter set,
any one of the weightings may be selected.
Meter Response: Slow, Fast, Impulse, and Peak. (The Peak onset time
constant is less than 50 microseconds). Peak measurements may be made in
either A, B, C, or Linear Weighting.
Microphone: Model QE7052, Removable .5-inch prepolarized condenser
(electret) microphone.
Preamp: Removable; The input impedance is greater than 1G ohm in parallel
with 35 pF. The preamp will drive up to 100 feet of cable.
Meter Input: The input impedance is 1 Megohm in series with 0.1 MFD. The
maximum sinusoidal input voltage is 10V RMS.
AC Output: 3.16 V RMS at full scale (60 dB). (3.8 V RMS maximum) The output
impedance is 3.2K ohms. Connected equipment should be at least 10K ohms.
The output can be shorted without damaging the meter or changing the meter
reading.
25
DC Output: 0 to 1.00V DC; 60 dB span. Each 0.167V change equals 10 dB.
Connected equipment should be at least 10K ohms. The output can be shorted
without damaging the meter or changing the meter reading.
Print Output: Serial output to printers or computers using RS-232 voltage
levels. Selectable baud rates of 300, 600, 1200, or 2400. ASCII character
format.
Data Output: Output transmission of real-time digital data occurs at a rate
of 16 times per second using RS-232 voltage levels.
Frequency Range: 4 Hz (-3dB) to 50 kHz (-3dB) on linear weighting, meter
only. (Subject to microphone limitations.)
Reference Range: 60 to 120 dB Range setting
Reference SPL: 94 dB
Reference Frequency: 1 kHz
Reference Direction: 0 Degree when using the Model QE7052 Microphone (Free
Field). Sound is arriving from directly in front of the microphone
diaphragm. (A Normal Line extending from the center of the microphone
diaphragm.)
Detector: True RMS
Detector Pulse Range: 63 dB
Detector Measuring Range: From 0 dB to 40 dB on the painted scale (when
measuring a signal with a 20 dB Crest Factor). The extra 20 dB (40 to 60) on
top of the measuring range produces the 20 dB Crest Factor capability .
Primary Indicator Range / Linearity Range: 60 dB (The range as indicated by
both the dB RANGE switch and the painted 60 dB scale.) Tested with a
sinusoidal signal input.
Level Linearity: Inside the Primary Indicator Range. It is tested on the
Reference Range (60 to 120 dB) with a sinusoidal input signal. Tolerance is
+/- 1.0 dB referenced to 94 dB.
Overload Indication: The display annunciator (OL) indicates overload on the
LCD.
Attenuator Accuracy: Referenced from the Reference Range and the Reference
SPL (+34 dB on the painted meter scale). Within 0.7 dB from 31.5 Hz to 8
kHz.
Warm-up Time: 30 seconds.

26
Integration Time (Settling Time): 1 minute when measuring a short impulse.
5 seconds when integrating a constant input signal.
Accuracy: Within 0.7 dB at 25
o
C; Within 1.0 dB over the temperature range of
-10
o
C to +50
o
C.
Temperature Range: Operation Temperature Range: -10
o
C to +50
o
C. Accuracy
over the Operation Temperature is within +/- 0.5 dB. Storage Temperature
Range (less batteries): -20
o
C to +60
o
C
Do not exceed the Storage Temperature Range because possible damage to the
unit may result.
Operating Humidity: Over a range of 30 to 90% relative humidity, the
accuracy is within +/- 0.5 dB. Do not exceed 95% relative humidity because
possible damage to the unit may result.
Effect of Magnetic Fields: A magnetic field of 1 Oersted (80A/m) at 60Hz
produces a maximum reading of 40 dB on Linear Weighting.
Effect of Electrostatic Fields: Negligible.
Batteries: Two 9-volt alkaline batteries (NEDA 1604A) will provide
approximately 20 hours of continuous operation. (10 hours with optional
filter set.)
Tripod Mount: A threaded insert on back of the meter accepts a standard
1/4-20 tripod mounting screw.
Size: 3.3 x 8.2 x 1.8 inches (84 x 208 x 47mm) not including the height of
the preamp.
Weight: 24 oz. (680g) including the preamp and batteries.
27
VII. INTRODUCTION TO THE MODEL OB-100
The Quest Model OB-100 Octave Filter is a plug-in module containing a
selectable set of filters. The OB-100 meets the most stringent requirements
of ANSI S1.11-1986 and IEC R225-1966 for octave band filters. The unit
contains ten selectable filter ranges from 31.5 Hz to 16 kHz center
frequencies with full octave band width.
Primary uses include frequency analysis for product noise emission, material
acoustics, community noise, audiometer calibration and analysis of
audiometric rooms. Active filters are employed throughout the Model OB-100,
thus permitting the unit to have both high accuracy and compact size.
VIII. ABOUT THE FILTER
A. Filter Controls
POWER Switch
A three position slide switch that does the following:
OFF -- Disconnects the filter circuitry from the attached sound
level meter. With this switch in the off position, the OB-100 does
not use power from the meter batteries.
MANUAL -- Filter frequency selection is performed with two push
buttons (START Buttons).
AUTO -- Unit automatically cycles through the desired filter
frequencies while storing sample information for each frequency
during the RUN mode.
START Buttons
Allow the user to cycle through the different bandpass filters. The two
buttons allow manual frequency control (in MANUAL Mode) or frequency
direction control (in AUTO Mode).
-20 dB Button
When this button is depressed, the output of the filter is amplified by
exactly 10 times (20 dB) and then fed back to the sound level meter.
Therefore, 20 dB has to be subtracted from the meter reading when using
this button.
TIME
A screwdriver adjustment to control the automatic cycle time of each
filter frequency from approximately 5 to 30 seconds.

28
Figure 19 OB-100 External Filter Connector
(Located on Meter Bottom)
B. Filter Connector
The 30 pin connector on the top of the filter is used for connecting the
filter to the sound level meter. Figure 19 shows the pinout for the filter
connector.
IX.
GENERAL
OPERATING
PROCEDURE
The Model
2800-100
Octave
Band
Analyzer
is made up
of the
Model 2800
Impulse
Integratin
g Sound
Level
Meter and
the OB-100
Octave
Filter
Set. The
two units
are
connected
together with the long captive screw provided with the filter box. The
General Operating Considerations for the Model 2800 (Section IV) are
basically the same when using the Model OB-100 with the meter.
A. Operational Check
The Model 2800 should be calibrated as outlined in the meter section of the
manual (Section III, B, Calibration) while the OB-100 is OFF. The OB-100 has
a fixed input to output voltage ratio of approximately 1 (0 dB) at each
center frequency and requires no adjustment. After the meter is calibrated,
check the filter for proper operation as follows:
29
1. Read the calibrator 1 kHz output level. Set the meter dB RANGE
switch so that the calibrator level will indicate within the upper
20 dB of the meter display. Set the RESPONSE switch to FAST,
WEIGHTING switch to LIN and MODE switch to SPL. Turn the POWER
switch to ON.
2. Set the OB-100 POWER switch to MANUAL and press the RUN button to
place the meter into the RUN mode. Then use the two direction
buttons to select the 1 kHz filter.
3. Place the calibrator and adapter onto the microphone. Turn the
calibrator ON. A meter reading that is very close to the level
listed on the calibrator should result. An error of +/- 0.5 dB is
acceptable. This is due to the center frequency filter tolerance
of +/- 0.5 dB maximum.
4. Change the OB-100 filter frequency first to 500 and read the
display. Then change to 2k and read the display. At both
frequencies the readings should be 19 to 23 dB less than the 1 kHz
calibrator level.
5. Change the OB-100 filter frequency to 1k and the meter dB RANGE so
that the meter reads 20 to 40 dB less than full scale. Press and
hold the -20 dB button on the OB-100. The meter reading shall rise
approximately 20 dB to verify that the -20 dB button functions.
6. Remove the calibrator. The analyzer is now ready to use.
B. Taking a Measurement
1. Turn the meter POWER switch ON. The meter will come on in the
Pause mode. Perform a BATTERY test to verify that the analyzer has
sufficient battery power. Replace the batteries if the bar
indicator falls below the indicating arrow (located at 5 on the 0
- 60 scale).
2. Set the dB RANGE switch to 80 - 140 dB. Set the RESPONSE switch to
FAST, WEIGHTING switch to LIN (see note below), and the MODE switch
to SPL.
NOTE: Note that the filter response can be in series with either A,
B, C, or LIN. This is the operator's choice. However, LIN is
generally used when taking octave band measurements.
3. Turn the OB-100 POWER switch to MANUAL to activate the filter. "--
-" will appear in the display with the meter in the Pause mode.

30
4. Select the desired WEIGHTING and RESPONSE. Then change the dB
RANGE switch down in 20 dB steps until the OL indicator flashes or
stays on. Then go back up 20 dB so that the OL indicator stays
off. This ensures that the AC input to the filter is at its
maximum voltage without clipping (overloading).
MANUAL Filter Operation
Place the meter into the Pause mode using the RUN/Pause button. Press
RESET to clear all internal memory. Select the first frequency of
interest. Then enter the RUN mode for the required amount of time
necessary to obtain a valid sample. Then enter the Pause mode, change
to the next frequency of interest and enter RUN again, etc. Repeat this
process for all frequencies of interest.
AUTO Filter Operation
Place the meter into the Pause mode using the RUN/Pause button. Press
RESET to clear all internal memory. Select the first frequency of
interest. (Be sure that the TIME adjustment is set to the desired
filter cycle time.)
Slide the filter POWER switch to AUTO. To start the sampling sequence,
place the meter into the RUN mode and immediately press the proper
direction button. (The UP ARROW button causes the frequency to cycle to
the next higher frequency, the DOWN ARROW button causes the frequency to
cycle to the next lower frequency.)
When the last frequency of interest has completed its cycle time, slide
the filter POWER switch to MANUAL and immediately place the meter into
the Pause mode.
NOTE: If it is necessary to record all 10 frequency bands, exit the
AUTO mode while in the last frequency band. Use the MANUAL
Filter Operation to obtain the last frequency. Otherwise, the
first frequency will be written over.
31
C. Reviewing the Data
To review the data, the meter must be in the Pause mode. Use the Up/Down
buttons on the filter to review the frequencies that were measured. Each
frequency has the following information in memory: SPL, MAX, MIN, SEL, TIME
and LEQ. If an overload occurred during any frequency band measurements, the
OL indicator will appear in the display. OL time can then be recalled by
first placing the mode switch into the TIME mode and then holding the BATTERY
button down.
NOTE: Any frequencies that were not measured will appear as "---" in
the display when the MODE switch selects either SPL, MAX, MIN,
SEL and LEQ. Both TIME and OL TIME will appear as "0:00"
since no run time has elapsed.
X. TECHNICAL INFORMATION
The OB-100 conforms to ANSI S1.11-1986, Order 3, Type 2, Sub-type C and IEC
R225-1966. The normalized passband characteristic of a typical octave filter
response is depicted in Figure 20.
The OB-100 filter is flat within 0.5 dB in the passband, with the 3 dB down
points at approximately .707 fc and 1.414 fc where fc is the center frequency
of the band chosen. The fc/2 and 2fc frequencies are down by approximately
21 dB with the decade points (fc/10 and 10fc) down by greater than 70 dB.
The block diagram of the OB-100 illustrated in Figure 21 traces the signal
input from the Model 2800 through the filters and back to the sound level
meter.

32
Figure 20. Typical OB-100 Filter Response
XI.
SPECIFICAT
IONS
Stand
ards:
ANSI
S1.11
-1986
,
Order
3,
Type
2,
Sub-t
ype C
and
IEC
R225-
1966.
Center Frequencies: 10 frequencies from 31.5 Hz to 16 kHz.
Frequency Selection: Full manual control or automatic sequential
stepping through each frequency.
Power Source: Sound Level Meter.
Size: 3.3 x 2.8 x 1.8 inches (84 x 71 x 47mm)
Weight: 6 ounces (170 grams)
33
Figure 21. Block Diagram Model OB-100 Octave Filter

34
XII. INTRODUCTION TO THE MODEL OB-300
The Quest Model OB-300 1/3 - 1/1 Octave Filter is a plug-in module containing
a selectable set of filters. The OB-300 meets the most stringent
requirements of ANSI S1.11-1986 and IEC R225-1966 for octave and third octave
band filters. The unit contains 33 selectable filter frequencies from 12.5
Hz to 20 kHz when in the 1/3 mode and 11 selectable filter frequencies from
16 Hz to 16 kHz when in the 1/1 mode. It may be operated in either the
manual or automatic mode.
Primary uses include frequency analysis for product noise emission, material
acoustics, community noise, audiometer calibration and analysis of
audiometric rooms. Active filters are employed throughout the Model OB-300,
thus permitting the unit to have both high accuracy and compact size.
XIII. ABOUT THE FILTER
A. Filter Controls
POWER Switch
A three position slide switch that does the following:
OFF -- Disconnects the filter circuitry from the attached sound
level meter. With this switch in the off position, the OB-300 does
not use any power from the meter batteries.
MANUAL -- Filter frequency selection is performed with two push
buttons (START Buttons).
AUTO -- Unit automatically cycles through the desired filter
frequencies storing sample information for each frequency during
the RUN mode.
START Buttons
Allow the user to cycle through the different bandpass filters. The two
buttons allow manual frequency control (in the MANUAL Mode) or frequency
directional control (in the AUTO Mode).
-20 dB Button
When this button is depressed, the output of the filter is amplified by
exactly 10 times (20 dB) and then fed back to the sound level meter.
Therefore, 20 dB has to be subtracted from the meter reading when using
this button.
35
Figure 22. OB-300 External Filter Connector (Located on Top of
Filter)
MODE Switch
Selects either the 1/3 octave filter set (33 frequencies) or the 1/1
octave filter set (11 frequencies).
TIME
A screwdriver adjustment to control the automatic cycle time of each
filter frequency from approximately 5 to 30 seconds.
B. Filter Connector
The 30 pin connector on the top of the filter is used for connecting the
filter to the sound level meter. Figure 22 shows the pinout for the filter
connector.
XIV.
GENERAL
OPERATING
PROCEDURE
The Model
2800-300
Octave
Band
Analyzer
is made up
of the
Model 2800
Impulse
Integratin
g Sound
Level
Meter and
the OB-300
1/3 - 1/1
Octave
Filter
Set. The
two units
are
connected together with the long captive screw provided with the filter. The
General Operating Considerations for the Model 2800 are basically the same
when using the Model OB-300 with the meter.

36
A. Operational Check
The Model 2800 should be calibrated as outlined in Section III of the meter
section (Checking the Meter Integrity, B. Calibration) while the OB-300 is
OFF. The OB-300 has a fixed input to output voltage ratio of approximately
1 (0 dB) at each center frequency and requires no adjustment. After the
meter is calibrated, check the filter for proper operation as follows:
1. Read the calibrator 1 kHz output level. Set the meter dB RANGE
switch so that the calibrator level will indicate within the upper
20 dB of the meter display. Set the RESPONSE switch to FAST,
WEIGHTING switch to LIN and MODE switch to SPL. Turn the POWER
switch to ON.
2. Set the OB-300 POWER switch to MANUAL and the MODE switch to 1/1.
Press the RUN button to place the meter into the RUN mode. Then
use the two direction buttons to select the 1 kHz filter.
3. Place the calibrator and adapter onto the microphone. Turn the
calibrator ON. A meter reading that is very close to the level
listed on the calibrator should result. An error of +/- 0.5 dB is
acceptable. This is due to the center frequency filter tolerance
of +/- 0.5 dB maximum.
4. Change the OB-300 filter frequency first to 500 and read the
display. Then change to 2k and read the display. At both
frequencies the readings should be 19 to 23 dB less than the 1 kHz
calibrator level.
5. Change the OB-300 filter frequency to 1k and the meter dB RANGE so
that the meter reads 20 to 40 dB less than full scale. Press and
hold the -20 dB button on the OB-100. The meter reading shall rise
approximately 20 dB to verify that the -20 dB button functions.
6. Remove the calibrator. The analyzer is now ready to use.
B. Taking a Measurement
1. Turn the meter POWER switch ON. The meter will come on in the
Pause mode. Perform a BATTERY test to verify that the analyzer has
sufficient battery power. Replace the batteries if the bar
indicator falls below the indicating arrow (located at 5 on the 0
- 60 scale).
2. Set the dB RANGE switch to 80 - 140 dB. Set the RESPONSE switch to
FAST, WEIGHTING switch to LIN (see note), and the MODE switch to
SPL.
37
NOTE: Note that the filter response can be in series with either A,
B, C, or LIN. This is the operator's choice. However, LIN is
generally used when taking octave band measurements.
3. Turn the OB-300 POWER switch to MANUAL to activate the filter. "--
-" will appear in the display with the meter in the Pause mode.
Select either 1/3 or 1/1 filters using the MODE switch.
4. Select the desired WEIGHTING and RESPONSE. Then change the dB
RANGE switch down in 20 dB steps until the OL indicator flashes or
stays on. Then go back up 20 dB so that the OL indicator stays
off. This ensures that the AC input to the filter is at its
maximum voltage without clipping (overloading).
MANUAL Filter Operation
Place the meter into the Pause mode using the RUN/Pause button. Press
RESET to clear all internal memory. Select the first frequency of
interest. Then enter the RUN mode for the required amount of time
necessary to obtain a valid sample. Then enter the Pause mode, change
to the next frequency of interest and enter RUN again, etc. Repeat this
process for all frequencies of interest. Note that it is not necessary
to enter the pause mode between each frequency if the user just wishes
to step through the frequencies sequentially with no delay time in
between frequencies.
AUTO Filter Operation
Place the meter into the Pause mode using the RUN/Pause button. Press
RESET to clear all internal memory. Select the first frequency of
interest. (Be sure that the TIME adjustment is set to the desired
filter cycle time.)
Slide the filter POWER switch to AUTO. To start the sampling sequence,
place the meter into the RUN mode and immediately press the proper
direction button. (The UP ARROW button causes the frequency to cycle to
the next higher frequency, the DOWN ARROW button causes the frequency to
cycle to the next lower frequency.)
/