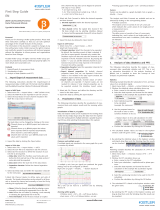
Quick Start Guide
jBEAM Lab Starter/Professional/Ultimate
Type 2897A
2897A_002-950e-12.21
Foreword
Thank you for choosing a Kistler quality product. Please read
these instructions carefully, so that you can take optimum
advantage of the versatile features of this product.
The information in this document is subject to change at any
time without prior notice. Kistler reserves the right to improve
and modify the product in accordance with technical progress
without the obligation to inform persons and organizations
based on these changes.
© 2020 ... 2021 Kistler Group. All rights reserved. Kistler Group
products are protected by various intellectual property rights.
For more details visit www.kistler.com.
Contents, front page
1. General information
2. Installation & license activation
3. Import/Export of measurement data
Contents, back page
4. Overview of user interface
5. Visualization of data
6. Analysis of data (statistics and FFT)
1. General information
jBEAM is a comprehensive post-processing software with
extensive analysis functions and the capability of visualiza-
tion and report generation. Due its platform independence
and multilingualism, worldwide customers in R&D are using
the software for quick analysis as well as for managing com-
plex projects with terabytes of data.
The following system requirements and recommendations apply:
• Windows 10
• Intel Core i5-7500, 2.7 GHz or better (recommended)
• 4 GB RAM (minimum)
• SSD (recommended)
2 GB free disk space for installation (minimum)
• Display resolution 1920 x 1080/full HD (recommended)
This quick start guide is intended for the installation and license
activation of jBEAM Lab Starter/Professional/Ultimate. In addi-
tion it describes the first steps in jBEAM which are the import/
export, visualization and basic analysis of measurement data.
Further information can be found in the jBEAM help in the tool
itself under menu Help → jBEAM Help or in the manual on the
Kistler website www.kistler.com (search for Type 2897A).
2. Installation & license activation
The following instructions describe the installation and license
activation of jBEAM Lab Starter/Professional/Ultimate.
Installation
1. The latest jBEAM Lab Starter/Professional/Ultimate
version can be downloaded from the Kistler Website:
www.kistler.com → Search for Type 2897A and download
the purchased jBEAM edition
2. Unzip the downloaded package and execute the jBEAM
installer (*.exe file).
3. Select your installation language and confirm with OK.
4. Start the installation by clicking Next.
5. Select your desired installation directory and confirm
with Next.
6. Select the components you would like to install
and confirm with Next. The component
“WIBU CodeMeterRuntime” is required for licensing
and may not be deselected.
7. Start the installation by clicking Next and wait until
the installation is finished.
8. Complete the installation by clicking Finish.
Online license activation
For online license activation, the PC with the jBEAM installa-
tion requires Internet access. In case your PC does not have
Internet access please consult your local Kistler representative
to support an offline activation of jBEAM.
1. Start jBEAM from the Windows start menu in the
folder jBEAM-Lab-Starter or jBEAM-Lab-Professional or
jBEAM-Lab-Ultimate (depending on installed edition):
2. When prompted enter the license key which you received
(on paper or via e-mail) and confirm with Activate Key:
3. Import/Export of measurement data
The following instructions describe the import/export of
measurement data in MDF and CSV format into/from jBEAM
Lab Starter/Professional/Ultimate.
Import of MDF data
1. Select menu File → Import Values → ASAM-MDF (v3/v4).
2. Select the MDF file to be imported in tab File Chooser.
3. Select the load status for each channel included in the
MDF file in tab Channel Selection:
The load status can be changed by clicking on the icons:
Channel shows up in jBEAM project and values are
imported
Channel shows up in jBEAM project but values
aren’t imported (will be imported automatically
when channel is used within project)
Channel does not show up in jBEAM project and
values aren’t imported
4. Import the data by clicking the Open button.
Import of CSV data
1. Select menu File → Import Values → ASCII.
2. Select the CSV file to be imported in tab File Chooser.
3. Select tab File Structure to define the structure of your
CSV file to be imported.
a. Meta data: Select the checkbox Load meta data and
define the start and end line of the meta data section
if meta data shall be imported
b. Data start: Define the start line of the data section
c. Separation character: Define the channel separation
character
4. Select tab Meta Data and define the separation character
for the meta data:
5. Select tab Channel Header to define name and units of
channels. The header information can be entered for all
channels or channel by channel and manually or from the
file by selecting the appropriate line.
a. Name: Define the channel name either by entering a
name manually or selecting the appropriate line in the
file
b. Unit: Define the unit either by entering a unit manually
or selecting the appropriate line in the file.
c. Time information: If the file does include an explicit
time channel this step (5c) can be skipped to proceed
with step 6. If not, define:
• x0: Start time
• Δx: Time increment per sample
• x-Unit: Unit of time
6. Select tab Data Formats to define the decimal separator
and time channel:
a. Decimal separator: Define the decimal separator
b. Time channel: Define the explicit time channel if the
file does include one by selecting checkbox Manual
X-channel and the appropriate channel (if not see step 5c)
7. Import the data by clicking the Open button.

Kistler Group
Eulachstrasse 22
8408 Winterthur, Switzerland
Tel. +41 52 224 11 11
info@kistler.com
www.kistler.com
2897A_002-950e-12.21 © 2020 ... 2021 Kistler Group
Export in CSV format
1. Select menu File → Export Values → ASCII
2. Select tab Channel data:
a. Channel selection: Select the channels to be exported
By default, the checkbox export all data is selected. If
you like to export specific channels only unselect the
checkbox export all data and select the channels to be
exported in the list Available Channels. By pressing the
button “>” you can add the selected channels to your
Selected Channels list. Only channels in the Selected
Channels list will be exported.
b. Separation character: Select the separation character
for the CSV export format
c. Export channel properties: By default, channel
properties (name, unit, etc.) are exported. If the
information is not needed in the data export unse-
lect the checkbox Export channel properties.
d. Export values: By default, channel values of select-
ed channels are exported. If channel values are not
needed for instance if only channel properties are to
be exported unselect the checkbox Export values.
3. Select tab File Chooser and define the directory and file
name for the data export
4. Export the data by clicking the Export button
4. Overview of user interface
The following paragraph describes the jBEAM user interface
which is split into 4 main sections:
A) Menu
The menu section allows to import data and apply different
analysis/calculations on the imported data. Furthermore text
elements, interactive graphs and control elements can be
selected for documentation, visualization and control of data
on the working sheet. The generation of reports can be initi-
ated from the menu section.
B) Spreadsheet
The spreadsheet section lists the data values of all the import-
ed channels including the meta data. Furthermore the results
of analysis and calculations are indicated in this section.
C) Explorer
In the explorer the data importers with the single channels
are listed including a graph preview section of the different
channels. Besides the data importers the explorer lists all the
calculation and analysis objects with its results.
D) Working sheet
The working sheet is the section where you can visualize your
data and analysis results. Besides the pure data visualization
this section also allows to place interactive control elements
to tailor the analysis and visualization to your current needs.
5. Visualization of data
The following instructions describe the visualization of mea-
surement data and analysis results and the zooming within
graphs.
Visualization of data in y/t graphs
Data and analysis results can be visualized in the working sheet
section (D) by simply drag & drop the data from the explorer
(C) to the working sheet. Multiple selection is possible by press-
ing Ctrl key while selecting the desired data in the explorer.
Common and multiple y-axis
If multiple signals are visualized in the same graph the y-axis
is common by default.
If multiple y-axis (one per signal) are preferred the graph
settings need to be configured as follows:
Right click on graph → Modify… → Button Stacked A
The y-axis can be set back to a common axis by selecting
Stacked B.
Zooming within graphs
• Window zoom: «Ctrl + Alt + Left Mouse Button»
• Axis zoom: «Ctrl + Left Mouse Button» on axis
• Moving signal within graph: «Ctrl + Left Mouse Button»
Cursors
Cursors can be added to a graph by Right click on graph →
Modify… Cursor.
The following two cursor sets are available and can be select-
ed by clicking on the corresponding button:
• Analysis cursor set:
The analysis cursor set consist of one y/t cursor pair which
indicates the y and t values of one single point of a measure-
ment curve.
• Delta cursor set:
The delta cursor set consists of two y/t cursor pairs indicating
the y and t values of one single point of a measurement curve
each. In addition y and t delta values are indicated.
6. Analysis of data (Statistics and FFT)
The following instructions describe the analysis of measure-
ment data, specifically statistics and FFT.
This is not an exhaustive description of the analysis functions
of jBEAM, but is intended to show the concept of how anal-
yses are performed in jBEAM.
Statistics
Following example describes the calculation of min. and max.
value of an acceleration signal.
1. Select menu Math → Statistic → Extract Statistical Values
2. Window for statistical values calculation shows up
a. Enter a name for the statistics calculation:
b. Select the data importer and channel for the statistic
calculation (in this example the acceleration signal):
c. Select statistical quantity to be calculated
(in this example the minimum):
d. Use the proposed name for the result or enter a name
(unselect checkbox to do so):
→ Repeat steps b to d to add calculations for
other statistic values (maximum value in this
example)
e. Confirm the calculation by clicking the OK button
3. The calculated statistic values are listed in the Explorer
window under the given names:
4. By selecting the statistical values in the Explorer window
and drag & drop them onto the Working sheet the results
can be visualized
FFT
Following example describes the calculation of a FFT of an
acceleration signal
1. Select menu Math → Vibration Analysis (FFT) → FFT-
Spectrum
2. Window for FFT calculation shows up
a. Enter a name for the FFT calculation:
b. Select your calculation - amplitude and/or phase
spectrum:
c. Select the data importer and channel for the FFT
calculation (in this example the acceleration signal):
d. Select the windowing function to be used for the FFT
calculation:
e. Confirm the calculation by clicking the OK button
3. The calculated FFT is listed in the Explorer window under
the given name:
4. By selecting the FFT results in the Explorer window and
drag & drop them onto the Working sheet the results can
be visualized.
/