Page is loading ...

EN Experiments
Art. No. 9820200
WEATHER STATION

2
EN Experiments
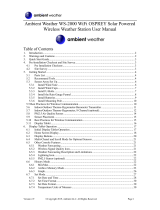
Experiment 1
Measuring wind speed
We cannot see the wind, but we often see what it is doing or what it has done. To
measure wind speed, we use an instrument called an anemometer.
Materials:
• 1 wind speed meter (Anemometer)
Steps:
1. Assemble the wind speed meter.
2. Turn on the meter, switch to wind speed measurement mode and select the unit
you want to use:
- m/s: Meters per second
- km/h: Kilometers per hour
- mph: Miles per hour
- knots: Nautical Miles per hour
3. You may erase the previously recorded maximum wind speed data first. Press [AVG/
MAX] until the maximum data is shown and press [ON/OFF/CLR] to clear this old data.
Change back to normal mode by pressing [AVG/MAX] again.
4. Take the meter outside and hold it up, at arm’s length while the cups rotate in the
wind. Lower the instrument and note the reading. You can recall the average and max-
imum wind speed by pressing the [AVG/MAX] button.
Explanation:
The wind speed meter is equipped with wind cups. They spin almost like a windmill
when the wind blows. The stronger the wind blows, the faster these rotations are.
Along with the wind cups, a shaft rotates, which is connected to a slot wheel. The elec-
tronic circuitry measures the speed of the wheel and calculates the wind speed.
Note:
• Hold the wind speed meter up high so that
your body will not block the wind and affect
the readings.
• The bar on the bottom of the display is the
Beaufort Scale, which was devised in 1805 by a
British sailor named Francis Beaufort. The scale
was used to estimate the force of the wind
without the use of any instruments. It divides
wind speeds into 12 categories, each of which
describes the physical effect of the wind.

3
The Beaufort Scale
Force Wind speed (km/h) Description Effects
0 <1 Calm Smoke rises vertically
1 1-5 Light air Wind direction shown by smoke-
drift
2 6-11 Light breeze Wind felt on face; leaves rustle;
weather vanes move
3 12-19 Gentle breeze Leaves and small twigs move,
light weight ags extend
4 20-28 Moderate breeze Small branches move, raises dust,
leaves and paper
5 29-38 Fresh breeze Small trees sway
6 39-49 Strong breeze Large tree branches move,
telephone wires "whistle",
umbrellas are dicult to control
7 50-61 Near gale Large trees sway, becoming
dicult to walk
8 62-74 Gale Twigs break off trees, walking is
dicult
9 75-88 Strong gale Slight damage occurs to buildings,
roof tiles y off
10 89-102 Storm Trees uprooted, considerable
damage to house (rarely
experienced)
11 103-117 Violent storm Very rarely experienced; extensive
widespread damage
12 118+ Cyclone/
Hurricane
Extreme destruction; devastation

4
Experiment 2
Measuring wind direction using a wind vane
From which direction is the wind blowing? The wind vane is one of the oldest weath-
er tools. It is used for measuring wind direction.
Materials:
• 1 wind vane
• 1 compass
Steps:
1. Set the wind vane (with the carrying
case) in a high place. Make sure
it does not tilt or wobble. Always
make sure nothing blocks the wind.
Otherwise, the results would be
inaccurate.
2. The wind vane’s arrow spins and
points in the direction from which
the wind comes. So, if it points
south, the wind is a south wind. Use
the compass to determine the wind
direction. The red pointer always
points north. Align the compass so
that the red arrow points to the 'N'
on the compass scale. Compare the
direction of the arrow on the wind
vane with the compass and read the
corresponding direction on the com-
pass scale.
Explanation:
The part of the vane that turns into the wind is usually shaped like an arrow. The
other end is wide so it will catch the smallest breeze. The breeze turns the arrow until
it catches both sides of the wide end equally. The wind vane helps meteorologists to
track, among other things, the movement of storm clouds.

5
EN
Experiment 3
Measuring temperature using a thermometer
Materials:
• 1 thermometer (not included)
• 1 notepad
Observe your thermometer:
Look at your thermometer, which is a small tube with a small bulb at the bottom. In
the middle you see a thin red line. It rises higher when it is hotter. When it gets cold,
the line drops. The liquid inside is colored alcohol, which expands when heated and
shrinks when cooled. The scale on both sides of the thermometer indicates the tem-
perature using different units. On one side is the Fahrenheit scale (°F), which is used
mostly in the United States, on the other side is the Celsius scale (°C) which is mostly
used in the rest of the world.
Temperature:
Temperature is a measure of how warm or cold something is.
A thermometer is a device that measures the temperature of
things. You can use a thermometer to measure the temperature
inside or outside your house, inside the refrigerator or even your
body temperature if you are sick. Temperature is one of the most
important elements of weather because it controls or influences
other elements like humidity, clouds, rain and wind.
Temperature:
Temperature is a measure of how warm or cold something is. A thermometer is a
device that measures the temperature of things. You can use a thermometer to meas-
ure the temperature inside or outside your house, inside the refrigerator or even your
body temperature if you are sick. Temperature is one of the most important elements
of weather because it controls or influences other elements like humidity, clouds, rain
and wind.
Time and temperature:
We know that the time factors influence how hot or cold it is. The time of the year
and the time of the day have influence over the temperature.
• Temperature variation between day and night: It refers to the periodic and regu-
lar change of temperature within a day. The temperature is usually at maximum
around 2 o’clock in the afternoon when we receive the strongest sunlight and
at minimum around sunrise in the early morning, when the heat stored in the
ground from the day before is dissipated.
• Seasonal temperature change: It refers to the periodic and regular change of
temperature at different times of the year. The temperature is highest during
summer time when the earth is closer to the sun. During wintertime the tem-
perature is the lowest when the earth is further away from the sun and the sun-
light is weaker.

6
Measure and record the temperature:
Use the supplied thermometer and measure the outdoor temperature. Take read-
ings at different times of the day and at different months. Try to complete the table
below. This will give you a rather exact idea of the range of temperature of your
area.
Month/Hour 3:00 6:00 9:00 12:00 15:00 18:00 21:00 24:00
January
March
May
July
September
November
Experiment 4
Exploring lightning and static electricity
Thunderstorms are terrifying and yet beauti-
ful to watch. When warm, humid air rises and
cools, the water vapor condenses into a cloud.
When the conditions are right, it gradually
develops into a thundercloud with more and
more water vapor. Thunderstorms are created
in the giant cumulonimbus clouds. Flashes of
lightning may fill the sky and sometimes we
hear a booming sound wave called thunder.
Lightning
Lightning is a huge discharge of electricity and is one of the most unpredictable forc-
es of nature. It can strike from minor or major storms and can hit a target 10 or even
25 miles away from the parent cloud. When ice and water particles collide in a cloud,
they are charged with static electricity. Lighter particles tend to be positively charged
and end up near the top of the cloud, while negatively charged particles are near the
bottom of the cloud. In time, this charge becomes so great that electricity jumps to the
ground or to the other clouds, creating great sparks of lightning. The lightning heats
up the air to a high temperature and produces a powerful explosion we hear as thun-
der.

7
EN
Materials:
- 1 cotton cloth, towel or blanket. The material needs to be clean and dry.
- Dry air. This experiment works best when the humidity is low, like during wintertime.
Turning the furnace up a few degrees will help dry the air further.
Steps:
1. Turn off all the lights and give your eyes some time to
adjust to the darkness.
2. Sit on the floor or bed. Place the cloth on your back.
Make a fist and hold your hand at a distance of approx-
imately 15 cm from your face, directly in front of your
chin.
3. Quickly move the cloth over your head with your other
hand. Make sure it rubs well on your hair.
4. Draw the cloth close to your fist until it is approximate-
ly 10 cm above your fist. Make sure the fist doesn’t
touch your arm.
5. If you're doing it correctly, spectacular little blue/pur-
ple sparks will jump off your knuckles into the cloth.
The faster you pull the cloth, the longer and more fre-
quent the sparks will be.

8
Explanation:
The small sparks occur because something similar to a thunderstorm is happening.
When you rub the cloth over your hair, you transfer tiny invisible energy particles,
which we call electrons, from your hair to the cloth. This makes the cloth negative-
ly charged and your hair positively charged, which creates a high electrical voltage
between your body and the cloth. This electrical voltage can cause electrons to want to
jump back from the cloth to your body in order to balance the difference in charge. If
you hold the cloth to your fist, and the difference in charge is very large, a small spark
or flash can occur balancing out the difference in charge.
Experiment 5
Determining how far away a storm is
Materials:
• 1 wristwatch / stopwatch (not included)
• 1 notepad
Steps:
1. Have your stopwatch or a wristwatch ready.
2. When you see a flash of lightning, start the stopwatch or note the time on the wrist-
watch.
3. Count the number of seconds until you hear the thunder.
4. For every 3 seconds the storm is 1 kilometer away. So, divide the number of seconds
you counted by 3 to get the distance in kilometers. For example, if you hear the
thunder after 9 seconds, the storm is 9 / 3 = 3 km away.
Explanation:
Light travels much faster than sound. The lightning and thunder are always happen-
ing at the same time, but light reaches you instantly, while the sound takes longer.
Sometimes you may see a flash of lightning without hearing thunder. This is because
the lightning occurs too far away to be heard. But when you see lightning and hear
thunder at the same time, it means that the thunderstorm is very close, so LOOK OUT!

9
EN
Experiment 6
Understanding the Water Cycle and evapora-
tion
The earth has a limited amount of water. Water
keeps going around and around in a continuous
process called the "Water Cycle".
This cycle is made up of a few main parts:
• Evaporation (and transpiration)
• Condensation
• Precipitation
• Collection
The sun’s heat transforms the water collected
in oceans, lakes and rivers into a gas. This gas
is called water vapor and the process is called
evaporation. In the atmosphere, the water vapor
gets cold and changes back into droplets of liquid
water, forming clouds. This is called condensa-
tion. When the water is too heavy to be held in
the clouds, it falls back to the ground as precipita-
tion - dew, rain, sleet or snow.
Materials:
• 2 chalk sticks
• Puddles

10
Steps:
1. Find a place where puddles are usually
formed after the rain.
2. After a rainy day, look for a puddle. Use your
chalk to trace the edges of the puddle and
wait.
3. Return to look at your puddle when four or
five hours have passed. Trace the edges of
the puddle as it appears now. If you have a
piece of chalk with a different color, use it.
4. Compare the chalk outlines. If you wish, you
can wait to draw another one when more
time has passed.
5. Try this Experiment under different weather
conditions: with the sun shining, cloudy or
windy weather ... When will the puddle dry
the fastest?
Explanation:
The puddle decreases as water evaporates. It is the intensity of the heat of the sun
that determines the speed of evaporation. So, if the weather is hot after the rain, the
puddles disappear very quickly. However, if it remains wet and cold, the puddles stay
longer.

11
EN
Experiment 7
Determining the pH
What is pH?
pH, which stands for potential of Hydrogen, is the value which indicates if a substance
is an acid or a base.
The pH can go from 1 to 14:
• Substances which have a pH lower than 7 are acids (the pH 1 being the strongest
acid).
• Substances which have a pH equal to 7 are neutral.
• Substances which have a pH higher than 7 are bases/alkaline (the pH 14 being the
strongest base/alkaline).
Materials:
• pH paper
• 1 pH scale
• 1 pair of tweezers
• Tap water
Steps:
1. Study the pH scale, the supplied pH scale goes
from 4 to 9. Locate the color corresponding to
each pH value.
2. The pH paper changes color when we put it
in contact with a basic or acidic substance.
Always hold the pH paper with the tweezers,
because even the moisture of your fingers can
make it change color.

12
3. By comparing the color of paper pH on a pH
scale, you can determine the pH of the sub-
stance you are testing.
4. You can check the pH of different substances,
but start with the tap water of your house. Cut
out small pieces of pH paper. Do not forget to
always use the tweezers! Soak the pH paper
in water.
5. Note the color change. Find the new color
of the pH paper on the pH scale. The num-
ber that corresponds to this color is the tap
water’s pH.
Explanation:
pH paper is a special kind of paper that changes its color when you dip it into a liquid.
The new color shows whether the liquid is acidic, basic, or neutral. The pH value of
water should be neutral (7).

13
EN
Experiment 8
Air pollution and determining the pH of rain
Pollution is caused by the emission of undesirable substances to the atmosphere, the
earth, rivers and seas. Pollution harms or endangers our lives, and also badly affects
the lives of animals and plants.
Acid rain is caused by chemical changes, which occur in the atmosphere and are
produced by air pollution. Under the action of these chemical changes, certain gases
become acidic. Acid rain is very harmful to the environment. It damages everything
over a period of time because it causes the living things in the environment to die. Acid
rain affects life in water as well as life on land. It is almost worse in water than on land
because fish need the water to breathe. When the water gets polluted, then the fish
get sick and end up dying.
However, rainwater is always slightly acidic. Normal rainwater has a pH of 5.6. It is only
when the pH of the rain drops below 5.6 that it is considered acid rain.
Materials:
• pH paper
• 1 pH scale
• Plastic cups
• 1 pair of tweezers
• 1 pipette
• Different types of water
WARNING:
Risk of burns from hot water! Only perform this task under adult supervision.
Steps:
1. Gather as many water samples as possible:
tap water, rainwater, water from an
aquarium, a lake, a river, the sea.
2. Pour each sample in a cup and label the
cups.
3. Take pH paper using the tweezers. Cut it
into small pieces and place one of these
pieces next to each cup.
4. Add a few drops of each water sample on
the pH paper using a pipette. Wash and
dry the pipette every time before picking
up the next water sample.

14
5. Wait a few minutes and compare the
colors to the pH scale. Determine the pH
value of each sample using the colors.
6. You can also test the pH of the two other
water forms, like an ice cube and vapor.
Pay attention not to get burnt by the hot
vapor.
Explanation:
If the pH of rainwater is 5, it is considered acid rain. Acid rain is dangerous. Therefore,
if the pH of rainwater is below 5, the water is not viable.
Experiment 9
Building a hygrometer
Humidity refers to the concentration of water vapor in the air. Measuring the humidity
helps meteorologists forecast the weather. A relative humidity of 100 percent is when
the air has as much water vapor as it can hold at a particular temperature, and mists
or fogs form. When the air is very humid, the chance of raining is higher. In hot and
humid weather, we feel uncomfortable because perspiration on our skin does not
evaporate as quickly, hampering our body’s effort to cool down.
Meteorologists use a device called a hygrometer to measure humidity. One type of
hygrometer is the wet-and-dry bulb thermometer, which contains two different ther-
mometers.
Materials:
• 2 thermometers (not included)
• 1 cotton ball or small piece of
cotton
• Tap water
• 1 relative humidity table
• 1 fan
dry bulb minus wet bulb
dry bulb
°C12345678910
10 88 77 66 55 44 34 24 15 6
11 89 78 67 56 46 36 27 18 9
12 89 78 68 58 48 39 29 21 12
13 89 79 69 59 50 41 32 22 15 7
14 90 79 70 60 51 42 34 25 18 10
15 90 81 71 61 53 44 36 27 20 13
16 90 81 71 63 54 46 38 30 23 15
17 90 81 72 64 55 47 40 32 25 18
18 91 82 73 65 57 49 41 34 27 20
19 91 82 74 65 58 50 43 36 29 22
20 91 83 74 67 59 53 46 39 32 26
21 91 83 75 67 60 53 46 39 32 26
22 91 83 76 68 61 54 47 40 34 28
23 92 84 76 69 62 55 48 42 36 30
24 92 84 77 69 62 56 49 43 37 31
25 92 84 77 70 63 57 50 44 39 33
Relative humidity table

15
EN
Steps:
1. Use a rubber band to tie a
thoroughly wet cotton ball to
the bulb of one thermometer.
This is the wet thermometer.
2. Place the wet and dry
thermometers side by side
against the wall or one side of
a box. You can use a piece of
tape to secure them so they
will not fall.
3. Turn on the fan and blow on
the thermometers until the
temperature readings stop
falling. This may take several
minutes.
4. Write down the temperature
on both thermometers, for
example 19 °C and 15 °C
5. Subtract the temperature on
the wet thermometer from that
of the dry one, e.g. 19 °C - 15
°C = 4 °C.
6. Look in the provided
Relative Humidity Table
for the temperature of the
dry thermometer in the far
left column, e.g. 19, and
the difference of the two
temperatures at the top row,
e.g. 4. Look where the row with
the dry temperature and the
column with the temperature
difference meet in the table.
This number is the relative
humidity in % (see highlights in
the example table: 65%).
dry bulb minus wet bulb
dry bulb
°C12345678910
10 88 77 66 55 44 34 24 15 6
11 89 78 67 56 46 36 27 18 9
12 89 78 68 58 48 39 29 21 12
13 89 79 69 59 50 41 32 22 15 7
14 90 79 70 60 51 42 34 25 18 10
15 90 81 71 61 53 44 36 27 20 13
16 90 81 71 63 54 46 38 30 23 15
17 90 81 72 64 55 47 40 32 25 18
18 91 82 73 65 57 49 41 34 27 20
19 91 82 74 65 58 50 43 36 29 22
20 91 83 74 67 59 53 46 39 32 26
21 91 83 75 67 60 53 46 39 32 26
22 91 83 76 68 61 54 47 40 34 28
23 92 84 76 69 62 55 48 42 36 30
24 92 84 77 69 62 56 49 43 37 31
25 92 84 77 70 63 57 50 44 39 33
Relative humidity table

16
Experiment 10
Setting up the barometer
Atmospheric pressure or air pressure corresponds to the weight of air. Measuring
atmospheric pressure is very useful in predicting the weather. We use a barometer to
measure the air pressure. Here is how to make your own.
Materials:
• 1 balloon
• 1 plastic tube
• 5 pieces of bag ties
• 1 rubber ring
• 1 stopper
• 1 pressure scale card
• 1 pipette
• 1 cup
• Food coloring
• Water
Steps:
1. Prepare the pressure scale card.
1. Lay it flat on a table, with the printed side faced down as indicated below.
3. Fold the left side towards the middle, until
the holes on the left panel intersect with
those near the middle of the cardboard.

17
EN
4. Insert a bag tie through the overlapping
holes, make a loop and twist the ends so
that the cardboard shape is secured.
5. Fix the plastic tube in position using two
bag ties
6. Fill the cup with some water, add a few
drops of food coloring and stir with a
spoon until they are mixed.

18
7. Use the pipette to add the colored water
into the plastic tube until it is half-full.
8. Put a stopper to one end of the plastic
tube.
9. Slide the rubber band over the balloon as shown in the picture.

19
EN
10. Blow the balloon up and quickly attach it to the open end of the plastic tube.
Place the rubber ring around the tube to prevent the air from escaping.
11. Fix both ends of the plastic tube on the cardboard with two more bag ties.
Now the barometer is ready. Record the level of the water on the left (A) and
on the right (B).
Explanation:
Due to the change of the atmospheric pressure, the water level in the tube should
change from one day to the next. Atmospheric pressure is the weight of air pressing
on every part of your body, and everything around you. We can measure air pressure
and predict a storm.
Experiment 11
Using the barometer
Check and record the water level of column B (under the balloon) for several days. This
should be especially interesting when the weather changes from good to bad or vice
versa. Try to find a relation between the weather and the water level readings.
The water level of the barometer changes when the air pressure changes. When the
weather is fine, the air pressure is higher. However, when a storm is coming, the air
pressure drops. When the pressure increases, the air leaves the balloon and goes into
the tube. Thus, the water is pushed towards the stopper and the water level under the
balloon falls. Conversely, when the pressure decreases, the air enters the balloon and
the water follows the same direction, making the water level under the balloon rise.
You can simulate the change of air pressure by trying the Experiment below.

20
Steps:
1. Place your barometer close to a light bulb
for at least half an hour. Record the water
level and compare it with your previous
records.
2. Place your barometer inside a refrigerator
for about 15 minutes. Record the water
levels.
3. Simulate a large increase in air pressure by
pressing the balloon with your hands. Note
and record the results again.
Explanation:
Air pressure varies according to many factors, such as air temperature and air density
(how tightly its particles are packed together). The molecules of cold air move slower
/