Page is loading ...

Figure out where Excel came from
(yawn!)
Beautify the data
Share the work of art
Satisfy yourself with a Soy Chai
Latte
To Do List
The Four-One-One of Excel
05 149164-ch01.qxp 7/16/08 2:17 PM Page 2
COPYRIGHTED MATERIAL

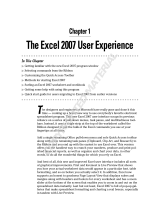
f you looked up “Excel” on Wikipedia, you’d find a blurb about a spreadsheet pro-
gram called “Multiplan,” released in 1982. Excel has come a long way since then,
thanks in part to competition from Lotus 1-2-3.
By 1988 Excel started to outsell Lotus 1-2-3, and since then Microsoft has regularly
released updates. Soon, Microsoft became the leader in personal computer software
development.
You, too, can become the Excel Diva with a bit of practice and consistent application.
I won’t lie to you, and I will not add yet another 10-minute routine you have to do every
day to enhance your Excel skills. (I think the 10-minute routines are best kept for personal
primping.) I will, however, say that no matter what you want in life, you still have to put
some time in. You’re a busy IT Girl and will put the time in when it is necessary for you to
do so at work or otherwise, and I will be here to guide you when you need it. I hope this
chapter (and this book) builds the Excel Diva-like intuition in you, so you can think it, and
it will happen.
II
05 149164-ch01.qxp 7/16/08 2:17 PM Page 3

Excel 2007: The Louis Vuitton of Spreadsheets
So are you ready to look at Excel 2007 with new eyes? You should look at Excel
the same way you look at the shoe department in Nordstrom’s or the feeling you
got when you went to a candy store as a kid. There is no other way. The enhance-
ments in this version are so COOL you can’t help but be excited about it and share
with your friends. (At least, if you’re an IT Girl you can’t!) The gist of it is that you
can do more with less time. If done right, Excel 2007 will give you some of your
much-needed time back.
Do you remember when you purchased your first name-brand handbag? The feel of
it, how it smelled, and how you knew it would be perfect with every shoe in your
closet and it would go with the dresses you had not yet bought, because in its entirety
that handbag is perfect? Well, in the software world, there really is no Louis Vuitton
spreadsheet program, but Microsoft’s Excel 2007 comes pretty darn close.
Sometimes new versions of software just don’t seem complete enough to worry
about. When you walk into a department store, you’re usually not looking for a
purse because you want something, anything new;
you want a specific function. You walk into your
favorite department store and you will see a lot of
handbags that are all new. You don’t buy just any
new handbag, you find just the right one, built in a
way that makes sense: the zippers work well, the
pockets were made with your needs in mind, and
it comes with an extra bag to protect it when you
don’t use it and a lock or some other feature for
the cutesy look. Well that’s a top-shelf company:
they keep everything in mind and put your needs
first. Maybe you’re not a Louis Vuitton kind of girl with a fancy purse; you’re more
of an Eddie Bauer backpacker—it matters not. The point is still the same: you’re
looking for improved functionality, and Excel 2007 has it.
For those of you who have used Excel in the past I would say that Excel 2007 is
truly close to the “Extreme Makeover” or the “Swan.” There was great substance
there before but it really wasn’t apparent until an extreme makeover enabled us to
have access to more of the functions with less effort and time to find it. After all,
I promised we would be spending more time utilizing the functions and keeping the
10-minute routines for your abdominal workouts and your skin care, to give us time
back to do the important things, like take care of our family and friends, and shop
for fancy handbags. The best part about the whole thing is, despite the “Extreme
Makeover,” Excel 2007 still feels and works like a spreadsheet should. So for those
of you who have been using Excel for a while now, it will take some time to get used
to the new layout, but after the initial bumps you will be up and running in no time
making your spreadsheet beautiful and effective.
Part I — Learn IT!
4
Out in the courtyard of Building 17 on
Microsoft’s campus there are tiles in
the ground with all the product
names and dates they were released.
Who
knew?
05 149164-ch01.qxp 7/16/08 2:17 PM Page 4

What Excel Can Do for You
With all the changes in Excel 2007 it’s important to bond. It’s important to spend
time with Excel 2007 and learn a few key terms. Let’s begin with the “Office Pearl.”
It’s not just another pearl to add to your necklace, it’s the Office logo on the top-left
corner of the Microsoft Excel 2007 screen (Figure 1-1).
Figure 1-1
When you hover over it, you can learn
more about what it does. It is where you
will find the most common items such as
printing, saving, and others. We will get
into that more later. The next big item is
the Microsoft Office Ribbon. Microsoft
has spent a lot of time learning from
users how and which features they use most when using Office. From this they have
organized the Microsoft Office Ribbon, which is what sits on top of Excel 2007.
The Microsoft Office Ribbon is shown in Figure 1-2, where you can see several tabs
organized from left to right with several of the most commonly used buttons on
each tab.
Figure 1-2
The tabs are also organized per utilization order. If you notice, Paste is the first item
on the left corner; that is because Microsoft has found that Paste is used most com-
monly across all the users they studied. You’ll notice this spreadsheet application was
designed with you in mind. It has what you need, where you need it, and you can
hover on any of the items on the Ribbon and a pop-up window will explain what
each logo does as well as where to get help (Figure 1-2).
5
Chapter 1 — The Four-One-One of Excel
The most commonly used function in all of Microsoft
Office is the Paste function, followed by Cut, Copy,
and Format Painter. These common functions have
been put on the first tab on the farthest left corner
where you are easily able to use them.
Did you
know?
05 149164-ch01.qxp 7/16/08 2:17 PM Page 5

Excel Can Beautify
Your Data
We all like to spend more time
with things that are beautiful or
pleasing to the eye. We ladies
already know this. So Excel
2007 has just the thing. New
key features, such as Format as
Table located on the Styles sec-
tion of the Home tab (Figure
1-3), allow you to make your
work look beautiful and helpful,
impressing your boss and your
coworkers while making com-
plex information easier to
understand. Managing printed
headers and footers is very easy
with the use of Page Layout
view. I love the new Themes
feature, which lets me have
access to colors, fonts, and
even make my data look flashy
and sharp. I use this feature
throughout Office 2007 and my
manager always wonders how
much time I spent on that thing.
But to tell the truth in most
cases I spend 1–2 minutes
more, which buys me 5 minutes
of kudos, and no rework needs
to be done so I always get a
great deal of my time back,
making it a great investment.
Figure 1-3
For those of you who want to understand the data you
are looking at right away, there is Conditional
Formatting, located on the Styles section of the Home
tab (Figure 1-4). This is a new feature added to Excel
2007, and the enhancement makes it much easier to
find and use. Conditional formatting helps you see what
your data is telling you right away. Rather than having
to graph the block of data to see where the highest or
lowest numbers are, this little function tells you that in
real time. You can add graph bars to the numbers in
each cell to better understand the trends of your data.
You know that cool feature on the Home Depot site that
allows you to pick the color of paint and it shows you
what a room with that color of paint and the certain
color of backsplash you picked looks like? Well this is
very much the same thing, but instead it shows you
information about the data you’re trying to digest. Once
you select the Data Bars option from the Conditional
Formatting button in Figure 1-4, you can easily see the
highest and lowest values, as shown in Figure 1-5.
New fea
t
ure
styles cells
into a table.
Part I — Learn IT!
6
05 149164-ch01.qxp 7/16/08 2:17 PM Page 6

Figure 1-4
Figure 1-5
There are so many new things, and old things that are now done better, that it
is hard to pick and choose. By far my favorite, and probably the most important
in terms of improving the look of your data, is the robust SmartArt feature
(Figure 1-6). All the guys in the office always wonder how I make my presentations
look so good. All the well-known diagrams are there, but now they have a more
sophisticated and chic look. Divas, if you want to learn more about SmartArt, also
read through Chapter 9.
Selec
t
Da
t
a Bars or
other formats here.
7
Chapter 1 — The Four-One-One of Excel
05 149164-ch01.qxp 7/16/08 2:17 PM Page 7

Figure 1-6
The presentation piece of Excel has always been a bit hard and frankly most of the
tools were not really there, or if they were they were hard to find. In Excel 2003,
you could have a maximum of 56 different colors in your workbook (see the Geek
Facts 1.1 sidebar). Also, there was just no easy way to make sure the colors looked
good together, unless you spent countless time and had your graphic artist friends
help you. Well, Excel 2007 includes a great number of improvements and new for-
matting options. You can have as many different colors as you’d like. Also, the cool
part for those of us who are not color coordinated but want to be, is that we can
assign a theme to the workbook (mine are always magically pink if I spend time to
change it). The nice part about assigning a theme is that you get the complemen-
tary colors to assign inside your workbook. But if you want to make sure certain data
points still show up clearly and you don’t really care about color coordination, you
can of course do that as well. Just be mindful that you might be questioned by the
fashion police. And for those color Divas out there you can create your own themes.
Really, a theme is a group of colors you choose; this way the reader of your data
knows all your expenses will be a certain color, and your total income a certain
color—you can also think of it as formatting. This is something you can define for
yourself or use pre-created common themes (Figure 1-7). To learn more about
themes, take a look at Chapter 7.
Excel 2007 also gives you time back by including a lot of new chart types, cool
graphics, and new Chart Tools that make looking at data very easy. You now have
more graphic ability and can apply shadows, bevels, and most anything else you can
do with other types of graphic elements. We can now all become our own Excel
Divas. What’s amazing about this is that Microsoft Word 2007 and Microsoft
Smar
t
Ar
t
fea
t
ure
Part I — Learn IT!
8
05 149164-ch01.qxp 7/16/08 2:17 PM Page 8

PowerPoint 2007 now use the Microsoft Excel 2007 charting engine, making cre-
ating charts much easier and more powerful within those applications too. So you
can take the charts you create in Excel 2007 into PowerPoint 2007 and Word 2007
for great presentations and reports. You heard it here first!
Figure 1-7
A common forma
t
choice
9
Chapter 1 — The Four-One-One of Excel
Geek Facts 1.1
How about the geeky cool things? Now you can show off your geek-skills: Excel 2007
can hold more than 1 million rows of data.Want more?
•
Total number of columns in Excel 2007 is now 16,384; it was 256.
•
Total number of rows is now 1,048,576; it was 65,536.
•
The number of unique colors allowed in a single workbook is now 4.3 billion;
it was 56. But please follow your good sense and use color coordination.
•
The number of levels of sorting you can perform on a range of tables is now 64;
it was 3.
•
The number of items allowed in the Filter drop-down is now 10,000;it was 1,000.
•
The maximum number of characters allowed in formulas is 8,000; it was 1,000.
•
The maximum number of arguments allowed to a function is now 255; it was 30.
05 149164-ch01.qxp 7/16/08 2:17 PM Page 9

Excel Formulas: It All Adds Up!
Ever remember getting frustrated trying
to type Excel functions? If you are new
you probably don’t even know where to
begin. Well, never fear! You get a new
AutoComplete feature in all the equations
you will use, and now you have it in Excel
2007. When you type an equal sign fol-
lowed by any letter you get a drop-down list
of functions that start with that letter, and
as you type more letters the list narrows
down to finally what you need.
A few items AutoComplete offers are:
Excel 2007 functions: As you can see in Figure 1-8, when you type the “=s” you
can see a lot of equations from “SUM” (which is the total) to “SQRT” (which is
Square Root) and more.
User-defined functions: These are the special functions that you (yes, you
will create some of these later on), or someone else has created in your
workbook or macro code.
Defined names: These are user-defined (defined by you) nicknames for spe-
cific cell ranges (so if you had cells A1 to A30 on your monthly bill work-
sheet you could call them February Bills).
Figure 1-8
Notice these windows pop up as you begin
typing in the cell.
Helpful hints conveniently pop up.
AutoComplete shows many different equations
from SUM.
Part I — Learn IT!
10
There is a little hovering box that describes what
the function does (Figure 1-8). This frees up your
brain from having to remember all the names of
the functions you use, so you can have more idle
time in your brain to think about what other
cool things you could be doing.
Just for
you...
05 149164-ch01.qxp 7/16/08 2:17 PM Page 10

11
Chapter 1 — The Four-One-One of Excel
One of the most common requests from corporations that have utilized Excel was
to find the average value of cells where the cell met a certain criteria. So for those
of you looking at your monthly budget and you want to find out where you spend
more than $500 every month (probably at the Louis Vuitton store!), this is a great
place to start. After you enter all your expenses you can use the cool new formulas
the Excel 2007 team has created to summarize your data given a certain condition.
In the following list you can find a couple of the new added functions with Excel
2007 that enable you to get the most out of your data. If you want to find out more
about functions, please read Chapter 6.
AVERAGEIF: Helps you to find the average value of cells in a range for cells
that meet a single criterion. So in this case if you want to find out where
you spend more than $500 in monthly expenses, this function is how you
would do it. You would start by typing “=AVERAGEIF(“ (including the
quotes, of course) into a cell and continue by selecting the cells you are
looking at.
AVERAGEIFS: Helps you find the average value of cells in a range of cells that
meet multiple criteria. So if you wanted to find out in which month you spent
$500 on your shopping bill that would be two criteria: shopping and $500
minimum. So you would select the shopping column and then the cell for each
month where you spent your shopping money.
File Formats and How to Share with Your Friends
With the new Microsoft Open Office file format XLSX (.xlsx) you can integrate better
with other programs such as Open Office or other types of comparable office prod-
ucts. You can also integrate better with other types of data, such as if you want to copy
pictures or your Christmas wish list to a blog, Amazon.com, eBay, or other places. As
you grow your Excel 2007 skills and want to connect to data sources such as Access,
SQL database, or others, it is easier than ever with Excel 2007. You can even begin
by clicking on the Data tab of the Office 2007 Ribbon. So what this means, ladies, is
more room for pictures of all the wish list items you have and room for music and video
lists. So the next time you make a wish list on Overstock.com, you can put that list on
your desktop and save it for later use. But this also means that if you want your friends
and coworkers (who may not have been as lucky as you to have gotten a copy of Excel
2007) to be able to read the spreadsheets you create, you will have to save in the
97-2003 format. Some things might change (such as shading or font styles that were
unavailable in older versions of Excel) but most of what you see, they will see.
In order to save properly, click on the Office Pearl from Figure 1-1 and choose the
Save As option (Figure 1-9) from the drop-down menu. Once you click on the Save
As option, you will see a window like the one in Figure 1-10 come up. This window
is where you can make sure you are saving to the right location, with the right name,
and to the right format (pay close attention here or your friends can’t see it!), as
shown by the bottom arrow of Figure 1-10.
05 149164-ch01.qxp 7/16/08 2:17 PM Page 11

Figure 1-9
Figure 1-10
Review Before You Print
Now you know the value that has been added into Excel 2007, but how about print-
ing? After all your effort you’d like to share your work with your colleagues and man-
ager. With Excel 97 there was something called Page Break Preview view, which
helped you see (in a small font, which you couldn’t really read) what your work would
look like. Well, when you take a look at your workbook with Page Layout view you
see exactly what your work will look like. The cool thing with Page Layout view
(Figure 1-11) now is that you can change your workbook’s margins, so they fit better
Save options
Part I — Learn IT!
12
05 149164-ch01.qxp 7/16/08 2:17 PM Page 12

on a printed page; and add and edit headers and footers, so you can put the confi-
dential lines, page numbers, and dates in that you forgot. And most importantly, edit
your data.
Figure 1-11
Online Help
There is ample help inside Excel 2007, but if you need more for the project you are
doing, there is also ample help online. You can click on the question mark on the
top-right side of the screen (Figure 1-12).
Figure 1-12
Find help here.
Click here
t
o see
t
he Page Layou
t
view.
13
Chapter 1 — The Four-One-One of Excel
05 149164-ch01.qxp 7/16/08 2:17 PM Page 13

Figure 1-12 shows a great place to find help about anything you are trying to do.
You can also visit
http://Office.Microsoft.com, where you will find the same Ribbon
feel and be able to navigate to get the updates and help you need. For updates you
can click on the Office Pearl and go down to the Excel options. When you click on
Excel 2007 Options, the Excel Options window appears (Figure 1-13). From this
window you can select Resources from the left side and check for updates online. In
most cases you will be automatically notified that updates are available from
Microsoft for your product. What you can expect from these updates are mainly bug
fixes, so when you find something and let Microsoft know, the Excel team captures
the most important ones based on number of occurrences and amount of impact,
and fixes them and sends out updates.
Figure 1-13
Check
for updates.
Click on the Resources section to find
the options to search for updates.
Click on
t
he Office Pearl
t
o open
the Excel Options window.
Part I — Learn IT!
14
05 149164-ch01.qxp 7/16/08 2:17 PM Page 14

15
Chapter 1 — The Four-One-One of Excel
You have made it through the first chapter. Hopefully you’re inspired and looking at your
favorite handbag with a whole new perspective. You’ve learned about some of the coolest new
features in Excel 2007 and are ready to move on to something new. Reward yourself with a
soy Chai latte.
Did you know the word Chai is Farsi, and it means tea? For those of you who have seen it
with the Indian culture, yes, the same word in India is used to mean “tea with milk.” So the
truth is when you order Chai tea, you are actually ordering a “tea tea,” kind of like a mahi
mahi. Funny thing is in Farsi Mahi means fish, so you are then saying “fish fish.”
So why soy and not regular Chai? Because it’s fat free and very low in calories. After all,
soy is a bean. The cool thing is, you have to walk somewhere
to get a soy Chai, and not too many places have it either. So
as you walk around trying to find your soy Chai, you get the
exercise too, and that keeps good oxygen flowing in your body
and burns extra calories, and you may meet a lot of nice peo-
ple along the way. When you look at the calories of a regular
latte, compared to a soy Chai latte (this is what most places call
it), you will see a big difference.
05 149164-ch01.qxp 7/16/08 2:17 PM Page 15
/