Page is loading ...

MPR SERIES
MicroPressure Board Mount Pressure Sensors
Compact, High Accuracy, Compensated/Amplified
DESCRIPTION
The MPR Series is a very small
piezoresistive silicon pressure sensor
offering a digital output for reading
pressure over the specified full scale
pressure span and temperature range.
It is calibrated and compensated over a
specific temperature range for sensor
offset, sensitivity, temperature effects,
and non-linearity using an on-board
Application Specific Integrated Circuit
(ASIC). This product is designed to meet
the requirements of higher volume
medical (consumer and non-consumer)
devices, commercial appliance, and
industrial/HVAC applications.
DIFFERENTIATION
• Application-specific design addresses
various application needs and
challenges.
• Digital output: Plug and play feature
enables ease of implementation and
system level connectivity.
• Total Error Band: Provides true
performance over the compensated
temperature range, which minimizes
the need to test and calibrate every
sensor, thereby potentially reducing
manufacturing cost; improves sensor
accuracy and offers ease of sensor
interchangeability due to minimal part-
to-part variation. (See Figure 1.)
VALUE TO CUSTOMERS
• Very small form factor: Enables
portability by addressing weight, size,
and space restrictions; occupies less
area on the PCB.
• Wide pressure ranges simplify use.
• Enhances performance: Output
accelerates performance through
reduced conversion requirements and
direct interface to microprocessors.
• Value solution: Cost-effective, higher
volume solution with configurable
options.
FEATURES
• 5 mm x 5 mm [0.20 in x 0.20 in]
package footprint
• Calibrated and compensated
• 60 mbar to 2.5 bar | 6 kPa to 250 kPa |
1 psi to 30 psi
• 24-bit digital I
2
C or SPI-compatible
output
• IoT (Internet of Things) ready interface
• Stainless steel pressure port
• Compatible with a variety of liquid
media
• Absolute and gage pressure types
• Total Error Band after customer auto-
zero: As low as ±1.25 %FSS
• Compensated temperature range: 0ºC to
50ºC [32ºF to 122ºF]
• REACH and RoHS compliant
• Meets IPC/JEDEC J-STD-020D.1
Moisture Sensitivity Level 1
• Select sensors available on breakout
board for easy evaluation and testing
• Ultra-low power consumption (as low
as 0.01 mW typ. average power, 1 Hz
measurement frequency)
32332628
Issue F
• Meets IPC/JEDEC J-STD-020D.1
Moisture Sensitivity Level 1
requirements: Allows avoidance of
thermal and mechanical damage
during solder reflow attachment and/
or repair that lesser rated sensors may
incur; allows unlimited floor life when
stored as specified (simplifying storage
and reducing scrap); eliminates lengthy
bakes prior to reflow, and allows for
lean manufacturing due to stability
and usability shortly after reflow.
POTENTIAL APPLICATIONS
• Consumer medical: Non-invasive
blood pressure monitoring, negative-
pressure wound therapy, breast pumps,
mobile oxygen concentrators, airflow
monitors, CPAP water tanks, and
medical wearables
• Non-consumer medical: Invasive blood
pressure monitors, ambulatory blood
pressure measurement
• Industrial: Air braking systems, gas and
water meters
• Consumer: Coffee machines,
humidifiers, air beds, washing
machines, dishwashers
The MPR Series joins an
extensive line of board
mount pressure sensors
for potential use in medical,
industrial, and consumer
applications. To view the entire
product portfolio, click here.

2
sensing.honeywell.com
MICROPRESSURE BOARD MOUNT PRESSURE SENSORS, MPR SERIES
Table of Contents
General Specifications ..............................................................................................................3-4
Power Consumption and Standby Mode ...........................................................................................5-6
Product Nomenclature and Order Guide ..............................................................................................7
Pressure Port/Range/Reference Availability.........................................................................................8
Pressure Range Specifications:
60 mbar to 2.5 bar ...............................................................................................................9
6 kPa to 250 kPa .............................................................................................................. 10
1 psi to 30 psi .................................................................................................................. 11
1.0 General Information ...........................................................................................................12
2.0 Pinout and Functionality ..................................................................................................... 12
3.0 Start-Up Timing ............................................................................................................... 12
4.0 Power Supply Requirement ................................................................................................... 12
5.0 Reference Circuit Design ..................................................................................................... 13
5.1 I
2
C and SPI Circuit Diagrams ............................................................................................. 13
5.2 Bypass Capacitor Use .............. ...................................................................................... 13
6.0 I
2
C Communications
6.1 I
2
C Bus Configuration ..................................................................................................... 14
6.2 I
2
C Data Transfer ................... ...................................................................................... 14
6.3 I
2
C Sensor Address ........................................................................................................ 14
6.4 I
2
C Pressure Reading ...................................................................................................... 15
6.5 I
2
C Status Byte ............................................................................................................ 15
6.6 I
2
C Communications ...................................................................................................... 15
6.6.1 Output Measurement Command .................................................................................. 15
6.6.2 I
2
C Slave Address of 0x18 .......................................................................................... 16
6.7 I
2
C Timing and Level Parameters ......................................................................................... 16
7.0 SPI Communications
7.1 SPI Definition ..............................................................................................................17
7.2 SPI Data Transfer ................... .......................................................................................17
7.3 SPI Pressure Reading ......................................................................................................17
7.4 SPI Status Byte ............................................................................................................ 18
7.5 SPI Communications ..................................................................................................... 18
7.6 SPI Timing and Level Parameters ........................................................................................ 18
8.0 MPR Series Digital Output Pressure Calculation ............................................................................ 19 .
Long Port Dimensions and Recommended PCB Pad Layout ...................................................................... 20
Modified Long Port Dimensions and Recommended PCB Pad Layout ........................................................... 21
Short Port Dimensions and Recommended PCB Pad Layout ......................................................................22
Tape and Reel Dimensions ...........................................................................................................23
Reflowable Protective Silicone Cap ................................................................................................. 24
Recommended Tubing ............................................................................................................... 25
Manifold and O-Ring Assembly ..................................................................................................... 26
Recommended O-Rings ..................... ...................................................................................... 27
Additional Information ....................... ....................................................................................back

3
Sensing and Internet of Things
MICROPRESSURE BOARD MOUNT PRESSURE SENSORS, MPR SERIES
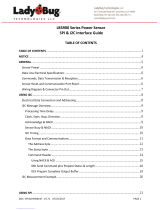
FIGURE 1. TEB COMPONENTS FOR THE MPR SERIES
TABLE 1. ABSOLUTE MAXIMUM RATINGS
1
CHARACTERISTIC MIN. MAX. UNIT
Supply voltage (V
supply
) -0.3 3.6 Vdc
Voltage on any pin -0.3 V
supply
+ 0.3 V
ESD susceptibility (human body model) — 4 kV
Storage temperature -40 [-40] 85 [185] °C [°F]
Soldering peak reflow temperature and time 15 s max. at 250°C [482°F]
1
Absolute maximum ratings are the extreme limits the device will withstand without damage.
TABLE 2. ENVIRONMENTAL SPECIFICATIONS
CHARACTERISTIC PARAMETER
Humidity:
external surfaces
internal surfaces
0 %RH to 95 %RH, non-condensing
0 %RH to 100 %RH, condensing
Vibration 10 g, 10 Hz to 2 kHz
Shock 50 g, 6 ms duration
Solder reflow J-STD-020-D.1 Moisture Sensitivity Level 1 (unlimited shelf life when stored at <30°C/85 %RH)
TABLE 3. WETTED MATERIALS
COMPONENT MATERAL
Port 304 stainless steel
Adhesives epoxy
Electronic components not exposed (protected by gel)
Total
Error
Band
Accuracy
BFSL
Sources of Error
Thermal Hysteresis
Thermal Effect on Offset
Thermal Effect on Span
Pressure Non-Linearity
Pressure Hysteresis
Full Scale Span
Offset
Pressure Non-Repeatability
Total Error Band (TEB) is a single specification that includes
the major sources of sensor error. TEB should not be
confused with accuracy, which is actually a component of
TEB. TEB is the worst error that the sensor could experience.
Honeywell uses the TEB specification in its datasheet
because it is the most comprehensive measurement of
a sensor’s true accuracy. Honeywell also provides the
accuracy specification in order to provide a common
comparison with competitors’ literature that does not use
the TEB specification.
Many competitors do not use TEB—they simply specify
the accuracy of their device. Their accuracy specification,
however, may exclude certain parameters. On their
datasheet, the errors are listed individually. When combined,
the total error (or what would be TEB) could be significant.

4
sensing.honeywell.com
MICROPRESSURE BOARD MOUNT PRESSURE SENSORS, MPR SERIES
TABLE 4. SENSOR PRESSURE TYPES
PRESSURE TYPE DESCRIPTION
Absolute Output is proportional to the difference between applied pressure and a built-in vacuum reference.
Gage Output is proportional to the difference between applied pressure and atmospheric (ambient) pressure.
TABLE 5. OPERATING SPECIFICATIONS
CHARACTERISTIC
MIN. TYP. MAX. UNIT
Supply voltage (V
supply
):
1
1.8 3.3 3.6 Vdc
Current consumption:
I
2
C sleep/standby mode
SPI sleep/standby mode
3.0
13.0
33.8
43.8
211
221.0
nA
nA
Power consumption — 10 — mW
Operating temperature range
2
-40 [-40] — 85 [185] °C [°F]
Compensated temperature range
3
0 [32] — 50 [122] °C [°F]
Startup time (power up to data ready) — — 2.5 ms
Data rate (assumes command AA
HEX
) 161 204 — samples per second
I
2
C/SPI voltage level:
low
high
—
80
—
—
20
—
%V
supply
Pull up on MISO, SCLK, SS, MOSI 1 — — kOhm
Accuracy
4
— — ±0.25 %FSS BFSL
5
Resolution:
transfer function A
transfer function B
transfer function C
14.0
13.5
14.0
—
—
—
—
—
—
bits
1
The sensor is not reverse polarity protected. Incorrect application of supply voltage or ground to the wrong pin may cause
electrical failure.
2
Operating temperature range: The temperature range over which the sensor will produce an output proportional to pressure.
3
Compensated temperature range: The temperature range over which the sensor will produce an output proportional to pressure
within the specified performance limits (Total Error Band).
4
Accuracy: The maximum deviation in output from a Best Fit Straight Line (BFSL) fitted to the output measured over the pressure
range. Includes all errors due to pressure non-linearity, pressure hysteresis, and non-repeatability.
5
Full Scale Span (FSS): The algebraic difference between the output signal measured at the maximum (Pmax.) and minimum
(Pmin.) limits of the pressure range. (See Figure 4 for pressure ranges.)

5
Sensing and Internet of Things
MICROPRESSURE BOARD MOUNT PRESSURE SENSORS, MPR SERIES
POWER CONSUMPTION AND STANDBY MODE
The sensor is normally in Standby Mode and is only turned on in response to a user command, thus minimizing power
consumption. Upon receiving the user command, the sensor wakes up from Standby Mode, runs a measurement in Active State,
and automatically returns to Standby Mode, awaiting the next command. The resulting sensor power consumption is a function of
the sampling rate (samples per second) as shown in Tables 6 and 7 and Figures 2 and 3.
TABLE 6. AVERAGE POWER CONSUMPTION AT 1.8 V
SUPPLY
(ASSUMES COMMAND AA
HEX
)
SAMPLING
RATE
(samples per second)
AVERAGE POWER
(mW)
ACTIVE TIME
(ms)
ACTIVE POWER
(mW)
IDLE TIME
(ms)
IDLE POWER
(mW)
Minimum Average Power
1 0.0068 3.625 1.884 996.375 0.0000054
2 0.0137 7.25 1.884 992.75 0.0000054
5 0.0341 18.125 1.884 981.875 0.0000054
10 0.0683 36.25 1.884 963.75 0.0000054
20 0.1366 72.5 1.884 963.75 0.0000054
50 0.3414 181.25 1.884 818.75 0.0000054
100 0.6829 362.5 1.884 637.5 0.0000054
160 1.0926 580 1.884 420 0.0000054
Typical Average Power
1 0.0094 4.157 2.248 995.843 0.00006084
2 0.0187 8.314 2.248 991.686 0.00006084
5 0.0468 20.785 2.248 979.215 0.00006084
10 0.0935 41.57 2.248 958.43 0.00006084
20 0.1870 83.14 2.248 916.86 0.00006084
50 0.4673 207.85 2.248 792.15 0.00006084
100 0.9345 415.7 2.248 584.3 0.00006084
160 1.4592 665.12 2.248 334.88 0.00006084
Maximum Average Power
1 0.0129 4.839 2.588 995.161 0.0003798
2 0.0254 9.678 2.588 990.322 0.0003798
5 0.0630 24.195 2.588 975.805 0.0003798
10 0.1256 48.39 2.588 951.61 0.0003798
20 0.2508 96.78 2.588 903.22 0.0003798
50 0.6264 241.95 2.588 758.05 0.0003798
100 1.2524 483.9 2.588 516.1 0.0003798
160 2.0036 774.24 2.588 225.76 0.0003798
020406080 100
0.00
Sampling Rate (samples per second)
Average Power Consumption (mW)
120 140 160
0.50
1.00
1.50
2.00
2.50
Maximum average power (mW)
Typical average power (mW)
Minimum average power (mW)
0.25
0.75
1.25
1.75
2.25
2.75
5010 30 15013011070 90
FIGURE 2. AVERAGE POWER CONSUMPTION VS SAMPLING RATE AT 1.8 V
SUPPLY

6
sensing.honeywell.com
MICROPRESSURE BOARD MOUNT PRESSURE SENSORS, MPR SERIES
TABLE 7. AVERAGE POWER CONSUMPTION AT 3.3 V
SUPPLY
(ASSUMES COMMAND AA
HEX
)
SAMPLING
RATE
(Samples per second)
AVERAGE POWER
(mW)
ACTIVE TIME
(ms)
ACTIVE POWER
(mW)
IDLE TIME
(ms)
IDLE POWER
(mW)
Minimum Average Power
1 0.0114 3.625 3.134 996.375 0.0000099
2 0.0227 7.25 3.134 992.75 0.0000099
5 0.0568 18.125 3.134 981.875 0.0000099
10 0.1136 36.25 3.134 963.75 0.0000099
20 0.2272 72.5 3.134 963.75 0.0000099
50 0.5680 181.25 3.134 818.75 0.0000099
100 1.1361 362.5 3.134 637.5 0.0000099
160 1.8177 580 3.134 420 0.0000099
Typical Average Power
1 0.0156 4.157 3.729 995.843 0.00011154
2 0.0311 8.314 3.729 991.686 0.00011154
5 0.0776 20.785 3.729 979.215 0.00011154
10 0.1551 41.57 3.729 958.43 0.00011154
20 0.3101 83.14 3.729 916.86 0.00011154
50 0.7751 207.85 3.729 792.15 0.00011154
100 1.5501 415.7 3.729 584.3 0.00011154
160 2.4800 665.12 3.729 334.88 0.00011154
Maximum Average Power
1 0.0214 4.839 4.275 995.161 0.0006963
2 0.0421 9.678 4.275 990.322 0.0006963
5 0.1041 24.195 4.275 975.805 0.0006963
10 0.2075 48.39 4.275 951.61 0.0006963
20 0.4144 96.78 4.275 903.22 0.0006963
50 1.0349 241.95 4.275 758.05 0.0006963
100 2.0692 483.9 4.275 516.1 0.0006963
160 3.3103 774.24 4.275 225.76 0.0006963
FIGURE 3. AVERAGE POWER CONSUMPTION VS SAMPLING RATE AT 3.3 V
SUPPLY
020406080 100
0.00
Sampling Rate (samples per second)
Average Power Consumption (mW)
120 140 160
0.50
1.00
1.50
2.00
2.50
Maximum average power (mW)
Typical average power (mW)
Minimum average power (mW)
0.25
0.75
1.25
1.75
2.25
2.75
5010 30 15013011070 90
3.00
3.25
3.50
3.75
4.00
4.25

7
Sensing and Internet of Things
MICROPRESSURE BOARD MOUNT PRESSURE SENSORS, MPR SERIES
M P R L S 0 0 2 5 P A 0 0 0 0 1 A
Product Series
Gel
Pressure Port
1
MPR
Silicone
Transfer Function
3
A
10% to 90% of 2
24
counts
Low Pressure
0000
Output Type
S
0
1
2
3
SPI
I
2
C, Address 0x08
I
2
C, Address 0x18
I
2
C, Address 0x28
I
2
C, Address 0x38
4
5
6
7
I
2
C, Address 0x48
I
2
C, Address 0x58
I
2
C, Address 0x68
I
2
C, Address 0x78
S
Long
L
Pressure Range, Unit and Reference
1,2
Absolute
0015PA
0025PA
0030PA
Absolute
0001BA
01.6BA
02.5BA
Gage
Gage
0001PG
0005PG
0015PG
0030PG
0060MG
0100MG
0160MG
0250MG
0400MG
0600MG
0001BG
01.6BG
02.5BG
0 bar to 1 bar
0 bar to 1.6 bar
0 bar to 2.5 bar
0 mbar to 60 mbar
0 mbar to 100 mbar
0 mbar to 160 mbar
0 mbar to 250 mbar
0 bar to 400 mbar
0 bar to 600 mbar
0 bar to 1 bar
0 bar to 1.6 bar
0 bar to 2.5 bar
Absolute
0100KA
0160KA
0250KA
Gage
0006KG
0010KG
0016KG
0025KG
0040KG
0060KG
0100KG
0160KG
0250KG
0 kPa to 100 kPa
0 kPa to 160 kPa
0 kPa to 250 kPa
0 kPa to 6 kPa
0 kPa to 10 kPa
0 kPa to 16 kPa
0 kPa to 25 kPa
0 kPa to 40 kPa
0 kPa to 60 kPa
0 kPa to 100 kPa
0 kPa to 160 kPa
0 kPa to 250 kPa
0 psi to 1 psi
0 psi to 5 psi
0 psi to 15 psi
0 psi to 30 psi
0 psi to 15 psi
0 psi to 25 psi
0 psi to 30 psi
N
G
H
C
inH
2
0
MPa
HPa
cmH
2
0
Other calibration
units may be
specified
.
For example, MPRLS0025PA00001A defines an MPR Series pressure sensor, long port, silicone gel, 0 psi to 25 psi absolute pressure
range, I
2
C
,
a
ddress 0x18, 10% to 90% of 2
24
counts transfer function, no breakout board.
2
The MPR Series is available in a number of configurations. Contact Honeywell or your authorized distributor for a current list of
available configurations. For applications above 250,000 units per year, additional configurations are available.
Breakout boards, designed for use with the Honeywell
SEK002 Sensor Evaluation Kit, are available with the
sensor already mounted.
Order using the catalog listings in the table below.
B
2.5% to 22.5% of 2
24
counts
3
Transfer Function varies by Pressure Range selection, see Tables 9, 10, 11, and 12 for allowed values.
MPR Series Sensor Mounted on a Breakout Board
C
20% to 80% of 2
24
counts
0300YG
0 mmHg to 300 mmHg
Catalog Listing
MPRLS0025PA00001AB
MPRLS0015PA0000SAB
MPRLS0001PG0000SAB
MPRLS0300YG00001BB
MPRSS0001PG00001CB
Gage
Description
Breakout board with 0 psi to 25 psi absolute sensor, long port, with gel, I
2
C = 0x18, transfer function A
Breakout board with 0 psi to 15 psi absolute sensor, long port, with gel, SPI, transfer function A
Breakout board with 0 psi to 1 psi gage sensor, long port, with gel, SPI, transfer function A
Breakout board with 0 mmHg to 300 mmHg gage sensor, long port, with gel, I
2
C = 0x18, transfer function B
Breakout board with 0 psi to 1 psi gage sensor, short port, with gel, I
2
C = 0x18, transfer function C
MPR Series with long port
mounted on a breakout board.
Short
S
Food grade
F
Silicone
S
MPR Series with short port
mounted on a breakout board.
1
See Table 8 for pressure port/range/reference availability.
Long Modified
Long
FIGURE 4. PRODUCT NOMENCLATURE AND ORDER GUIDE
CATALOG LISTING DESCRIPTION
MPRLS0025PA00001AB Breakout board with 0 psi to 25 psi absolute sensor, long port, with gel, I
2
C = 0x18, transfer function A
MPRLS0015PA0000SAB Breakout board with 0 psi to 15 psi absolute sensor, long port, with gel, SPI, transfer function A
MPRLS0001PG0000SAB Breakout board with 0 psi to 1 psi gage sensor, long port, with gel, SPI, transfer function A
MPRLS0300YG00001BB Breakout board with 0 mmHg to 300 mmHg gage sensor, long port, with gel, I
2
C = 0x18, transfer function B
MPRSS0001PG00001CB Breakout board with 0 psi to 1 psi gage sensor, short port, with gel, I
2
C = 0x18, transfer function C

8
sensing.honeywell.com
MICROPRESSURE BOARD MOUNT PRESSURE SENSORS, MPR SERIES
FIGURE 4. PRODUCT NOMENCLATURE
TABLE 8. PRESSURE PORT/ RANGE/REFERENCE AVAILABILITY
PRESSURE
REFERENCE
ORDER
CODE
PRESSURE
RANGE
Long Port
(See Figure 10.)
Modified Long Port
(See Figure 11.)
Short Port
(See Figure 12.)
Absolute
0001BA 0 to 1 bar
— —
01.6BA 0 to 1.6 bar
— —
02.5BA 0 to 2.5 bar
— —
0100KA 0 to 100 kPa
— —
0160KA 0 to 160 kPa
— —
0250KA 0 to 250 kPa
— —
0015PA 0 to 15 psi
— —
0025PA 0 to 25 psi
— —
0030PA 0 to 30 psi
— —
Gage
0060MG 0 to 60 mbar
—
0100MG 0 to 100 mbar
—
0160MG 0 to 160 mbar
—
0250MG 0 to 250 mbar
—
0400MG 0 to 400 mbar
— —
0600MG 0 to 600 mbar
— —
0001BG 0 to 1 bar
— —
01.6BG 0 to 1.6 bar
— —
02.5BG 0 to 2.5 bar
— —
0006KG 0 to 6 kPa
—
0010KG 0 to 10 kPa
—
0016KG 0 to 16 kPa
—
0025KG 0 to 25 kPa
—
0040KG 0 to 40 kPa
— —
0060KG 0 to 60 kPa
— —
0100KG 0 to 100 kPa
— —
0160KG 0 to 160 kPa
— —
0250KG 0 to 250 kPa
— —
0001PG 0 to 1 psi
—
0005PG 0 to 5 psi
— —
0015PG 0 to 15 psi
— —
0030PG 0 to 30 psi
— —
0300YG 0 to 300 mmHg
— —

9
Sensing and Internet of Things
MICROPRESSURE BOARD MOUNT PRESSURE SENSORS, MPR SERIES
TABLE 9. PRESSURE RANGE SPECIFICATIONS FOR 60 MBAR TO 2.5 BAR
PRESSURE
RANGE
(SEE
FIGURE 4.)
PRESSURE RANGE
UNIT OVER
PRESSURE
1
BURST
PRESSURE
2
TOTAL ERROR
BAND AFTER
CUSTOMER
AUTO-ZERO
3
(%FSS)
TOTAL
ERROR
BAND,
TYPICAL
(%FSS)
TRANSFER
FUNCTION
P
MIN.
P
MAX.
Absolute
0001BA 0 1 bar 4 8 ±1.5
4
±1.5 A
01.6BA 0 1.6 bar 4 8 ±1.5
4
±1.5 A
02.5BA 0 2.5 bar 4 8 ±1.5
4
±1.5 A
Gage
0060MG 0 60 mbar 350 700 ±1.25 ±2.5 C
0100MG 0 100 mbar 350 700 ±1.25 ±2.5 A
0160MG 0 160 mbar 350 700 ±1.25 ±2.5 A
0250MG 0 250 mbar 350 700 ±1.25 ±2.5 A
0400MG 0 400 mbar 4000 8000 ±2.0 ±2.5 B
0600MG 0 600 mbar 4000 8000 ±2.0 ±2.5 A
0001BG 0 1 bar 4 8 ±1.5 ±2.5 A
01.6BG 0 1.6 bar 4 8 ±1.5 ±2.5 A
02.5BG 0 2.5 bar 4 8 ±1.5 ±2.5 A
1
Overpressure: The maximum pressure which may safely be applied to the product for it to remain in specification once pressure
is returned to the operating pressure range. Exposure to higher pressures may cause permanent damage to the product.
Unless otherwise specified this applies to all available pressure ports at any temperature with the operating temperature range.
The customer’s pressure connection system (tubing or O-rings) must be specified to be equal to, or greater than, the rated
overpressure limit. Due to the possibility of light sensitivity, opaque tubing is recommended.
2
Burst Pressure: The maximum pressure that may be applied to any port of the product without causing escape of pressure media.
Product should not be expected to function after exposure to any pressure beyond the burst pressure.
3
Total Error Band after Customer Auto-Zero: The maximum deviation from the ideal transfer function over the entire
compensated pressure range for a minimum of 24 hours after an auto-zero operation. Includes all errors due to full scale span,
pressure non-linearity, pressure hysteresis, and thermal effect on span. Low pressure MPR sensors may exhibit offset shifts after
reflow solder. See Technical Note “Auto-Zero Calibration Technique for Pressure Sensors” (008326-1-EN) if this shift is significant
in a particular application.
4
Because atmospheric pressure is continually changing, autozeroing an absolute pressure sensor requires a reference standard.
If the actual absolute pressure is important in an application (such as for a barometer), an external precision reference is needed
to set the offset to the correct current value of atmospheric pressure. In applications where the difference between multiple
absolute sensors is important, any reference may be used (such as one of the other absolute pressure sensors in a system, or even
an arbitrary pressure like 14.7 psia), as long as it is consistent and repeatable.
TABLE 8. PRESSURE PORT/ RANGE/REFERENCE AVAILABILITY
PRESSURE
REFERENCE
ORDER
CODE
PRESSURE
RANGE
Long Port
(See Figure 10.)
Modified Long Port
(See Figure 11.)
Short Port
(See Figure 12.)
Absolute
0001BA 0 to 1 bar
— —
01.6BA 0 to 1.6 bar
— —
02.5BA 0 to 2.5 bar
— —
0100KA 0 to 100 kPa
— —
0160KA 0 to 160 kPa
— —
0250KA 0 to 250 kPa
— —
0015PA 0 to 15 psi
— —
0025PA 0 to 25 psi
— —
0030PA 0 to 30 psi
— —
Gage
0060MG 0 to 60 mbar
—
0100MG 0 to 100 mbar
—
0160MG 0 to 160 mbar
—
0250MG 0 to 250 mbar
—
0400MG 0 to 400 mbar
— —
0600MG 0 to 600 mbar
— —
0001BG 0 to 1 bar
— —
01.6BG 0 to 1.6 bar
— —
02.5BG 0 to 2.5 bar
— —
0006KG 0 to 6 kPa
—
0010KG 0 to 10 kPa
—
0016KG 0 to 16 kPa
—
0025KG 0 to 25 kPa
—
0040KG 0 to 40 kPa
— —
0060KG 0 to 60 kPa
— —
0100KG 0 to 100 kPa
— —
0160KG 0 to 160 kPa
— —
0250KG 0 to 250 kPa
— —
0001PG 0 to 1 psi
—
0005PG 0 to 5 psi
— —
0015PG 0 to 15 psi
— —
0030PG 0 to 30 psi
— —
0300YG 0 to 300 mmHg
— —

10
sensing.honeywell.com
MICROPRESSURE BOARD MOUNT PRESSURE SENSORS, MPR SERIES
TABLE 10. PRESSURE RANGE SPECIFICATIONS FOR 6 KPA TO 250 KPA
PRESSURE
RANGE
(SEE
FIGURE 4.)
PRESSURE RANGE UNIT OVER
PRESSURE
1
BURST
PRESSURE
2
TOTAL ERROR
BAND AFTER
CUSTOMER
AUTOZERO
3
(%FSS)
TOTAL
ERROR
BAND,
TYPICAL
(%FSS)
TRANSFER
FUNCTION
P
MIN.
P
MAX.
Absolute
0100KA 0 100 kPa 400 800 ±1.5
4
±1.5 A
0160KA 0 160 kPa 400 800 ±1.5
4
±1.5 A
0250KA 0 250 kPa 400 800 ±1.5
4
±1.5 A
Gage
0006KG 0 6 kPa 35 70 ±1.25 ±2.5 C
0010KG 0 10 kPa 35 70 ±1.25 ±2.5 A
0016KG 0 16 kPa 35 70 ±1.25 ±2.5 A
0025KG 0 25 kPa 35 70 ±1.25 ±2.5 A
0040KG 0 40 kPa 400 800 ±2.0 ±2.5 B
0060KG 0 60 kPa 400 800 ±2.0 ±2.5 A
0100KG 0 100 kPa 400 800 ±1.5 ±2.5 A
0160KG 0 160 kPa 400 800 ±1.5 ±2.5 A
0250KG 0 250 kPa 400 800 ±1.5 ±2.5 A
1
Overpressure: The maximum pressure which may safely be applied to the product for it to remain in specification once pressure
is returned to the operating pressure range. Exposure to higher pressures may cause permanent damage to the product.
Unless otherwise specified this applies to all available pressure ports at any temperature with the operating temperature range.
The customer’s pressure connection system (tubing or O-rings) must be specified to be equal to, or greater than, the rated
overpressure limit. Due to the possibility of light sensitivity, opaque tubing is recommended.
2
Burst Pressure: The maximum pressure that may be applied to any port of the product without causing escape of pressure media.
Product should not be expected to function after exposure to any pressure beyond the burst pressure.
3
Total Error Band after Customer Auto-Zero: The maximum deviation from the ideal transfer function over the entire
compensated pressure range for a minimum of 24 hours after an auto-zero operation. Includes all errors due to full scale span,
pressure non-linearity, pressure hysteresis, and thermal effect on span. Low pressure MPR sensors may exhibit offset shifts after
reflow solder. See Technical Note “Auto-Zero Calibration Technique for Pressure Sensors” (008326-1-EN) if this shift is significant
in a particular application.
4
Because atmospheric pressure is continually changing, autozeroing an absolute pressure sensor requires a reference standard.
If the actual absolute pressure is important in an application (such as for a barometer), an external precision reference is needed
to set the offset to the correct current value of atmospheric pressure. In applications where the difference between multiple
absolute sensors is important, any reference may be used (such as one of the other absolute pressure sensors in a system, or even
an arbitrary pressure like 14.7 psia), as long as it is consistent and repeatable.

11
Sensing and Internet of Things
MICROPRESSURE BOARD MOUNT PRESSURE SENSORS, MPR SERIES
TABLE 11. PRESSURE RANGE SPECIFICATIONS FOR 1 PSI TO 30 PSI
PRESSURE
RANGE
(SEE
FIGURE 4.)
PRESSURE RANGE UNIT OVER
PRESSURE
1
BURST
PRESSURE
2
TOTAL ERROR
BAND AFTER
CUSTOMER
AUTOZERO
3
(%FSS)
TOTAL
ERROR
BAND,
TYPICAL
(%FSS)
TRANSFER
FUNCTION
P
MIN.
P
MAX.
Absolute
0015PA 0 15 psi 60 120 ±1.5
4
±1.5 A
0025PA 0 25 psi 60 120 ±1.5
4
±1.5 A
0030PA 0 30 psi 60 120 ±1.5
4
±1.5 A
Gage
0001PG 0 1 psi 5 10 ±1.25 ±2.5 C
0005PG 0 5 psi 60 120 ±2.0 2.5 B
0015PG 0 15 psi 60 120 ±1.5 ±2.5 A
0030PG 0 30 psi 60 120 ±1.5 ±2.5 A
1
Overpressure: The maximum pressure which may safely be applied to the product for it to remain in specification once pressure
is returned to the operating pressure range. Exposure to higher pressures may cause permanent damage to the product.
Unless otherwise specified this applies to all available pressure ports at any temperature with the operating temperature range.
The customer’s pressure connection system (tubing or O-rings) must be specified to be equal to, or greater than, the rated
overpressure limit. Due to the possibility of light sensitivity, opaque tubing is recommended.
2
Burst Pressure: The maximum pressure that may be applied to any port of the product without causing escape of pressure media.
Product should not be expected to function after exposure to any pressure beyond the burst pressure.
3
Total Error Band after Customer Auto-Zero: The maximum deviation from the ideal transfer function over the entire
compensated pressure range for a minimum of 24 hours after an auto-zero operation. Includes all errors due to full scale span,
pressure non-linearity, pressure hysteresis, and thermal effect on span. Low pressure MPR sensors may exhibit offset shifts after
reflow solder. See Technical Note “Auto-Zero Calibration Technique for Pressure Sensors” (008326-1-EN) if this shift is significant
in a particular application.
4
Because atmospheric pressure is continually changing, autozeroing an absolute pressure sensor requires a reference standard.
If the actual absolute pressure is important in an application (such as for a barometer), an external precision reference is needed
to set the offset to the correct current value of atmospheric pressure. In applications where the difference between multiple
absolute sensors is important, any reference may be used (such as one of the other absolute pressure sensors in a system, or even
an arbitrary pressure like 14.7 psia), as long as it is consistent and repeatable.
TABLE 12. PRESSURE RANGE SPECIFICATIONS FOR 0 MMHG TO 300 MMHG
PRESSURE
RANGE
(SEE
FIGURE 3.)
PRESSURE RANGE UNIT OVER
PRESSURE
1
BURST
PRESSURE
2
TOTAL ERROR
BAND AFTER
CUSTOMER
AUTOZERO
3
(%FSS)
TRANSFER
FUNCTION
P
MIN.
P
MAX.
Gage
0300YG 0 300 mmHg 3100 6200 ±2.0 B
1
Overpressure: The maximum pressure which may safely be applied to the product for it to remain in specification once pressure
is returned to the operating pressure range. Exposure to higher pressures may cause permanent damage to the product.
Unless otherwise specified this applies to all available pressure ports at any temperature with the operating temperature range.
The customer’s pressure connection system (tubing or O-rings) must be specified to be equal to, or greater than, the rated
overpressure limit. Due to the possibility of light sensitivity, opaque tubing is recommended.
2
Burst Pressure: The maximum pressure that may be applied to any port of the product without causing escape of pressure media.
Product should not be expected to function after exposure to any pressure beyond the burst pressure.
3
Total Error Band after Customer Auto-Zero: The maximum deviation from the ideal transfer function over the entire
compensated pressure range for a minimum of 24 hours after an auto-zero operation. Includes all errors due to full scale span,
pressure non-linearity, pressure hysteresis, and thermal effect on span. Low pressure MPR sensors may exhibit offset shifts after
reflow solder. See Technical Note “Auto-Zero Calibration Technique for Pressure Sensors” (008326-1-EN) if this shift is significant
in a particular application.

12
sensing.honeywell.com
MICROPRESSURE BOARD MOUNT PRESSURE SENSORS, MPR SERIES
1.0 General Information
Please see pages 18-21 for product dimensions, pinouts, tape and reel dimensions, Recommended Pick and Place Geometry, and
recommended tubing.
2.0 Pinout and Functionality (See Table 13.)
TABLE 13. PINOUT AND FUNCTIONALITY
23
4
5
6
789
12
11
10
Gage reference hole (gage option only)
Do not block, keep free of contamination
PAD
NUMBER
NAME DESCRIPTION
1 SS Slave Select: Chip select for SPI sensor
2 MOSI/SDA Master Out Slave In: Data in for SPI sensor; data in/out for I²C sensor
3 SCLK/SCL Clock input for SPI and I²C sensor
4 VO+ V
OUT+
pin in piezoresistive Wheatstone Bridge: Anti-aliasing filter can be connected between VO+ and VO-
5 NC No connection
6 VO- V
OUT-
pin in piezoresistive Wheatstone Bridge: Anti-aliasing filter can be connected between VO- and VO+
7 MISO Master In Slave Out: Data output for SPI sensor
8 EOC
End-of-conversion indicator: This pin is set high when a measurement and calculation have been
completed and the data is ready to be clocked out
9 RES
Reset: This pin can be connected and used to control safe resetting of the sensor. RES is active-low;
a V
DD
-V
SS
-V
DD
transition at the RES pin leads to a complete sensor reset
10 V
SS
Ground reference voltage signal
11 NC No connection
12 V
DD
Positive supply voltage
3.0 Start-Up Timing
On power-up, the MPR Series sensor is able to receive the first command after 1 ms from when the V
DD
supply is within operating
specifications. The MPR Series sensor can begin the first measurement after 2.5 ms from when the V
DD
supply is operational.
Alternatively, instead of a power-on reset, a reset and new power-up sequence can be triggered by an IC-reset signal (high low) at
the RES pin.
4.0 Power Supply Requirement
Verify that system power to the sensor meets the V
DD
rising slope requirement (minimum V
DD
rising slope is at least 10 V/ms). If not,
use the RES pin to bring the sensor out of reset once the system power has stabilized.

13
Sensing and Internet of Things
MICROPRESSURE BOARD MOUNT PRESSURE SENSORS, MPR SERIES
5.0 Reference Circuit Design
5.1 I
2
C and SPI Circuit Diagrams (See Figures 5 and 6.)
FIGURE 5. I
2
C CIRCUIT DIAGRAM
FIGURE 6. SPI CIRCUIT DIAGRAM
5.2 Bypass Capacitor Use
NOTICE
Ensure bypass capacitors are integrated into the end user design to ensure output noise supression.
GND
1
2
3
7
11
8
5
9
VO-
SS
SCL/SCLK
MISO
MPR Series Sensor
V
CC
6
4
MOSI/SDA
VO+
NC
EOC
NC
RES
Optional
Optional
Optional
Optional
1 nF
V
DD
µC
GND
0.1 µF
NC
NC
10
12
10
kOhm
10
kOhm
From µC
To µC
V
SS
GND
1
2
3
7
11
8
5
9
SS
SCL/SCLK
MISO
MPR Series Sensor
V
CC
6
4
MOSI/SDA NC
EOC
NC
RES
Optional
Optional
Optional
Optional
1 nF
V
DD
µC
GND
0.1 µF
10
12
From µC
To µC
VO-
VO+
V
SS

14
sensing.honeywell.com
MICROPRESSURE BOARD MOUNT PRESSURE SENSORS, MPR SERIES
6.0 I
2
C Communications
6.1 I
2
C Bus Configuration (See Figure 7.)
The I
2
C bus is a simple, serial 8-bit oriented computer bus for efficient I
2
C (Inter-IC) control. It provides good support for
communication between different ICs across short circuit-board distances, such as interfacing microcontrollers with various
low speed peripheral devices. For detailed specifications of the I
2
C protocol, see Version 2.1 (January 2000) of the I
2
C Bus
Specification (source: NXP Semiconductor at https://www.nxp.com/docs/en/user-guide/UM10204.pdf).
Each device connected to the bus is software addressable by a unique address and a simple Master/Slave relationship that exists
at all times. The output stages of devices connected to the bus are designed around an open collector architecture. Because of
this, pull-up resistors to +V
DD
must be provided on the bus. Both SDA and SCL are bidirectional lines, and it is important to system
performance to match the capacitive loads on both lines. In addition, in accordance with the I
2
C specification, the maximum
allowable capacitance on either line is 400 pF to ensure reliable edge transitions at 400 kHz clock speeds.
When the bus is free, both lines are pulled up to +V
DD
. Data on the I
2
C bus can be transferred at a rate up to 100 kbit/s in the
standard-mode, or up to 400 kbit/s in the fast-mode.
FIGURE 7. I
2
C BUS CONFIGURATION
Master
(Serial Clock Line)
(Serial Data Line)
Pull-up resistors
R
p
R
p
+V
DD
Slave 1 Slave 2 Slave 3
SCL
SDA
6.2 I
2
C Data Transfer
The MPR Series I
2
C sensors are designed to work as Slaves and will therefore only respond to requests from a Master device.
Following the address and read bit from the Master, the MPR Series sensors are designed to output up to 4 bytes of data. The first
data byte is the Status Byte (8-bit) and the second to fourth bytes are the compensated pressure output (24-bit).
6.3 I
2
C Sensor Address
Each MPR Series I
2
C sensor is referenced on the bus by a 7-bit slave address. The default address for the MPR Series is 24 (0x18).
Other available standard addresses are: 08 (0x08), 40 (0x28), 56 (0x38), 72 (0x48), 88 (0x58), 104 (0x68), 120 (0x78). (Other
custom values are available. Please contact Honeywell Customer Service with questions regarding custom Slave addresses.)

15
Sensing and Internet of Things
MICROPRESSURE BOARD MOUNT PRESSURE SENSORS, MPR SERIES
6.4 I
2
C Pressure Reading
To read out a compensated pressure reading, the Master generates a START condition and sends the sensor Slave address
followed by a read bit (1). After the sensor generates an acknowledge, it will transmit up to 4 bytes of data. The first data byte is the
Status Byte (8-bit) and the second to fourth bytes are the compensated pressure output (24-bit). The Master must acknowledge
the receipt of each byte, and can terminate the communication by sending a Not Acknowledge (NACK) bit followed by a Stop bit
after receiving the required bytes of data.
6.5 I
2
C Status Byte (See Table 14.)
TABLE 14. I
2
C STATUS BYTE EXPLANATION
BIT (MEANING) STATUS COMMENT
7 always 0 —
6 (Power indication)
1 = device is powered
0 = device is not powered
Needed for the SPI Mode where the Master reads all zeroes
if the device is not powered or in power-on reset (POR).
5 (Busy flag) 1 = device is busy
Indicates that the data for the last command is not yet
available. No new commands are processed if the device is
busy.
4 always 0 —
3 always 0 —
2 (Memory integrity/error flag)
0 = integrity test passed
1 = integrity test failed
Indicates whether the checksum-based integrity check
passed or failed; the memory error status bit is calculated
only during the power-up sequence.
1 always 0 —
0 (Math saturation)
1 = internal math saturation has
occurred
—
6.6 I
2
C Communications
6.6.1 I
2
C Output Measurement Command
To communicate with the MPR Series I
2
C output sensor using an Output Measurement Command of “0xAA”, followed by “0x00”
“0x00”, follow the steps shown in Table 15. This command will cause the device to exit Standby Mode and enter Operating Mode. At
the conclusion of the measurement cycle, the device will automatically re-enter Standby Mode.
TABLE 15. I
2
C OUTPUT
MEASUREMENT COMMAND
STEP ACTION NOTES
1
S SlaveAddr A0Command A
AP
Write bit
7-bit
CmdData
<15:8>
A
CmdData
<7:0>
S
P
Master to Slave
Slave to Master
Start condition
Stop condition
A
N
Acknowledge
Not acknowledge
2
Option 1: Wait until the busy flag in
the Status Byte clears.
S
SlaveAddr
A
1
Status
N
P
Read bit
7-bit
Option 2: Wait for at
least 5 ms for the data
conversion to occur.
Option 3: Wait for the
EOC indicator.
3
To read the 24-bit pressure output along with the 8-bit Status Byte
S
SlaveAddr
A
1
Status
A
SensorDat
<23:16>
A
NP
SensorDat
<15:8>
A
SensorDat
<7:0>
Read bit
7-bit

16
sensing.honeywell.com
MICROPRESSURE BOARD MOUNT PRESSURE SENSORS, MPR SERIES
6.6.2 I
2
C Slave Address of 0x18
To communicate with the MPR Series I
2
C output sensor with an I
2
C Slave Address of 0x18 (hex), follow the steps shown in Table 16.
TABLE 16. I
2
C SLAVE ADDRESS OF 0X18 COMMUNICATIONS
STEP ACTION NOTES
1
S SlaveAddr A0Command A
AP
Write bit
0x30 0xAA 0x00
CmdData
<15:8>
A
CmdData
<7:0>
0x18
0
0x00
S
P
Master to Slave
Slave to Master
Start condition
Stop condition
A
N
Acknowledge
Not acknowledge
2
Option 1: Wait until the busy flag in
the Status Byte clears.
S
SlaveAddr
A
1
Status
N
P
Read bit
0x31
0x18
1
Option 2: Wait for at
least 5 ms for the data
conversion to occur.
Option 3: Wait for the
EOC indicator.
3
To read the 24-bit pressure output along with the 8-bit Status Byte:
6.7 I
2
C Timing and Level Parameters (See Table 17.)
TABLE 17. I
2
C BUS TIMING DIAGRAM AND PARAMETERS
SDA
SCL
t
LOW
t
SUDAT
t
HDSTA
t
HDDAT
t
HIGH
t
SUSTA
t
HDSTA
t
SUSTO
t
BUS
CHARACTERISTIC ABBREVIATION MIN. T YP. MAX. UNIT
SCLK clock frequency f
SCL
100 — 400 kHz
Start condition hold time relative to SCL edge t
HDSTA
0.1 — — μs
Minimum SCLK clock low width
1
t
LOW
0.6 — — μs
Minimum SCLK clock high width
1
t
HIGH
0.6 — — μs
Start condition setup time relative to SCL edge t
SUSTA
0.1 — — μs
Data hold time on SDA relative to SCL edge t
HDDAT
0 — — μs
Data setup time on SDA relative to SCL edge t
SUDAT
0.1 — — μs
Stop condition setup time on SCL t
SUSTO
0.1 — — μs
Bus free time between stop condition and start condition t
BUS
2 — — μs
Output level low Out
low
— 0 0.2 V
DD
Output level high Out
high
0.8 1 — V
DD
Pull-up resistance on SDA and SCL R
p
1 — 50 kOhm
1
Combined low and high widths must equal or exceed minimum SCLK period.
S
SlaveAddr
A
1
Status
A
SensorDat
<23:16>
A
NP
SensorDat
<15:8>
A
SensorDat
<7:0>
Read bit
0x31
0x18
1

17
Sensing and Internet of Things
MICROPRESSURE BOARD MOUNT PRESSURE SENSORS, MPR SERIES
7.0 SPI Communications
7.1 SPI Definition
The Serial Peripheral Interface (SPI) is a simple bus system for synchronous serial communication between one Master and one
or more Slaves. It operates either in full-duplex or half-duplex mode, allowing communication to occur in either both directions
simultaneously, or in one direction only. The Master device initiates an information transfer on the bus and generates clock and
control signals. Slave devices are controlled by the Master through individual Slave Select (SS) lines and are active only when
selected. The MPR Series SPI sensors operate in full-duplex mode only, with data transfer from the Slave to the Master. This data
transmission uses four, unidirectional bus lines. The Master controls SCLK, MOSI and SS; the Slave controls MISO. (See Figure 8.)
FIGURE 8. SPI BUS CONFIGURATION
7.2 SPI Data Transfer
Starting communication with the MPR Series SPI sensors begins by de-asserting the Slave Select (SS) line. At this point, the sensor
is no longer idle, and will begin sending data once a clock is received. MPR Series SPI sensors are configured for SPI operation in
mode 0 (clock polarity is 0 and clock phase is 0). (See Figure 9.)
FIGURE 9. EXAMPLE OF 1 BYTE SPI DATA TRANSFER
SS
SCLK
MSB LSBBit6 Bit5 Bit4 Bit3 Bit2 Bit1
MSB LSBBit6 Bit5 Bit4 Bit3 Bit2 Bit1
MOSI
MISO
Once the clocking begins, the MPR Series SPI sensor is designed to output up to 4 bytes of data. The first data byte is the Status
Byte (8-bit) and the second to fourth bytes are the compensated pressure output (24-bit).
7.3 SPI Pressure Reading
To read out a compensated pressure reading, the Master generates the necessary clock signal after activating the sensor with the
Slave Select (SS) line. The sensor will transmit up to 4 bytes of data. The first data byte is the Status Byte (8-bit) and the second to
fourth bytes are the compensated pressure output (24-bit). The Master can terminate the communication by stopping the clock
and deactivating the SS line.
SCLK
MISO
SS1
SS2
SS3
Master
SCLK
MISO
SS
MOSI
MOSI
Slave 1
Slave 2
Slave 3
SCLK
MISO
SS
MOSI
SCLK
MISO
SS
MOSI
Data Transmission Lines
SCLK: Signal Clock
MOSI: Master Out/Slave In
MISO: Master In/Slave Out
SS: Slave Select

18
sensing.honeywell.com
MICROPRESSURE BOARD MOUNT PRESSURE SENSORS, MPR SERIES
7.4 SPI Status Byte
The SPI status byte contains the bits shown in Table 16.
7.5 SPI Communication
To communicate with the MPR Series SPI output sensor using an Output Measurement Command of “0xAA”, followed by “0x00”
“0x00”, follow the steps shown in Table 18 This command will cause the device to exit Standby Mode and enter Operating Mode. At
the conclusion of the measurement cycle, the device will automatically re-enter Standby Mode.
TABLE 18. SPI OUTPUT MEASUREMENT COMMAND
STEP ACTION NOTES
1
The data on MISO depend on the preceding command. Discard the data on the MISO line.
CmdData
<15:8>
0xAA
CmdData
<7:0>
Command
other than
NOP
Data Data
Status
0x00 0x00
MOSI
MISO
Master to Slave
Slave to Master
• NOP Command is
“0xF0”.
2
Option 1: Wait until the
busy flag in the Status Byte
clears.
0xF0
Command
= NOP
Status
MOSI
MIS
O
Option 2: Wait for at least 5
ms for the data conversion
to occur.
Option 3: Wait for the EOC
indicator.
3
To read the 24-bit pressure output along with the 8-bit Status Byte:
00
Hex
0xF0
00
Hex
Command
= NOP
SensorDat
<24:16>
Status
0x00 0x00
MOSI
MISO
00
Hex
0x00
SensorDat
<15:8>
SensorDat
<7:0>
7.6 SPI Timing and Level Parameters (See Table 19.)
TABLE 19. SPI BUS TIMING DIAGRAM AND PARAMETERS
CHARACTERISTIC ABBREVIATION MIN. T YP. MAX. UNIT
SCLK clock frequency f
SCL
50 — 800 kHz
SS drop to first clock edge t
HDSS
2.5 — — μs
Minimum SCLK clock low width
1
t
LOW
0.6 — — μs
Minimum SCLK clock high width
1
t
HIGH
0.6 — — μs
Clock edge to data transition t
CLKD
0 — — μs
Rise of SS relative to last clock edge t
SUSS
0.1 — — μs
Bus free time between rise and fall of SS t
BUS
2 — — μs
Output level low Out
low
— 0 0.2 V
DD
Output level high Out
high
0.8 1 — V
DD
1
Combined low and high widths must equal or exceed minimum SCLK period.
SCLK
MOSI/MISO
SS
HiZHiZ
t
LOW
t
HIGH
t
HDSS
t
BUS
t
SUSS
t
CLKD
t
CLKD

19
Sensing and Internet of Things
MICROPRESSURE BOARD MOUNT PRESSURE SENSORS, MPR SERIES
8.0 MPR Series Sensor Output Pressure Calculation
The MPR Series sensor output can be expressed by the transfer function of the device as shown in Equation 1:
Equation 1: Pressure Sensor Transfer Function
Rearranging this equation to solve for Pressure, we get Equation 2:
Equation 2: Pressure Output Function
Where:
Output
max.
= output at maximum pressure [counts]
Output
min.
= output at minimum pressure [counts]
P
max.
= maximum value of pressure range [bar, psi, kPa, etc.]
P
min.
= minimum value of pressure range [bar, psi, kPa, etc.]
Pressure = pressure reading [bar, psi, kPa, etc.]
Output = digital pressure reading [counts]
Example: Calculate the pressure for a -1 psi to 1 psi gage sensor with a 10% to 90% calibration, and a pressure output of
14260634 (decimal) counts:
Output
max.
= 15099494 counts (90% of 2
24
counts or 0xE66666)
Output
min.
= 1677722 counts (10% of 2
24
counts or 0x19999A)
P
max.
= 1 psi
P
min.
= -1 psi
Pressure = pressure in psi
Output = 14260634 counts
(14260634-1677722) * (1 - ( - 1))
+ (-1)
15099494 - 1677722
Pressure =
25165824
+ (-1)
13421772
Pressure =
Output
max.
- Output
min.
P
max.
- P
min.
Output =
*
(Pressure - P
min.
) + Output
min.
(Output - Output
min.)
+ P
min.
Output
max.
- Output
min.
Pressure =
*
(P
max.
- P
min.
)
Pressure = 0.875 psi

20
sensing.honeywell.com
MICROPRESSURE BOARD MOUNT PRESSURE SENSORS, MPR SERIES
FIGURE 10. LONG PORT AND RECOMMENDED PCB PAD LAYOUT DIMENSIONS (FOR REFERENCE ONLY: MM [IN].)
Absolute Gage
Recommended PCB Pad Layout
Sensor
/