Page is loading ...

AccuTest Gas Turbine Meter
Installation Instructions

10
4
Service
OPERATION –
Automatic Proving Mode
The EFC C/P automatically proves the meter at the preprogrammed
interval, at whatever flow and line pressure exists at the time. Since
changes in the turbine meter’s friction level will generally have more
effect at low flow rates, it may be advisable to program the proving
cycle during overnight low flow periods. Recommended test flow
rates for turbine meters are 10% to 15% of maximum capacity.
When the proving cycle is complete, the date, time, flow rate and
meter accuracy are stored in memory in a proving file. This data can
be downloaded into a laptop along with the base volume history file
or remotely via a modem.
Manual Proving Mode
Manual proving is conducted using the keypad inside the EFC C/P
cover, Figure 16. The advantages of manual proving are: (a) it allows
the meter flow rate to be adjusted to 10-15% of capacity (where by-
pass piping or multiple runs exist) to obtain good low end performance
testing and (b) it allows the meter to be tested at more than one flow
rate if desired.
Procedure:
1. Press “Ent” if the unit is asleep. If the unit enters the alarm
mode, press “Ent” to clear the alarm or arrow down (↓) to skip.
Press “Esc” to exit alarm mode without clearing alarms.
2. Press “Conf” to enter configuration mode.
3. Press “F5” to move to the Rate Trigger parameter.
4. Press “Edit”, then press F1 to energize the sensors, and press
“Ent”.
5. Press “F6” to view the flow rate through the meter, Figure 17.
The flow rate display updates every 4 seconds as the by-pass
valve setting is changed.
6. When the desired flow rate is achieved, press “F8” to move to
the Manual Proving Trigger parameter.
7. Press “Edit”, then “F1” to set the trigger, and press “Ent”.
8. The proving process begins – wait approximately 30 seconds.
9. Press “F7” to view the percent accuracy of the meter, Figure 18.
The EFC C/P stores the test results in memory; percent accuracy,
flow rate, time and date.
To conduct the accuracy test at another flow rate, repeat the steps
above.
When completed, close the cover and lock the clasp. The unit returns
to sleep after 2 minutes.
SERVICE
The EFC C/P is normally battery powered, Figure 19. The life of the
batteries will partly depend on the frequency of the proving process.
The EFC C/P will show an alarm display when the battery needs to be
replaced. The EFC C/P requires battery pack Part No. 40501 P002.
For any other service, including a periodic check of the P and T
transducers, refer to the EFC operating manual.
Figure 17
Figure 18
Figure 19
Figure 16 AE 5000 C/P Keypad
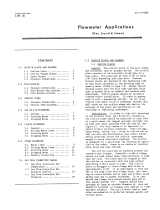
3
Table Of Contents
Introduction
General Description . . . . . . . . . . . . . . . . . . . . . . . . . 4
Theory Of Operation . . . . . . . . . . . . . . . . . . . . . . . . . 4
Installation
AccuTest Meter . . . . . . . . . . . . . . . . . . . . . . . . . . . . . 5
Optional Installations . . . . . . . . . . . . . . . . . . . . . . . . 5
AccuTest Laptop Proving System . . . . . . . . . . . . . . . 7
Operation
Conducting An AccuTest Meter Accuracy Test . . . . . 8
EFC Corrector/Prover Proving System (EFC-C/P) . . . 9
Automatic Proving Mode . . . . . . . . . . . . . . . . . . . . 10
Manual Proving Mode . . . . . . . . . . . . . . . . . . . . . . . 10
Service
Battery Replacement . . . . . . . . . . . . . . . . . . . . . . . 10

4
1
Introduction
GENERAL DESCRIPTION
The AccuTest meter is a new type of turbine meter that evaluates the
meter’s accuracy under actual operating conditions, using recognized
transfer proving techniques. The meter is specially suited for evaluat-
ing the effects of mechanical friction or damage and installation effects
or flow blockage causing swirl.
An AccuTest meter contains both a removable measurement cartridge
and a master or reference meter in the outlet section, as shown in
Figure 1. Inductive type proximity sensors create high frequency
pulses as the blades of each aluminum rotor pass the sensors.
Connecting these pulse outputs through a signal conditioner to a
laptop computer or to a Corrector/Prover creates a transfer proving
system for on-site, in-line proving (Figures 2 and 3).
THEORY OF OPERATION
The accuracy of the measurement cartridge is calculated using
Equation 1, which is similar to the standard transfer proving equation
except that no delta P or delta T correction is required.
F main K ref
Equation (1) ACCURACY = x x A(m)
F ref K main
In the AccuTest equation, pulse frequencies are used instead of
counting the number of pulses from the field and reference meters.
The second term, the ratio of K factors, is similar to the reference
meter correction factor used with conventional transfer provers.
These K factors are obtained from the meter calibration sheet at
various flow rates and at (or near) the expected working pressure.
A meter’s K factors, by definition, are pulses per cubic foot or cubic
meter that normalize the meter’s electronic pulse output to zero error.
The final term in the equation is A(m), the mechanical output shaft
accuracy listed at various flow rates on the calibration sheet. A(m) is
used to calculate the accuracy of the meter’s mechanical output
drive. This term is not required when computing the meter’s elec-
tronic output accuracy from pulse streams fed to a flow computer.
Example:
The test certificate of a 4-inch AccuTest meter with a 30 degree rotor
lists the main and reference rotor K factors at 15% of capacity as
178.65 and 135.40 pulses/cf, respectively. The mechanical drive
output accuracy is 100.25% and is dependent on the output change
gears selected.
The main and reference rotor pulse frequencies when factory tested
at 15% of capacity are 171.20Hz and 129.75Hz.
Inserting these values into the equation:
171.20 135.40
ACCURACY = x x 100.25 = 100.25
129.75 178.65
(Term 1) (Term 2) (Term 3)
For a new meter, Term 1 x Term 2 will always equal 1.00. Term 3
accounts for the error related to the selection of change gears and
will vary slightly with flow rate.
After an extended period of service the meter is field tested again at
15% of capacity. A build up of mechanical friction in the gear train
now retards the main rotor rotation. As a result, the main rotor pulse
High Frequency
Inductive Type Pulsers (2)
Interchangeable
Pre-calibrated
Measurement Cartridges
Reference Meter
for long-term accuracy
Figure 3
Figure 2
Figure 1
9
3
Operation
You may enter an elevated test pressure between P1 and P2.
Example: If P1 is 60 psi and P2 is 100 psi and the actual meter
pressure is 80 psi at the time of the test, enter 80 psi in the Ptest
window. The program will interpolate the proper K-factor for that
pressure and flow rate.
Click on the “Run” arrow to start the accuracy test, which takes
30 seconds.
Once the low flow rate test is complete, the test can be re-run at
that same rate or at a different rate. Testing the meter at higher
flow rates will detect installation effects. To retest at a different
flow rate, return to the main menu and click on F3. (Or, just
change the by-pass valve setting and wait for the flow rate
display to change.)
Note: The laptop will abort the test if the flow rate through the
meter changes by more than 5% during the 30-second proving
cycle. A warning will also appear on the screen. Repeat the test
until successful.
F. Meter accuracy, flow rate, time and date may be saved to the
laptop’s hard drive or to a disk. (Install a blank disk into the A drive.)
The program will ask for a directory to save the file. Type in a:\ for
disk or c:\ for hard drive.
EFC Corrector/Prover Proving System (EFC C/P)
Installation
Mount the EFC C/P on the AccuTest meter so that the meter output
shaft aligns with the EFC C/P input shaft and with the base plate
gasket in place, Figure 15. Fasten the unit with (4) screws provided.
Connect the yellow cable exiting the right side of the EFC C/P case
to the downstream (reference rotor) sensor. The left hand cable
connects to the upstream (main rotor) sensor.
Description
An EFC C/P Proving System allows the AccuTest meter to be proved
both automatically and manually. To perform the proving function,
the EFC C/P is built with an on-board signal conditioner/barrier to
receive pulses from the meter sensors. The EFC C/P is programmed
to calculate meter accuracy using Equation 1. (It includes the Am
term for mechanical accuracy since the corrector is mechanically
driven.) Energy to power the rotor sensors during the accuracy test
is obtained from the EFC C/P power supply.
The EFC C/P is factory programmed and tested with the AccuTest
meter as a system. In addition to the base condition programming,
the EFC C/P is programmed with the meter accuracy values and
K factors at six flow rates and at one or more test pressures. The
EFC C/P will automatically interpolate for intermediate flow rates and
pressures. The EFC prover programming can be changed on site using
either a laptop with Meter Reader software or the EFC C/P internal
keypad, Figure 16. Refer to the EFC C/P manual for instructions.
Other set-up parameters of the EFC C/P include a maximum allowable
error limit between the main rotor and the reference rotor; the date and
time of the automatic proving process such as daily, weekly, monthly,
etc.; the maximum change in flow rate allowed during the proving cycle
before the test aborts; the maximum allowable change in pressure
before the proving cycle aborts; and the number of minutes and
times between retests.
Figure 15 AE 5000 Corrector/Prover
Figure 13 Data Entry Screen
Figure 14 Accuracy Calculation Screen

7
2
Installation
2
Installation
INSTALLATION/SET-UP –
AccuTest Laptop Proving System
The AccuTest Field Prover System consists of (a) two 20-foot sensor
cables, (b) a signal conditioner case (which includes a battery pack to
power the sensors), (c) a data acquisition (DAQ) card, (d) a computer
interface cable that connects to the DAQ card, (e) a disk that contains
the executable (proving) program, drivers and individual meter data
such as the meter serial numbers, K-factors, etc., and (f) 11 disks
containing the NIDAQ software needed to configure the DAQ card.
Loading The AccuTest Software
Note: The AccuTest Proving System requires a laptop with a 486 drive
or better, 12mB of memory, a PC card slot and a math co-processor.
The operating system is Windows 3.1 or Windows 95.
1. From the Windows 95 or 3.1 file manager, install the NIDAQ soft-
ware following the instructions given in the installation procedure
provided. In most, but not all cases, all 11 disks will be requested
during the installation. After installation, re-boot the computer and
launch the NIDAQ software.
Windows 95 will automatically configure the DAQ card; however,
Windows 3.1 requires that configuration parameters be set. To set
parameters, open WDAQCONFIG and configure the DAQ card for
the correct PCMCIA port.
Open NIDAQ configuration utility. Click on Device #1, toggle down
to DAQ Cards, click, toggle to DAQ-700, click. Select Socket O and
hit OK. Click on Configuration and Save. Click on Configuration
and Return. Close NIDAQ Utility.
2. Next, install the disk containing the executable file (Serial#.ZIP),
drivers (SERPDRV, DAQDRV, and LVDEVICE.DLL) and PKUNZIP.EXE.
A suggested directory name is C:\ACCU. “Serial#.ZIP” is the serial
number on the badge of the AccuTest meter cartridge.
Use PKUNZIP.EXE to inflate the executable by typing:
PKUNZIP Serial#.ZIP Serial.EXE.
Repeat Step 2 for each additional AccuTest meter disk; one per
meter.
Hardware Installation
3. Insert the DAQ card into the PC card slot.
4. Connect the cable to the flat connector of the signal conditioner/
power supply box, as shown in Figure 9. Note the key in the strip
connector for proper orientation.
5. Connect the 20-foot yellow cables from the meter to the signal
conditioner box, being careful of the main and reference rotor
positions. The reference rotor sensor is closest to the meter outlet.
6
Short Coupled Installation
This configuration uses a minimum of 4 pipe diameters ahead of the
meter with straightening vanes a minimum of 2 pipe diameters from
the meter inlet, Figure 7. The meter is connected to vertical risers
using a standard tee, as shown, to minimize jetting.
The maximum pipe reduction to the risers is one nominal pipe size.
Valving, filters or strainers may be installed in the risers.
Close Coupled Piping
This installation would be used where the available space is critical
and design considerations have eliminated jetting and abnormal swirl
conditions. The meter is connected to vertical risers using a tee as
shown. The maximum pipe reduction to risers is one pipe size.
Valving, filters or strainers may be installed in the risers.
Strainers or Filters – Caution
Important: Foreign matter in a pipe line, such as welding slag, can
cause SERIOUS damage to turbine meters. Upstream piping must
be cleared of all foreign matter before the meter is installed and
commissioned.
Strainers are recommended where large particles may be present in
the piping. They should be selected to operate with low flow distortion.
Filters are recommended where wide pressure fluctuations and dust
are present in the pipe. Monitor the pressure drop across the filter to
determine the need to replace the filter element.
Over-Range Protection
Turbine meters can be operated up to 150% of capacity for short
periods with no damaging effects. However, line blowdowns can cause
severe over-ranging of the turbine rotor, causing possible rotor and/or
bearing damage. In those installations where adequate pressure is
available, either a critical flow orifice or a sonic nozzle may be installed
downstream of the meter. It should be sized to limit the meter to
approximately 120% of the meter’s rated capacity.
By-Pass Piping
By-pass piping will allow the meter to be maintained and calibrated
without a service interruption. This should include proper valving
relative to the calibration equipment used.
Additional Installation Reminders
Minimize pipe stresses on the meter.
Make certain piping and gaskets are aligned properly to avoid
possible errors caused by jetting.
No welding should be done in the immediate area of the meter.
Where liquids may be present, do not install the meter in the low
point in the line.
When installation is complete, pressurize the meter slowly and bring
the meter up to speed gradually. Shock loading by opening valves
quickly will usually result in rotor damage. Perform a leak test with a
bubble solution or other approved method.
Lubricate the meter within the first six months of operation with the
recommended oil – Anderol #401-D.
DAQ CARD 700
LAPTOP COMPUTER
SHIELDED
RIBBON CABLE
ATP.
BATTERY PACK
(24V.)
REFERENCE ROTOR
SENSING CABLE
ACCUTEST TURBINE
MAIN ROTOR
SENSING CABLE
KEY
ON/OFF
INDUCTIVE
PROXIMITY
SENSORS
FLOW
Figure 9 Laptop Proving Setup
90° Elbow
Temperature
Well
Gas
Turbine
Meter
2 Nominal
Pipe Diameters
Spool Assembly
4 Nominal Pipe
Diameters Long
Inlet
Straightening
Vanes
Minimum
Space for Valving
Filter or Strainer
90° Elbow
or Tee
Space for Valving
90° Elbow
or Tee
Maximum
Reduction
One Nominal
Pipe Size
Figure 7
90° Elbow
Temperature
Well
Gas
Turbine
Meter
Inlet
Space for Valving
Filter or Strainer
Space for Valving
90° Elbow
or Tee
Maximum
Reduction
One Nominal
Pipe Size
Figure 8
Short Coupled Installation of an
In-Line Gas Turbine Meter (Minimum Lengths)
Close Coupled Installation of an In-Line Gas
Turbine Meter with Integral Straightening Vanes

8
3
Operation
OPERATION –
Conducting An AccuTest Meter Accuracy Test
A. Turn on the laptop and the power switch of the signal conditioner
box which energizes the rotor sensors. From the File Manager screen
select the “Accu” directory and then the serial number of the
meter to be tested. The executable Main Menu appears, Figure 10.
B. Click on the left hand box, “Check For Bent or Broken Rotor
Blades” or press F1. Figure 11 is a square wave trace that shows
the condition of the rotor blades. Click on the icon at the left of the
screen to toggle from the main rotor to the reference rotor. Each
screen should show at least 14 blade traces. If not, adjust the
display by using the “scan rate” icon. Place the pointer on the
knob and adjust CW or CCW with the mouse until at least 14
blade traces are showing. On this screen, a missing trace (a blank
space between traces) represents a bent or missing rotor blade.
If no blade traces are missing, return to the main menu by pressing
“Enter”.
C. From the main menu screen, click on “Monitor Flow Rate” box or
press F2. Figure 12 shows an analog display of flow rate in percent
of capacity, which is updated every 2 seconds. A turbine meter
accuracy test should be conducted at about 10% of capacity to
detect any change in the meter’s friction level. Testing a turbine
meter at 40% of capacity or greater will often mask any friction
changes in the meter. Open the bypass valve until a flow rate of
10 to 15% is achieved. Return to the main menu.
D. Click on “View Original Data” or press F4. This brings up the data
entry screen which displays meter parameters such as K-factors for
each rotor, the initial meter accuracy at various flow rates, meter
size, serial numbers, etc., Figure 13. Check this data against the
calibration sheet supplied with the meter.
The original factory test pressure(s) P1 and P2 are displayed in
the upper right hand corner of the screen. They may be both
atmospheric pressures, .2 psi (which means there was no elevated
pressure test); both elevated pressures (example: 60 and 100 psi)
or one at atmospheric pressure and the other at elevated pressure.
The K-factors shown at the bottom of this screen are values
relating to the test flow rate selected in Step C above and are
interpolated for any flow rate selected in Step C that is between
the original test flow rates.
Return to the main menu.
E. Click on “Check Meter Accuracy” or F3 to bring up the accuracy
calculation screen, Figure 14.
This screen will display the current meter accuracy, the change in
accuracy from its original value and the flow rate in MACFH. Also
displayed is a pass/fail indicator based on the error limit set on
the meter data screen.
Note: The screen shows a “Ptest” display, the pressure at which
the accuracy test is to be conducted. The default value shown is
the pressure P2 on the Data Entry Screen, Figure 13, which is the
meter operating pressure. If you are proving the meter at atmos-
pheric pressure, enter .2 psi in the Ptest display using the mouse
to click in the window and keying in the pressure. This will allow
the laptop to use the atmospheric K-factors for this test, but does
not lock in the Ptest value.
Figure 11 Display of Rotor Blade Traces
Figure 12 Flow Rate Display
Figure 10 Main Menu
5
2
Installation
frequency decreases to 170.77, a change of 0.25%. Substituting this
value into the Equation 1 and recalculating the output drive accuracy:
170.77 135.40
ACCURACY = x x 100.25 = 100.00%
129.75 178.65
In this example, the speed of the main rotor is reduced by friction
which reduces its pulse output frequency. The reference rotor, which
is unaffected by the friction buildup, continues at a pulse frequency
of 129.75. Since the ratio of frequencies has changed, the calculated
accuracy changes. (Note: The K factors remain constants in the
calculation and are only changed if the main and/or reference
meters are rebuilt and retested.)
Use Of The Equation With Flow Computers
In a flow computer application, the base volume calculation is not
influenced by the mechanical output drive accuracy, but rather the
high frequency pulse output. Therefore, the equation used by a flow
computer does not include the A(m) term. In the above example, the
accuracy calculation for the electronic output would change from
100.00% to 99.75% under the conditions given.
INSTALLATION –
AccuTest Meter
AccuTest meters in sizes from 4" through 8" have ANSI 150, 300 or
600 flanges, depending on the pressure rating and are designed for
horizontal installations.
Recommended turbine meter installation requires a minimum of 10
pipe diameters upstream, with straightening vanes located 5 pipe
diameters from the meter inlet as shown in Figure 4. A length of 5 pipe
diameters is recommended downstream of the meter. Both inlet and
outlet piping should be the same nominal size as the meter.
The purpose of the 10 diameters of straight inlet piping is to remove
jetting and swirl from the gas stream before the gas reaches the
turbine rotor.
Jetting, shown in Figure 5, is non-uniform gas velocity within the pipe,
and can be caused by an upstream regulator, a valve, an elbow or a
misaligned flange gasket. Jetting will cause the meter to over-register
since the rotor responds to the higher, not the average velocity, in the
pipe. For this reason, temperature wells and pressure taps should be
located in the downstream piping. Any pressure tap fitting in the
upstream piping should be ground flush with the inside pipe wall.
Swirl, Figure 6, is a condition where the gas velocity is not totally parallel
to the axis of the pipe, but has a spiral component. It may be caused
by upstream valves, elbows or other fittings. Swirl in the direction of the
rotor rotation will cause the turbine meter to over-register and vice-versa.
Optional Installations
The following installations may result in some degradation in meter
accuracy, and should only be used where space does not permit the
recommended installation shown in Figure 4.
5 Nominal
Pipe Diameters
Temperature Well
Gas
Turbine
Meter
5 Nominal
Pipe Diameters
10 Nominal Pipe Diameters
Inlet
Straightening
Vanes
Figure 4
Figure 5
Figure 6
Recommended Installation
Jetting
Swirl
/