Page is loading ...

User Bulletin
Applied Biosystems 3130 Series Genetic Analyzers
July 2006
SUBJECT: Performance Verification After Upgrade from
ABI PRISM® 3100 Series Genetic Analyzers
In This User
Bulletin
This user bulletin includes the following topics:
1 Introduction. . . . . . . . . . . . . . . . . . . . . . . . . . . . . . . . . . . . . . . . . . . . . . 2
2 Before Upgrading . . . . . . . . . . . . . . . . . . . . . . . . . . . . . . . . . . . . . . . . . 3
3 Materials and Methods . . . . . . . . . . . . . . . . . . . . . . . . . . . . . . . . . . . . . 4
3.1 Reagents . . . . . . . . . . . . . . . . . . . . . . . . . . . . . . . . . . . . . . . . . . . . .4
3.2 Instruments . . . . . . . . . . . . . . . . . . . . . . . . . . . . . . . . . . . . . . . . . . .4
4 Experimental Setup. . . . . . . . . . . . . . . . . . . . . . . . . . . . . . . . . . . . . . . . 6
5 Data Collection . . . . . . . . . . . . . . . . . . . . . . . . . . . . . . . . . . . . . . . . . . . 9
6 Data Analysis . . . . . . . . . . . . . . . . . . . . . . . . . . . . . . . . . . . . . . . . . . . 10
7 Results and Discussion . . . . . . . . . . . . . . . . . . . . . . . . . . . . . . . . . . . . 11
7.1 Results of a 3100-Avant-to-3130 Instrument Upgrade . . . . . . . . .12
7.2 Results of a 3100-to-3130xl Instrument Upgrade. . . . . . . . . . . . .24
7.3 Results of a 3100-Avant-to-3130xl Instrument Upgrade . . . . . . .36
7.4 Results of a 3130-to-3130xl Instrument Upgrade. . . . . . . . . . . . .48
8 Conclusion . . . . . . . . . . . . . . . . . . . . . . . . . . . . . . . . . . . . . . . . . . . . . 60
9 References. . . . . . . . . . . . . . . . . . . . . . . . . . . . . . . . . . . . . . . . . . . . . . 60

2 Applied Biosystems 3130 Series Genetic Analyzers Performance Verification User Bulletin
1 Introduction
Instrument
Upgrade Paths
The following paths are available to upgrade an ABI PRISM® 3100 or
3100-Avant™ Genetic Analyzer to an Applied Biosystems 3130 or
3130xl Analyzer:
Instrument
Components
Modified
The instrument components modified during the upgrade include:
• Polymer delivery system
• Oven door gasket
• CCD camera shutter
• Detection cell heater
• Data Collection Software upgrade to 3130 Series version
3.0 software
For details on the upgraded components, refer to the Applied
Biosystems 3130/3130xl Genetic Analyzers Using Data Collection
Software v3.0, Protocols for Processing AmpF
l
STR PCR
Amplification Kit PCR Products User Bulletin (PN 4363787).
Performance
Verification
Studies
Performed
Although components of the optical system are not changed during
the upgrade, DAB/SWGDAM guidelines require a performance
verification after an upgrade. The following performance verification
studies ensure that key performance parameters have not changed:
• Sensitivity
• Mixture
• Precision
•Resolution
• Concordance
IMPORTANT! Human identification laboratories should perform
their own performance verification studies.
Instrument Can be upgraded to
3100 3130xl
3100-Avant 3130
3130xl
3130 3130xl

2 Before Upgrading
Applied Biosystems 3130 Series Genetic Analyzers Performance Verification User Bulletin 3
2 Before Upgrading
IMPORTANT! Perform the following steps before upgrading an
instrument:
• Review the Applied Biosystems 3130 and 3130xl Genetic
Analyzer Site Preparation Guide to ensure that the laboratory
environment meets specifications for a 3130 or 3130xl
instrument.
• Back up all sample data. During the upgrade, the instrument
computer is reimaged (all data are erased) before the Data
Collection software is installed. It is not necessary to back up
spatial calibration and spectral calibration files because these
calibrations are performed at the end of the upgrade.

Reagents
4 Applied Biosystems 3130 Series Genetic Analyzers Performance Verification User Bulletin
3 Materials and Methods
3.1 Reagents
To minimize variability between studies, the following setup
procedures were used throughout the study:
• For the sensitivity studies, serial dilutions were prepared from
the quantified stock control DNA (9947A, 007, and 9948) based
on the average concentration determined using the Quantifiler®
Human DNA Quantification Kit and the ABI PRISM® 7000
Sequence Detection System with SDS Software v1.0.
• For all studies, multiple PCR product reactions were pooled to
provide sufficient quantity and minimize variability.
• For all studies, one manufactured lot of each of the following
kits was used:
3.2 Instruments
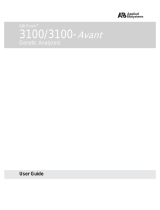
Three instruments of each type were used for each study. Figure 1
shows the instrument upgrade paths, instrument numbers, and the
performance assessment test numbers performed. Table 1 on page 5
explains the performance assessment tests.
Figure 1 Tests performed on each instrument before and after upgrades
Kit AB Part
Number
Quantifiler® Human DNA Quantification Kit 4343895
AmpFlSTR® Identifiler® PCR Amplification Kit 4322288
AmpFlSTR® Profiler Plus® PCR Amplification Kit 4303326
3100-Avant-003
Tes t 1
Upgrade to
3100-Avant-040
3100-Avant-019
3130-003
Tes t 2
3130-040
3130-019
3130xl-003
Tes t 3
3130xl-040
3130xl-019
3100-006
Tes t 4
3100-015
3100-028
3130xl-006
Tes t 5
3130xl-015
3130xl-028
Upgrade to
Upgrade to

3 Materials and Methods
Applied Biosystems 3130 Series Genetic Analyzers Performance Verification User Bulletin 5
Table 1 Performance assessment tests (studies performed in each test: sensitivity,
mixture, precision, resolution, and concordance)
Tes t In s tr u m en t Instrument ID
Numbers Purpose
13100-Avant™ before
upgrade
003, 040, and 019 To generate baseline data on the
3100-Avant Genetic Analyzer before
upgrade.
23130:
• After upgrade from
3100-Avant
and
• Before upgrade to 3130xl
003, 040, and 019 3100-Avant-to- 3130 upgrade: To
generate data using the same studies as
Test 1, then to compare the results from
Test 1 to the results from Test 2.
3130-to-3130xl upgrade: To generate
baseline data on the 3130 Genetic
Analyzer before upgrade.
33130xl after upgrade from
3130
003, 040, and 019 To generate data using the same studies
as Test 1, then to compare the results
from Test 1 to the results from Test 3.
43100 before upgrade 006, 015, and 028 To generate baseline data on the
3100 Genetic Analyzers before upgrade.
53130xl after upgrade from
3100
006, 015, and 028 To generate data using the same studies
as Test 4, then to compare the results
from Test 4 to the results from Test 5.

Instruments
6 Applied Biosystems 3130 Series Genetic Analyzers Performance Verification User Bulletin
4 Experimental Setup
Quantitation All DNA samples were quantitated using the Quantifiler® Human
DNA Quantification Kit according to the protocols defined in the
Quantifiler® Kits User's Guide.
Amplification DNA was amplified:
• By PCR on a GeneAmp® PCR System 9700.
Note: The Aluminum 96-Well GeneAmp® PCR System 9700
Sample Block Module is not supported for use with the
AmpFlSTR® chemistries.
• Using the following kits and reaction volumes according to the
recommended protocols in the AmpFlSTR® user's manuals:
Sensitivity Study Sensitivity studies were run using three different DNA samples: 007,
9947A, and 9948.
When DNA input quantity is low, stochastic PCR effects may result
in heterozygote peak imbalance, possible allele dropout, and low
overall relative fluorescence signal.
Before and after upgrade, sensitivity studies were conducted to
determine the detection capabilities of the instruments. As expected
and reported in Applied Biosystems 3130/3130xl Genetic Analyzers
Using Data Collection v3.0 (PN 4363787), variation in sensitivity
from instrument to instrument was observed.
Kit Reaction Volume
(µL)
AB Part
Number
AmpFlSTR® Identifiler®
PCR Amplification Kit
25 4322288
AmpFlSTR® Profiler Plus®
PCR Amplification Kit
50 4303326

4Experimental Setup
Applied Biosystems 3130 Series Genetic Analyzers Performance Verification User Bulletin 7
Serial dilutions were made with 0.1 mM Na2EDTA (T10E0.1 buffer).
The following DNA input amounts were amplified:
All samples were replicated twice on the plate, and each replicate was
injected three times (for a total of six injections per sample).
The sensitivity study evaluated the following before and after
upgrade of each instrument:
• The ability to detect a full genotype profile in a range of DNA
input amounts, determined by evaluating the number of alleles
that fell below the detection threshold
• Average peak heights
• Average heterozygote peak height ratios
The GeneMapper® ID Software v3.2 analysis threshold for the
sensitivity study was set at 50 RFU (relative fluorescence units).
Peak Height Calculations
Peak heights for all alleles from all samples in a test were used to
calculate a single average peak height value. This average peak
height value was then compared between tests.
To compare peak heights by chemistry, peak heights for all alleles
from all samples in a test run using one chemistry were used to
calculate a single average peak height value. This average peak
height value was then compared between tests performed using the
same chemistry.
Kit DNA Input Amounts Amplified
AmpFlSTR Identifiler PCR
Amplification Kit
• 1.5 ng
• 1.0 ng
• 500 pg
• 250 pg
• 125 pg
AmpFlSTR Profiler Plus PCR
Amplification Kit
• 3.0 ng
• 2.0 ng
• 1.0 ng
• 500 pg
• 250 pg

Instruments
8 Applied Biosystems 3130 Series Genetic Analyzers Performance Verification User Bulletin
Mixture Study DNA samples 9947A and 9948 were used to prepare a set of DNA
mixtures at the following 9947A:9948 ratios: 0:1, 1:1, 2:1, 4:1, 9:1,
and 1:0 (Table 2).
All amplified samples were replicated twice on the plate, and each
replicate was injected three times (for a total of six injections per
sample). The samples were evaluated for the ability to detect the
minor contributor at each ratio.
Total DNA input was 1.5 ng per reaction for the Identifiler® Kit and
3.0 ng per reaction for the Profiler Plus® Kit kit.
The GeneMapper ID Software v3.2 analysis threshold for this study
was set at 50 RFU (relative fluorescence units).
Number of Expected Alleles
The number of expected alleles for mixtures was determined from the
1:1 mixture ratio. When the major and minor contributor shared an
allele, the shared allele was counted as a single allele.
If an allele from the minor contributor fell in the stutter position of an
allele from the major contributor, the allele from the minor
contributor was identified only if its peak height exceeded the stutter
filter threshold. Typically, minor contributor alleles in the stutter
position of a major contributor allele are filtered as stutter in the
1:10 mixture ratio.
Table 2 Mixture composition
Kit Mixture
Ratio
Total Female DNA
Input (ng)
Total Male DNA
Input (ng)
AmpFlSTR
Identifiler
PCR
Amplification
Kit
1:0 1.50 0.00
1:1 0.75 0.75
4:1 1.20 0.30
9:1 1.35 0.15
0:1 0.00 1.50
AmpFlSTR
Profiler Plus
PCR
Amplification
Kit
1:0 3.00 0.00
1:1 1.50 1.50
4:1 2.40 0.60
9:1 2.70 0.30
0:1 0.00 3.00

5 Data Collection
Applied Biosystems 3130 Series Genetic Analyzers Performance Verification User Bulletin 9
Precision Study Allelic ladders from the Identifiler® Kit and Profiler Plus® Kit were
used to calculate the standard deviation of the size (in bp) for each
allele in each allelic ladder. Sixteen replicates of each ladder were
loaded on a 96-well plate, and each replicate was injected three times
(for a total of 48 injections per sample).
Sizing averages were calculated within a run (that is, 16 samples for
the 3100 and 3130xl 16-capillary instruments and four samples for
the 3100-Avant and 3130 4-capillary instruments).
Sizing precision between runs of allelic ladder was not calculated
during this study.
Resolution Study The TH01 locus of the Identifiler® Kit allelic ladder was examined to
evaluate the resolution and detection of alleles differing in size by
1base pair.
Concordance
Study
The genotype results from the sensitivity study were evaluated for
concordance.
5 Data Collection
Data was collected using the following versions of software:
All instruments used the default Run Module with the appropriate
dye set.
Instrument Instrument ID
Numbers
Data Collection
Version
3100-Avant™003 2.0
040 1.0
019 1.0
3100 006 1.1
015 1.1
028 2.0
3130 003, 040, and 019 3.0
3130xl 003, 040, 019,
006, 015, and 028
3.0

Instruments
10 Applied Biosystems 3130 Series Genetic Analyzers Performance Verification User Bulletin
For more information, see:
•User Bulletin ABI PRISM® 3100/3100-Avant™ Genetic Analyzers
Using Data Collection v2.0: Protocols for Processing
AmpFlSTR® PCR Amplification Kit PCR Products
(PN 4350218, Rev. A)
•User Bulletin Applied Biosystems 3130/3130xl Genetic
Analyzers Using Data Collection Software v3.0 (PN 4363787)
• ABI PRISM® 3100 Genetic Analyzer User's Manual
(PN 4315834B)
• Applied Biosystems 3130/3130xl Genetic Analyzers: Getting
Started Guide (PN 4352715)
6 Data Analysis
Initial Data
Compiling and
Analysis
All data were analyzed using GeneMapper® ID Software v3.2 with:
• HID_Advanced Analysis Method
• Peak Detection Threshold of 50 RFU
For information on setting up the analysis method, see the
GeneMapper® ID Software Version 3.1 and 3.2 Human Identification
Analysis Tutorial (P/N 4357520 Rev. A).
Final Data
Analysis
Minitab® Statistical Software was used to:
• Calculate averages
• Generate the box and whisker plots

7 Results and Discussion
Applied Biosystems 3130 Series Genetic Analyzers Performance Verification User Bulletin 11
7 Results and Discussion
Electropherograms in this section were generated using
GeneMapper®ID Software Version 3.2.
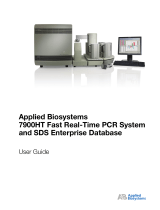
Data plots in this section were generated using Minitab® Statistical
Software and reported in Box-and-Whisker-Plot format (Figure 2).
Figure 2 Box-and-whisker plot elements
Maximum value
Minimum value
75th percentile
Median value
25th percentile
Outliers
where:
• Whiskers extend to the minimum and maximum data values.
• Median = The middle of the data when it is ordered from smallest to largest value.
• 25th percentile (lower quartile) = The median of the lower half of the data.
• 75th percentile (upper quartile) = The median of the upper half of the data.
• Minimum value = The smallest observed value.
• Maximum value = The largest observed value.
• Values beyond the whiskers are outliers. Outliers are unusually large or small
values and are represented as dots on the plot.

Results of a 3100-Avant™-to-3130 Instrument Upgrade
12 Applied Biosystems 3130 Series Genetic Analyzers Performance Verification User Bulletin
7.1 Results of a 3100-Avant™-to-3130 Instrument Upgrade
7.1.1 Sensitivity Study
The sensitivity study evaluated the following before and after
upgrade of each instrument:
• The ability to detect a full genotype profile in a range of DNA
input amounts, determined by evaluating the number of alleles
that fell below the detection threshold
• Average peak heights
• Average heterozygote peak height ratios
Number of Alleles
Below Detection
Threshold
Table 3 shows the number of alleles that fell below the detection
threshold before and after upgrading the 3100-Avant instrument to a
3130 instrument:
• Before upgrade – Sixty four (64) alleles (out of a total of 8725)
alleles fell below the detection threshold (Figure 3).
• After upgrade – Sixty four (64) alleles (out of a total of 9915)
alleles fell below the detection threshold (Figure 4).
As expected, instrument-to-instrument variation was observed
between instruments of the same type before and after upgrade.
Table 3 Sensitivity study – Number of alleles below detection threshold –
3100-Avant™-to-3130 instrument upgrade
Test 1 (before upgrade) Test 2 (after upgrade)
Instruments and
ID Numbers
Number of
Alleles
Below
Detection
Threshold
(50 RFU)
Tot al
Number of
Alleles‡
Upgraded
Instruments
and ID
Numbers
Number of
Alleles
Below
Detection
Threshold
(50 RFU)
Tot al
Number of
Alleles‡
3100-Avant-003 22 3678 3130-003 2 3259
3100-Avant-040 5 3082 3130-040 9 3273
3100-Avant-019 37 1965 3130-019 53 3383
Total 64 8725 Total 64 9915
‡. Data from failed injections not included

7 Results and Discussion
Applied Biosystems 3130 Series Genetic Analyzers Performance Verification User Bulletin 13
Full genotypes were consistently obtained with 250 pg DNA input
amounts for all samples amplified with the Identifiler® and Profiler
Plus® kits before and after upgrading the 3100-Avant instrument to a
3130 instrument. All alleles that fell below the detection limit were
obtained from the 125 pg amplification.
Alleles that fall below the threshold can be caused by:
• Low DNA input, which results in low overall relative
fluorescence
• Stochastic PCR effects, which result in:
– Peak imbalance between the heterozygote alleles
– Allele dropout

Results of a 3100-Avant™-to-3130 Instrument Upgrade
14 Applied Biosystems 3130 Series Genetic Analyzers Performance Verification User Bulletin
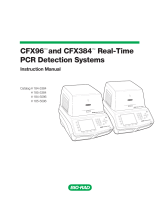
Figure 3 Sensitivity study – Identifiler® Kit electropherograms for a 3100-Avant™
instrument before upgrade (Y-scale is constant in each of the upper panels)
1.5 ng
1.0 ng
0.5 ng
0.25 ng
0.125 ng
GeneMapper® ID Software v3.2 Detection Threshold 50 RFU
Serial dilutions
of 9947A DNA
0.125 ng

7 Results and Discussion
Applied Biosystems 3130 Series Genetic Analyzers Performance Verification User Bulletin 15
Figure 4 Sensitivity study – Identifiler® Kit electropherograms generated on the same
instrument (see Figure 3) after 3100-Avant™-to-3130 instrument upgrade (Y scale is
constant in each of the upper panels)
1.5 ng
1.0 ng
0.5 ng
0.25 ng
0.125 ng
Serial dilutions
of 9947A DNA
GeneMapper® ID Software v3.2 Detection Threshold 50 RFU
0.125 ng

Results of a 3100-Avant™-to-3130 Instrument Upgrade
16 Applied Biosystems 3130 Series Genetic Analyzers Performance Verification User Bulletin
Peak Height A comparison of peak heights for each DNA input amount before and
after instrument upgrade showed little variation in sensitivity (for a
description of how peak heights were evaluated, see page 7):
• Overall, a 1.2% increase in peak heights was observed after
upgrading the 3100-Avant instruments to 3130 instruments.
• Identifiler® Kit data showed a 4.1% decrease in overall peak
height after upgrade (Figure 5).
• Profiler Plus® Kit data showed an 11.2% increase in overall
peak height after upgrade (Figure 6).
Figure 5 Sensitivity study – Comparison of Identifiler® Kit peak
heights by DNA input amount for all samples before (Test 1) and
after (Test 2) 3100-Avant™-to-3130 instrument upgrade

7 Results and Discussion
Applied Biosystems 3130 Series Genetic Analyzers Performance Verification User Bulletin 17
Figure 6 Sensitivity study – Comparison of Profiler Plus® Kit peak
heights by DNA input amount for all samples before (Test 1) and
after (Test 2) 3100-Avant™-to-3130 instrument upgrade
Heterozygote
Peak Height
Ratio
Heterozygote peak height ratios were calculated and plotted for each
DNA sample and concentration in the sensitivity study (for a
description of how peak heights were evaluated, see page 7).
Heterozygote peak height ratios for all loci in the Identifiler® Kit
(Figure 7) and Profiler Plus® Kit (Figure 8) averaged 80% or greater
before and after upgrading the 3100-Avant instruments to 3130
instruments.
Heterozygote peak height ratios below the 70% cutoff before and
after upgrade occurred mainly with lower DNA input amounts
(Figures 9 and 10).
Low heterozygote peak height ratios can be caused by:
• Low DNA input, which results in low overall relative
fluorescence
• Stochastic PCR effects, which result in:
– Peak imbalance between the heterozygote alleles
– Allele dropout

Results of a 3100-Avant™-to-3130 Instrument Upgrade
18 Applied Biosystems 3130 Series Genetic Analyzers Performance Verification User Bulletin
Figure 7 Sensitivity study – Comparison of Identifiler® Kit
heterozygote peak height ratio values by locus for all samples and
DNA input amounts before (Test 1) and after (Test 2)
3100-Avant™-to-3130 instrument upgrade
Figure 8 Sensitivity study – Comparison of Profiler Plus® Kit
heterozygote peak height ratio values by locus for all samples and
DNA input amounts before (Test 1) and after (Test 2)
3100-Avant™-to-3130 instrument upgrade

7 Results and Discussion
Applied Biosystems 3130 Series Genetic Analyzers Performance Verification User Bulletin 19
Figure 9 Sensitivity study – Comparison of Identifiler
®
Kit
heterozygote peak height ratio values by input amount for all
samples before (Test 1) and after (Test 2) 3100-Avant
™
-to-3130
instrument upgrade
Figure 10 Sensitivity study – Comparison of Profiler Plus® Kit
heterozygote peak height ratio values by input amount for all
samples before (Test 1) and after (Test 2) 3100-Avant™-to-3130
instrument upgrade

Results of a 3100-Avant™-to-3130 Instrument Upgrade
20 Applied Biosystems 3130 Series Genetic Analyzers Performance Verification User Bulletin
7.1.2 Mixture Study
Mixed DNA profiles were evaluated, and the number of alleles falling
below 50 RFU was recorded before and after instrument upgrade.
Number of Alleles
Below Detection
Threshold
For a description of how the number of expected alleles was
determined, see page 8.
Table 4 shows the number of alleles that fell below the detection
threshold before and after upgrading the 3100-Avant instrument to a
3130 instrument:
• Before upgrade – Fifty seven (57) alleles (out of a total of 5832)
fell below the detection threshold (Figure 11).
• After upgrade – Thirty eight (38) alleles (out of a total of 5643)
fell below the detection threshold (Figure 12).
The limit of detection of the minor contributor was approximately 9:1
before and after upgrading the 3100-Avant instrument to a
3130 instrument
Table 4 Mixture study – Number of alleles below detection threshold –
3100-Avant™-to-3130 instrument upgrade (data for 1:1 mixture not included)
Test 1 (before upgrade) Test 2 (after upgrade)
Instruments and
ID Numbers
Number of
Alleles
Below
Detection
Threshold
(50 RFU)
Tot al
Number of
Alleles‡
Upgraded
Instruments
and ID
Numbers
Number of
Alleles
Below
Detection
Threshold
(50 RFU)
Tot al
Number of
Alleles‡
3100-Avant-003 12 1944 3130-003 12 1944
3100-Avant-040 33 1944 3130-040 13 1755
3100-Avant-019 12 1944 3130-019 13 1944
Total 57 5832 Total 38 5643
‡. Data from failed injections not included
/