Page is loading ...


2 ProPlex IQ Tester LV User Manual v0.1.1—18 January 2022
ProPlex IQ Tester LV User Manual
Effective 18 January 2022
© Copyright 2022, TMB
All rights reserved
TMB authorizes its customers to download and print this
electronically published manual for professional use only.
TMB prohibits reproduction, modification or distribution
of this document for any other purposes, without express
written consent.
Specifications are subject to change without notice. The
information in this document supersedes all previously
supplied information before the effective date listed
above. TMB has confidence in the accuracy of the
document information herein but assumes no
responsibility or liability for any loss occurring as a direct
or indirect result of errors or exclusions whether by
accident or any other cause.

3 ProPlex IQ Tester LV User Manual v0.1.1—18 January 2022
Overview
True, All-in-One, Handheld Network Tester!
• Complete analysis of active Network streams and devices
• Monitors network activity and bandwidth usage
• Color-coded, scrolling Packet Lister, with touch navigation, shows raw Ethernet packets
• Multicast Stream detection with multicast switch support
• Configurable ICMP Ping sender and responder
• “Protocol Detector” specifically recognizes standard entertainment industry protocols (Dante, ArtNet,
sACN, MANet (2 & 3), HogNet, d3Net, and more)
• PoE detection and analysis of connected sources
• SMPTE LTC Timecode transmitter, receiver, and statistics analyzer
• DMX 512 control and analysis via ArtNet, sACN or standard 5-pin DMX
• DMX Transmission with multiple active universe output and source data editors (touch-sensitive faders,
FX engine, stored scene playback & more)
• Simulate a DMX node by assigning incoming ArtNet or sACN streams to output via 5-pin DMX ports
• Monitor active incoming sources of DMX, ArtNet or sACN with multiple value display formats, plus
flicker-finder and timing statistics
• RDM device monitoring supports most standard PID and “Raw PID” modes for custom messages
• “Smart” DMX cable tester, with pin-to-pin and bandwidth testing

4 ProPlex IQ Tester LV User Manual v0.1.1—18 January 2022

5 ProPlex IQ Tester LV User Manual v0.1.1—18 January 2022
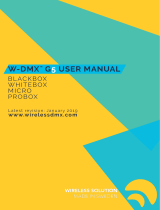
Dimensions in Inches and [mm]

6 ProPlex IQ Tester LV User Manual v0.1.1—18 January 2022
Operation
Powering On and Off
Press and hold the center OK button to power on or
off
the device.
The IQ Tester LV will briefly show a charging animation on the display
to indicate current battery percentage if the device is
off
and
connected to USB.
Navigate using LCD Touchscreen
Navigate between Menu windows using Navigation pad.
• Press LEFT/RIGHT to switch between MENU windows.
• Press OK to highlight an item. Highlighted item flashes with blue
background. Press OK again to confirm the highlighted item.
• Press Down to return to Main Menu

7 ProPlex IQ Tester LV User Manual v0.1.1—18 January 2022
Status bar
In Main Menu top of the screen will show a custom ownership message (if set)
ArtN TX - ArtNet transmitter active
sACN TX - sACN transmitter active
DMX TX - DMX port sending DMX
ENET - Ethernet port link status and activity

8 ProPlex IQ Tester LV User Manual v0.1.1—18 January 2022
Menu Map

9 ProPlex IQ Tester LV User Manual v0.1.1—18 January 2022
1. DMX
1.1 DMX Receiver
1.2 DMX Transmitter
1.2.2 Scenes
1.2.3 FX Engine
1.3 DMX Input timing
1.4 DMX Scope
1.5 DMX Output Framerate Settings
2. RDM
2.1 RDM Device list
2.2 RDM Device window
2.2.1 RDM Sensors
3. Ethernet
3.1 Network status
3.2 Packet lister
3.3 Protocol Detector
3.4 Active devices
3.5 Ping sender
3.6 Ping responder
3.7 Multicast streams
3.8 LLDP
3.9 Ethernet settings
4. Timecode
4.1 Timecode receiver
4.2 Timecode transmitter
5. PoE Test
6. Cable Test
7. Firmware utility
8. Settings
8.1 DMX Framerate Settings
8.2 Ethernet Settings
8.3 Power Settings
8.4 Internal USB Storage
8.5 System status
8.6 Firmware info
8.7 Time/Date Settings
8.8 Ownership message
8.9 Calibrate touchscreen

10 ProPlex IQ Tester LV User Manual v0.1.1—18 January 2022
Main menu has sections representing main tester functions:
•
DMX - sending and receiving DMX data over local ports or Ethernet using sACN and ArtNet
•
RDM - discovery, monitoring and configuration of RDM enabled devices
•
Ethernet - multipurpose network tools for analysis and troubleshooting over Ethernet
•
Timecode - sending and receiving of LTC timecode
•
PoE - testing of PoE power sourcing equipment (switches and injectors)
•
Cable test - testing of 5 pin XLR cables for wiring continuity and digital data transfer
•
Firmware utility - updating of Solaris and ProPlex devices over DMX cable
•
Settings - device settings

11 ProPlex IQ Tester LV User Manual v0.1.1—18 January 2022
1. DMX
This section contains a collection of tools to send and receive DMX data.
•
DMX Receiver - reception of data over DMX Input port or Ethernet
•
DMX Transmitter - send DMX data over DMX Output port or Ethernet
•
DMX Input Timing - analyze received DMX packet timing
•
DMX Scope - visual inspection of received DMX signal
•
DMX Framerate settings - transmission framerate and timing settings for DMX port and Ethernet
1.1
DMX Receiver
DMX Receiver main view shows a list of DMX universes that have been active since powerup. DMX Input Port is
always shown on top (even if it is not active) followed by a list of Ethernet universes.
Active universes – shown with green label and live stats of
packet count and FPS.
Inactive universes – shown with orange label and timer since
last seen.
Pressing on right side [⋮] icon will open menu that allows to
open DMX View or Store data to Scene that can later be used
as DMX Output data source.
Pressing on the left side / center of universe entry will open
DMX View.
You can change sorting order of Ethernet universes, available
[Sort by] options are:
•
Universe number
•
Total received packet count
•
Active universes on top
[Clear inactive] will remove universes that don’t have active
online sources.
[Config] opens DMX Input Stream Settings:
[Universe range] – set universe range that is used for
ArtPollReply and sACN multicast join messages.
[ArtNet Poll Reply] – enable or disable replying to ArtPoll packets. This is off by default as sending ArtPollReply
packets might affect the way ArtNet source (sender) works. Depending on system configurations, you might
not see any ArtNet data if this is Disabled.
[sACN Multicast Join] – sends IGMP messages to request data for sACN universes. This will have effect only if
the system has multicast-aware Ethernet switches.

12 ProPlex IQ Tester LV User Manual v0.1.1—18 January 2022
DMX View has number of different display options:
•
48ch Bars - bars with data values
•
512ch Bars - whole universe as bars
•
512ch - values represented as intensity
•
RGB - values represented as RGB pixels
•
RGBW - value represented as RGBW pixels
48 channel view will also allow to select data value format as:
•
Decimal (0-255)
•
HEX (00-FF)
•
Percent (0-100)
Flicker finder can be used to highlight channels that change
value. There are two display modes:
•
Hold - if channel has changed values since reset, color
of this channel is changed and never set back
•
Fade - if channel has changed, it is highlighted, but then
gradually faded back to default color
Flicker Finder Fade Time- configurable up to 10 seconds
1.2
DMX Transmitter
Main window shows a list of DMX sources.
DMX Output Port is always shown on top.
All created sources and their configurations are saved, but
output is disabled on powerup to avoid accidental data
transmission.
Pressing on right side [⋮] icon will open menu that allows to:
•
Configure
•
Enable / Disable
•
Delete
•
View data
Pressing on the left side / center of source will open the
corresponding [Configure] window.
Use [Add] to create new sACN or ArtNet courses. Use [Delete]
to clear all sources.
[DMX In Merge] enables merging of DMX Input port data with
output source data.

13 ProPlex IQ Tester LV User Manual v0.1.1—18 January 2022
Source configuration window options depend on source type.
DMX Output port configuration:
•
DMX framerate - change output port framerate between 30, 30, 40 or Custom FPS
•
Enable/disable for DMX Port
sACN Stream configuration:
•
Universe nr - set single universe or range of universes for output
•
sACN priority (0-200)
•
sACN source name
ArtNet Stream configuration:
•
Universe nr - set single universe or range of universes for output
•
Destination IP - set Broadcast or Unicast destination IP
Bottom of all source types will have data source selection where you can choose between:
•
All Zero – sends all DMX channels at zero (0)
•
All Full – sends all DMX channels at full (255)
•
DMX In – forwards data from DMX Input port
•
ArtNet In – forwards data from ArtNet universe
•
sACN In – forwards data from sACN universe
•
Scene 1-6 – user created editable scene
•
FX Engine – dynamic data generated with built-in FX engine

14 ProPlex IQ Tester LV User Manual v0.1.1—18 January 2022
1.2.2 Scenes
Scenes can be captured from DMX Receiver or created from scratch.
Scene data is stored in memory so will remain their values between power-cycles.
Scene data can be edited with one of these DMX Data editors:
•
4 Channel fader view
•
6 Channel fader view
•
CMD Keypad
•
RGB fader mode
•
RGBW fader mode
Use [View DMX] to show data being output.
Use [Clear Values] to reset all channels back to 0.

15 ProPlex IQ Tester LV User Manual v0.1.1—18 January 2022
1.2.3 FX Engine
Dynamic DMX patterns can be generated using build-in FX engine.
Effect speed – enter BPM or use “Tap”
Channel range that effect will be generated for. Remaining
channels are sent as 0.
Grouping/repeating of pattern.
Generation waveform:
•
Sine
•
Saw
•
Triangle
•
PWM
•
Random
Waveform width
Effect running direction
Low/high value of waveform
Invert waveform
1.3
DMX Input timing
Set of statistics for DMX Receiver are shown here.
This includes packet counters for ArtNet, sACN and DMX as well
as detailed information for DMX Input port:
•
framerate
•
packet size
•
break length
•
MAB length

16 ProPlex IQ Tester LV User Manual v0.1.1—18 January 2022
1.4
DMX Scope
DMX Scope can be used to analyze DMX signal data timing and
voltage levels.
Select voltage range +-3V or +-6V
Select time range from 4us/div to 50 mS/div
Setup trigger as:
•
DMX break
•
DMX startcode
•
RDM break
•
RDM startcode
Trigger mode:
•
Auto – redraw if trigger not found
•
Normal – redraw only on trigger event
Enable or disable DMX line termination.
[Run] and [Stop] will accordingly start and stop DMX signal
capture.
[Single] will run trigger once and then stop capture.
1.5
DMX Output Framerate Settings
Network DMX Rate setting will set sACN and ArtNet transfer
rate.
Output port frame rate can be set to predefined values of 20,
30, 40 or to Custom timing that allows to modify separate times
for:
•
Mark Before Break
•
Break
•
Mark After Break

17 ProPlex IQ Tester LV User Manual v0.1.1—18 January 2022
2. RDM
RDM section can be used to discover, monitor, and configure
RDM enabled devices.
2.1
RDM Device list
Main window will show a list of discovered RDM devices.
Depending on a setting, it might also show discovered devices
that are gone offline.
Each entry representing a RDM device contains basic info
regarding this device:
•
Green/red dot - device online/offline
•
Sand clock - RDM communication activity
•
RDM UID
•
Device label
•
DMX address
•
Control mode
[Menu] button opens RDM device list settings menu.
There are different RDM list sorting options.
•
None - unsorted, shown in sequence of discovery
•
Model - sort by device model id
•
UID - sort by RDM Unique Identifier
•
Manufacturer - sort by manufacturer
[Show offline] - hide devices if they go offline.
[All devices Clear] - clear device list and restart discovery
To speed up RDM communication IQ Tester is caching part of
RDM device information.
[Cache auto clear on new device discovery] will automatically
refresh device cache once new device is discovered.
[RDM cache Clear] - manually clear RDM device cache.

18 ProPlex IQ Tester LV User Manual v0.1.1—18 January 2022
2.2
RDM Device window
Clicking a RDM device will open the RDM device window
showing detailed information regarding this device.
Top of window shows basic device information:
•
RDM UID
•
Device label
•
Model
•
Manufacturer
•
Software version
Middle of the screen contains a scrollable list of RDM PIDs.
Features nor available in selected device will be grayed out.
Bottom of screen has [<] and [>] arrows can be used to select
the previous and next device.
[Identify] will toggle device Identify function that helps locate
device.
2.2.1 RDM Sensors
[Sensors] button will open RDM device sensors view that lists
all available sensors in the selected device.
Sensor list will show sensor name, current value, and sensor
type.
For selected sensor a detailed information will be shown on
bottom of screen:
•
Sensor label
•
Sensor type
•
Current value
•
Lowest value
•
Highest value
•
Recorded value
•
Sensor range
•
Sensor normal range
[Reset] and [Record] will issue corresponding RDM commands
to the device.

19 ProPlex IQ Tester LV User Manual v0.1.1—18 January 2022
3. Ethernet
This section contains selection of network tools for status monitoring and
troubleshooting.
3.1
Network status
Shows current Ethernet link status as well as general information
regarding data:
•
data Input speed
•
data output speed
•
Received packet counter
•
Sent packet counter
•
Dropped packet counter
3.2
Packet lister
Shows real-time network activity by listing all received packets.
List shows each packet as:
[PROTOCOL] Source > Destination
Packet lister can be stopped with [Freeze] and then scrolled for
inspection. [Clear] will clear the packet list.

20
ProPlex IQ Tester LV User Manual v0.1.1—18 January 2022
3.3
Protocol Detector
Protocol detector will show list of industry standard protocols and their
status in network:
•
ArtNet
•
sACN
•
MA2 (no multicast join)
•
MA3 (no multicast join)
•
HogNet
•
d3 (only station broadcasts)
•
HippoNet (only station broadcasts)
•
GreenGo (no multicast join)
•
PSN (PosiStageNet)
•
OSC (Open Sound Control)
•
ProPlex Manager
•
Dante (station broadcasts + PTP)
Protocols that are detected will be highlighted and moved to top of list:
•
Green - protocol is active now
•
Orange - protocol was active, but is offline now
•
Gray - protocol has not been detected in network
3.4
Active devices
Lists all Ethernet devices discovered.
As this feature is based on passive detection some devices might not show
up in this list.
[Config] menu opens a window where you can select sorting order and
clear the device list.
/