Page is loading ...

Theory and Practice of pH Measurement
PN 44-6033/rev. D
December 2010


THEORY AND PRACTICE OF pH MEASUREMENT TABLE OF CONTENTS
THEORY AND PRACTICE
OF pH MEASUREMENT
TABLE OF CONTENTS
Section Title Page
1.0 OVERVIEW.............................................................................................................. 1
1.1 Introduction .............................................................................................................. 1
1.2 Operational Definition of pH..................................................................................... 2
1.3 pH Measurements in Industry .................................................................................. 3
2.0 CELLS FOR MEASURING pH................................................................................ 4
2.1 General .................................................................................................................... 4
2.2 Measuring Electrode ................................................................................................ 5
2.3 Reference Electrode ................................................................................................ 6
2.4 Liquid Junction Potential .......................................................................................... 6
2.5 Double Junction Reference Electrodes.................................................................... 8
3.0 MAKING THE pH MEASUREMENT ....................................................................... 9
3.1 Converting Voltage to pH ......................................................................................... 9
3.2 Glass Electrode Slope ............................................................................................. 9
3.3 Buffers and Calibration............................................................................................. 10
3.4 Precautions Using Buffers........................................................................................ 12
3.5 Isopotential pH ......................................................................................................... 13
3.6 Solution Temperature Compensation....................................................................... 14
3.7 Shields, Insulation, and Preamplifiers...................................................................... 14
3.8 Sensor Diagnostics .................................................................................................. 14
4.0 FUNDAMENTAL LIMITATIONS .............................................................................. 15
4.1 Junction Potential Mismatch .................................................................................... 15
4.2 Sodium Error............................................................................................................ 16
5.0 ORP MEASUREMENTS.......................................................................................... 17
5.1 Introduction .............................................................................................................. 17
5.2 Measuring Electrode ................................................................................................ 18
5.3 Interpreting ORP Measurements ............................................................................. 18
5.4 Calibration................................................................................................................ 20
6.0 INSTALLING THE SENSOR ................................................................................... 21
6.1 General .................................................................................................................... 21
6.2 Safety.......................................................................................................................21
6.3 Immersion and Insertion Applications ...................................................................... 21
6.4 Electrical Connections ............................................................................................. 22
7.0 MAINTENANCE ...................................................................................................... 23
7.1 General .................................................................................................................... 23
7.2 Cleaning pH Sensors ............................................................................................... 23
7.3 Calibrating pH Sensors ............................................................................................ 25
7.4 Storing pH Sensors .................................................................................................. 25
8.0 TROUBLESHOOTING ............................................................................................ 26
8.1 Introduction .............................................................................................................. 26
8.2 Installation................................................................................................................ 26
8.3 Wiring.......................................................................................................................26
8.4 Problems with Calibrations ...................................................................................... 26
8.5 Noisy Readings........................................................................................................ 28
8.6 Drift........................................................................................................................... 28
8.7 Ground Loops .......................................................................................................... 29
i

THEORY AND PRACTICE OF pH MEASUREMENT TABLE OF CONTENTS
THEORY AND PRACTICE
OF pH MEASUREMENT
LIST OF APPENDICES
Section Title Page
A Silver/Silver Chloride Electrode Potentials............................................................... 30
B Isopotential pH ......................................................................................................... 31
C Glossary................................................................................................................... 32
LIST OF FIGURES
Figure # Title Page
1-1 Operational Definition of pH..................................................................................... 2
2-1 pH Measurement Cell .............................................................................................. 4
2-2 Measuring Electrode ................................................................................................ 5
2-3 Cross-Section through the pH Glass ....................................................................... 5
2-4 Reference Electrode ................................................................................................ 6
2-5 The Origin of Liquid Junction Potentials .................................................................. 7
2-6 Comparison of Large Pore and Small Pore Liquid Junctions .................................. 7
2-7 Junction Plugging Caused by Silver Chloride .......................................................... 8
2-8 Double Junction Reference Electrode ..................................................................... 8
3-1 Glass Electrode Slope ............................................................................................. 10
3-2 Two-Point Buffer Calibration .................................................................................... 11
3-3 Isopotential pH ......................................................................................................... 13
4-1 Liquid Junction Potential Mismatch.......................................................................... 15
4-2 Sodium Error............................................................................................................ 16
5-1 Oxidation-Reduction Potential ................................................................................. 17
5-2 ORP Measurement Cell ........................................................................................... 18
5-3 Measuring Electrode ................................................................................................ 18
5-4 ORP Measurement Interpretation ............................................................................ 19
6-1 pH Sensor Installation in Flow-Through Piping........................................................ 22
7-1 Checking the Potential of the Reference Electrode ................................................. 24
A-1 Silver/Silver Chloride Electrode ............................................................................... 30
B-1 Cell Voltage as a Function of pH.............................................................................. 31
LIST OF TABLES
Table No. Title Page
3-1 NIST Standard Buffers ............................................................................................. 11
7-1 Cleaning Procedures ............................................................................................... 23
8-1 RTD Resistance Values ........................................................................................... 27
8-2 Input Signals for Simulated Buffer Calibration ......................................................... 27
ii

1.0 OVERVIEW
The determination of pH is one of the most common process chemical measurements made today. This booklet
explains the principles behind the measurement and discusses ways of avoiding common pitfalls. The booklet also
discusses industrial ORP (oxidation-reduction potential) measurements. Although the determination of ORP is not
nearly as common as pH, certain industries make valuable use of the measurement.
1.1 INTRODUCTION
pH is a measure of the relative amount of hydrogen and hydroxide ions in an aqueous solution. In any collection
of water molecules a very small number will have dissociated to form hydrogen (H
+
) and hydroxide (OH
-
) ions:
H
2
O = H
+
+ OH
-
The number of ions formed is small. At 25°C fewer than 2 x 10
-7
% of the water molecules have dissociated. In
terms of molar concentrations, water at 25°C contains 1 x10
-7
moles per liter of hydrogen ions and the same con-
centration of hydroxide ions.
In any aqueous solution, the concentration of hydrogen ions multiplied by the concentration of hydroxide ions is
constant. Stated in equation form:
K
w
= [H
+
] [OH
-
] (1)
where the brackets signify molar concentrations and K
w
is the dissociation constant for water. The value of K
w
depends on temperature. For example, at 25°C K
w
= 1.00 x 10
-14
and at 35°C K
w
= 1.47 x 10
-14
.
Acids and bases, when dissolved in water, simply alter the relative amounts of H
+
and OH
-
in solution. Acids
increase the hydrogen ion concentration, and, because the product [H
+
] [OH
-
] must remain constant, acids
decrease the hydroxide ion concentration. Bases have the opposite effect. They increase hydroxide ion concen-
tration and decrease hydrogen ion concentration. For example, suppose an acid is added to water at 25°C and the
acid raises the H
+
concentration to 1.0 x 10
-4
moles/liter. Because [H
+
] [OH
-
] must always equal 1.00 x 10
-14
,
[OH
-
] will be 1.0 x 10
-10
moles/liter.
pH is another way of expressing the hydrogen ion concentration. pH is defined as follows:
pH = -log [H
+
] (2)
Therefore, if the hydrogen ion concentration is 1.0 x 10
-4
moles/liter, the pH is 4.00.
The term neutral is often used in discussions about acids, bases, and pH. A neutral solution is one in which the
hydrogen ion concentration exactly equals the hydroxide ion concentration. At 25°C, a neutral solution has pH
7.00. At 35°C, a neutral solution has pH 6.92. The common assertion that neutral solutions have pH 7 is not true.
The statement is true only if the temperature is 25°C.
THEORY AND PRACTICE OF pH MEASUREMENT SECTION 1.0
OVERVIEW
SECTION 1.0
OVERVIEW
1.1 INTRODUCTION
1.2 OPERATIONAL DEFINITION OF pH
1.3 pH MEASUREMENTS IN INDUSTRY
1

1.2 OPERATIONAL DEFINITION OF pH
Although equation 2 is often given as the definition of pH, it is not a good one. No one determines pH by first meas-
uring the hydrogen ion concentration and then calculating pH. pH is best defined by describing how it is measured.
Figure 1-1 illustrates the operational definition of pH. The starting point is an electrochemical cell. The cell consists
of an indicating electrode whose potential is directly proportional to pH, a reference electrode whose potential is
independent of pH, and the liquid to be measured. The overall voltage of the cell depends on the pH of the sam-
ple. Because different indicating electrodes have slightly different responses to pH, the measuring system must be
calibrated before use. The second step in the operational definition of pH is calibration. The system is calibrated
by placing the electrodes in solutions of known pH and measuring the voltage of the cell. Cell voltage is a linear
function of pH, so only two calibration points are needed. The final step in the operational definition is to place the
electrodes in the sample, measure the voltage, and determine the pH from the calibration data.
It is apparent that the practical determination of pH requires standard solutions of known pH. The standard solu-
tions are called buffers, and the pH values assigned to them define the pH scale. The procedure by which pH val-
ues are assigned to buffers is beyond the scope of this discussion. There is one important point, though.
Determining pH values requires making assumptions concerning the chemical and physical properties of elec-
trolyte solutions. Slightly different assumptions lead to slightly different pH values for the same solution. Therefore,
slightly different pH scales can exist.
Finally, it should be noted that equation 2 is somewhat misleading. The equation implies that pH is a measure of
concentration. In fact, pH is really a measure of ion activity. Concentration and activity are not the same, but they
are related. See Section 3.3 and the Glossary for more information.
THEORY AND PRACTICE OF pH MEASUREMENT SECTION 1.0
OVERVIEW
FIGURE 1-1. Operational Definition of pH.
The figure shows the three steps in the determination of pH. The three steps constitute the operational definition of pH.
2

1.3 pH MEASUREMENTS IN INDUSTRY
Although pH is a measure of hydrogen ion activity, the fact is of little interest to anyone but a physical chemist. It
is certainly of scant importance in industrial pH measurements. The major use of pH in industry is process control.
Controlling pH helps ensure product quality, reduces corrosion and scaling in plant equipment, and protects the
environment by helping wastewater dischargers meet regulatory limits.
Process pH control limits are often empirical. It is less important to know why a given pH range works than to keep
the pH in the desired range. It is, therefore, important that the person making and using pH measurements under-
stand how the measurement is made, how to calibrate the measuring instrument, and how to recognize and avoid
common problems.
This booklet has five major sections. The first section discusses the construction and features of the electro-
chemical cell used for measuring pH. The second section discusses how the pH analyzer converts the measured
cell voltage into pH. The third section discusses some fundamental limitations to pH measurements. The fourth
section discusses industrial ORP measurements. Because ORP measurement cells have much in common with
pH cells, much of the information in the pH cell section applies to ORP measurements. The fifth section deals with
installation, maintenance, and troubleshooting of pH systems.
THEORY AND PRACTICE OF pH MEASUREMENT SECTION 1.0
OVERVIEW
3

2.1 GENERAL
In nearly every industrial and scientific application, pH is determined by measuring the voltage of an electrochem-
ical cell. Figure 2-1 shows a simplified diagram of a pH cell. The cell consists of a measuring electrode, a refer-
ence electrode, a temperature sensing element, and the liquid being measured. The voltage of the cell is directly
proportional to the pH of the liquid. The pH meter measures the voltage and uses a temperature-dependent fac-
tor to convert the voltage to pH. Because the cell has high internal resistance, the pH meter must have a very high
input impedance.
Figure 2-1 shows separate measuring and reference electrodes. In most process sensors, the electrodes and the
temperature element are combined into a single body. Such sensors are often called combination electrodes.
The cell voltage is the algebraic sum of the potentials of the measuring electrode, the reference electrode, and the
liquid junction. The potential of the measuring electrode depends only on the pH of the solution. The potential of the
reference electrode is unaffected by pH, so it provides a stable reference voltage. The liquid junction potential
depends in a complex way on the identity and concentration of the ions in the sample. It is always present, but if the
sensor is properly designed, the liquid junction potential is usually small and relatively constant. All three potentials
depend on temperature.
The construction of the electrodes and the electrical potentials associated with them are discussed in Sections 2.2
and 2.3.
THEORY AND PRACTICE OF pH MEASUREMENT SECTION 2.0
CELLS FOR MEASURING pH
SECTION 2.0
CELLS FOR MEASURING pH
2.1 GENERAL
2.2 MEASURING ELECTRODE
2.3 REFERENCE ELECTRODE
2.4 LIQUID JUNCTION POTENTIAL
2.5 DOUBLE JUNCTION REFERENCE ELECTRODES
FIGURE 2-1. pH Measurement Cell.
The cell consists of a measuring and reference electrode. The voltage between the electrodes is directly proportional to the
pH of the test solution. The proportionality constant depends on temperature, so a temperature sensor is also necessary. A
100
Ω
platinum RTD is commonly used, although 1000
Ω
platinum RTDs, 3 k
Ω
Balco RTDs, and thermistors are also used.
4

2.2 MEASURING ELECTRODE
Figure 2-2 shows the internals of the measuring electrode. The heart of the electrode is a thin piece of pH-sensi-
tive glass, which is blown onto the end of a length of glass tubing. The pH-sensitive glass, usually called a glass
membrane, gives the electrode its common name: glass electrode. Sealed inside the electrode is a solution of
potassium chloride buffered at pH 7. A piece of silver wire plated with silver chloride contacts the solution.
The silver wire-silver chloride combination in contact with the filling solution constitutes an internal reference elec-
trode. Its potential depends solely on the chloride concentration in the filling solution. Because the chloride con-
centration is fixed, the electrode potential is constant. See Appendix A for a more detailed discussion of how the
chloride concentration determines the electrode potential.
As Figure 2-2 shows, the outside surface of the glass membrane contacts the liquid being measured, and the inside
surface contacts the filling solution. Through a complex mechanism, an electrical potential directly proportional to
pH develops at each glass-liquid interface. Because the pH of the filling solution is fixed, the potential at the inside
surface is constant. The potential at the outside surface, however, depends on the pH of the test solution.
The overall potential of the measuring electrode equals the potential of the internal reference electrode plus the
potentials at the glass membrane surfaces. Because the potentials inside the electrode are constant, the overall
electrode potential depends solely on the pH of the test solution. The potential of the measuring electrode also
depends on temperature. If the pH of the sample remains constant but the temperature changes, the electrode
potential will change. Compensating for changes in glass electrode potential with temperature is an important part
of the pH measurement.
Figure 2-3 shows a cross-section through the pH glass. pH sensitive glasses absorb water. Although the water
does not penetrate more than about 50 nanometers (5 x 10
-8
m) into the glass, the hydrated layer must be pres-
ent for the glass to respond to pH changes. An ion exchange mechanism involving alkali metals and hydrogen ions
in the hydrated layer is responsible for the pH response of the glass. The layer of glass between the two hydrat-
ed layers remains dry. The dry layer makes the glass a poor conductor of electricity and causes the high internal
resistance (several hundred megohms) typical of glass electrodes.
THEORY AND PRACTICE OF pH MEASUREMENT SECTION 2.0
CELLS FOR MEASURING pH
FIGURE 2-2. Measuring Electrode.
The essential element of the glass electrode is a
pH-sensitive glass membrane. An electrical poten-
tial develops at glass-liquid interfaces. The poten-
tial at the outside surface depends on the pH of the
test solution. The potential at the inside surface is
fixed by the constant pH of the filling solution.
Overall, the measuring electrode potential depends
solely on the pH of the test solution.
FIGURE 2-3. Cross-Section through the pH Glass.
For the glass electrode to work, the glass must be
hydrated. The hydrated layer gradually dissolves and is
replaced by a fresh layer. Thus, the surface of the elec-
trode continuously regenerates itself. The rate of dis-
solution depends on temperature. At 50°C, the loss is
about ten times greater than at 25°C. Electrodes wear
out faster at high temperatures. To maintain the hydrat-
ed layer, the glass bulb must be wet at all times.
5

2.3 REFERENCE ELECTRODE
As Figure 2-4 shows, the reference electrode is a
piece of silver wire plated with silver chloride in con-
tact with a concentrated solution of potassium chlo-
ride held in a glass or plastic tube. In many refer-
ence electrodes the solution is an aqueous gel, not
a liquid. Like the electrode inside the glass elec-
trode, the potential of the external reference is con-
trolled by the concentration of chloride in the filling
solution. Because the chloride level is constant, the
potential of the reference electrode is fixed. The
potential does change if the temperature changes.
Industrial reference electrodes differ from laborato-
ry types in an important way. Laboratory electrodes
are available with either gelled or liquid filling solu-
tions. Industrial reference electrodes almost always
have gelled filling solutions. Gelled filling solutions
allow industrial sensors to be installed in pressur-
ized pipes and tanks. The reference electrode is sealed above the gel. Therefore, very little process liquid can
enter the reference electrode and contaminate it. There is a drawback, however. Potassium chloride in the gel ulti-
mately becomes depleted. The gel cannot be replenished, so after a while the sensor fails. Maximum life for a gel-
type sensor is about 12 months. The solution in liquid-filled electrodes can be replenished, and these electrodes
have fairly long operating lives.
2.4 LIQUID JUNCTION POTENTIAL
The salt bridge (see Figure 2-4) is an integral part of the reference electrode. It provides the electrical connection
between the reference electrode and the liquid being measured. Salt bridges take a variety of forms, anything from a
glass frit to a wooden plug. Salt bridges are highly porous, and the pores are filled with ions. The ions come from the
filling solution and the sample. Some bridges—for example, those using gelled filling solutions—permit only diffusion
of ions through the junction. In other designs, a slow outflow of filling solution occurs in addition to diffusion. Diffusion
of ions generates a voltage, called the liquid junction potential. The liquid junction potential is in series with the meas-
uring and reference electrode potentials and is part of the overall cell voltage.
Figure 2-5 helps illustrate how liquid junction potentials originate. The figure shows a section through a pore in the
salt bridge. For simplicity, assume the bridge connects a solution of potassium chloride and hydrochloric acid of equal
molar concentration. Ions from the filling solution and ions from the sample diffuse through the pores. Diffusion is driv-
en by concentration differences. Each ion migrates from where its concentration is high to where its concentration is
low. Because ions move at different rates, a charge separation develops. As the charge separation increases, elec-
trostatic forces cause the faster moving ions to slow down and the slower moving ions to speed up. Eventually, the
migration rates become equal, and the system reaches equilibrium. The amount of charge separation at equilibrium
determines the liquid junction potential.
Liquid junction potentials exist whenever dissimilar electrolyte solutions come into contact. The magnitude of the
potential depends on the difference between the mobility of the ions. Although liquid junction potentials cannot be
eliminated, they can be made small and relatively constant. The liquid junction potential is small when the ions
present in greatest concentration have equal (or almost equal) mobilities. The customary way of reducing junction
potentials is to fill the reference electrode with concentrated potassium chloride solution. The high concentration
ensures that potassium chloride is the major contributor to the junction potential, and the nearly equal mobilities of
potassium and chloride ions make the potential small.
THEORY AND PRACTICE OF pH MEASUREMENT SECTION 2.0
CELLS FOR MEASURING pH
FIGURE 2-4. Reference Electrode.
The fixed concentration of chloride inside the electrode
keeps the potential constant. A porous plug salt bridge at
the bottom of the electrode permits electrical contact
between the reference electrode and the test solution.
6

One of the major problems associated with the deter-
mination of pH is plugging of the liquid junction. For
the junction to work properly, ions must be free to
migrate through the junction pores. If the pores
become blocked, ions cannot diffuse. The electrical
resistance of the junction increases. The pH readings
drift and become noisy. Severe fouling can even com-
pletely block the junction, breaking the electrical con-
nection between the electrode and the sample, and
making the electrode unusable. Plugging can come
from two sources: suspended solids in the sample or
solids resulting from a chemical reaction involving the
electrolyte fill solution. Plugged junctions are difficult
to clean.
If the sample contains suspended solids, the refer-
ence junction is always in danger of plugging. The
greater the amount of suspended solids, the greater
the tendency toward fouling. Generally, the smaller the
surface area of the junction, the more rapidly fouling
occurs. Therefore, one way to combat fouling is to use
a junction with a large surface area. Another approach
is to make a junction having pores much smaller than
the smallest particles likely to be present. As Figure
2-6 shows, if the junction pores are small, the particles cannot get into the pores and instead accumulate on the
surface. The pores remain open. Ions can diffuse easily and the junction resistance stays low.
Reactions between the process liquid and the filling solution can also produce solids that plug the reference junc-
tion. Potassium, chloride, and silver ions from the filling solution are always present in the junction. The origin of
potassium and chloride is obvious; the source of the silver is discussed later. If the sample contains ions that form
insoluble compounds with the filling solution, a precipitate will form in the junction pores. The precipitate ultimate-
ly plugs the junction. Examples of ions that foul the junction are lead, silver, and mercury (II), which form insoluble
chloride salts, and sulfide, which forms an insoluble silver salt.
THEORY AND PRACTICE OF pH MEASUREMENT SECTION 2.0
CELLS FOR MEASURING pH
FIGURE 2-5. The Origin of Liquid Junction Potentials.
The figure shows a thin section through a pore in the junction plug. The junction separates a solution of potassium
chloride on the left from a solution of hydrochloric acid on the right. The solutions have equal molar concentration.
Driven by concentration differences, hydrogen ions and potassium ions diffuse in the directions shown. The length
of each arrow indicates relative rates. Because hydrogen ions move faster than potassium ions, positive charge
builds up on the left side of the section and negative charge builds up on the right side. The ever-increasing posi-
tive charge repels hydrogen and potassium ions. The ever-increasing negative charge attracts the ions. Therefore,
the migration rate of hydrogen decreases, and the migration rate of potassium increases. Eventually the rates
become equal. Because the chloride concentrations are the same, chloride does not influence the charge separa-
tion or the liquid junction potential.
Figure 2-6. Comparison of Large Pore and Small
Pore Liquid Junctions.
In A the suspended particles are smaller than the pores in the
junction plug. The particles get into the pores and eventually
plug them. Because ion diffusion, which provides the electri-
cal connection between the electrode and sample, is hin-
dered, the resistance of the junction increases. In B the pores
are smaller than the suspended particles. The particles accu-
mulate on the surface, and the pores remain open. Even
though the particles may pack on the surface, there is usually
sufficient space between them to allow ion diffusion.
7

Precipitation of solids from the filling solution can also occur. Silver/silver chloride reference electrodes contain a
fairly concentrated potassium chloride solution. Although silver chloride is relatively insoluble in water, the solubil-
ity increases if a high concentration of chloride is present. The increase in solubility is caused by the formation of
a soluble silver chloride complex ion (AgCl
2
-
). If the chloride concentration drops, the complex ion decomposes
and solid silver chloride forms. The change in solubility with chloride concentration causes junction plugging.
Figure 2-7 shows how insoluble silver chloride forms in the liquid junction. Suppose a silver chloride complex ion
finds its way into a junction pore and begins migrating toward the sample. Because the sample is unlikely to con-
tain as much chloride as the filling solution, the chloride concentration decreases along the length of the pore. At
some point the chloride concentration is too small to sustain the complex, and silver chloride precipitates.
Eventually, enough silver chloride deposits and the pore becomes blocked.
2.5 DOUBLE JUNCTION REFERENCE ELECTRODES
One way to minimize plugging from silver chloride is to use a double junction reference. Figure 2-8 shows a typi-
cal arrangement. The concentration of the silver chloride complex in the top chamber—the one containing the ref-
erence element—is relatively high. Typically the solution is saturated with the complex ion. However, the concen-
tration in the bottom chamber is substantially lower because the only way the complex ion can get into the lower
compartment is to diffuse through the inner bridge. Because the level of silver chloride complex in the second com-
partment is small, the rate of pluggage in the sample junction is slow.
A double junction can also be used to reduce plugging caused by reaction of the reference electrolyte with the
sample. If the lower chamber of Figure 2-8 contains an electrolyte that does not react with the sample, no precip-
itation will occur in the sample bridge. Typical fill solutions for this application are ammonium nitrate, and sodium
and potassium nitrate and sulfate.
A third use of the double junction is to reduce poisoning. Poisoning occurs when an agent in the sample migrates
through the bridge and reacts with the reference electrode. Common poisoning agents are sulfide and cyanide.
Both react with the silver/silver chloride electrode, converting it into a silver/silver sulfide or silver/silver cyanide
complex electrode. Poisoning changes the reference voltage by several hundred millivolts. Poisoning is discussed
in more detail in Section 7.2.2.
THEORY AND PRACTICE OF pH MEASUREMENT SECTION 2.0
CELLS FOR MEASURING pH
FIGURE 2-7. Junction Plugging Caused by Silver Chloride.
The figure shows a junction pore. The circles represent chloride ions
(Cl
-
). The silver chloride complex is shown as AgCl
2
-
. Note that the
concentration of chloride decreases moving toward the sample side
of the pore. At some point the chloride concentration becomes too
small to hold the silver chloride complex in solution and solid silver
chloride (AgCl) precipitates.
FIGURE 2-8. Double Junction
Reference Electrode.
Both chambers contain potassium chloride solu-
tion. The top chamber contains the silver/silver
chloride reference element. The potassium chlo-
ride in this chamber is saturated with the soluble
silver chloride complex. The silver chloride com-
plex diffuses through the inner bridge into the sec-
ond chamber. The concentration of the complex
ion in the second chamber remains low, so the
rate of pluggage in the sample bridge is slow.
8

3.1 CONVERTING VOLTAGE TO pH
Equation 1 summarizes the relationship between measured cell voltage (in mV), pH, and temperature (in Kelvin):
E(T) = E
°
(T) - 0.1984 T pH (1)
The cell voltage, E(T)—the notation emphasizes the dependence of cell voltage on temperature—is the sum of five
electrical potentials. Four are independent of the pH of the test solution and are combined in the first term, E
°
(T).
E
°
(T) is the sum of the following:
1. the potential of the reference electrode inside the glass electrode
2. the potential at the inside surface of the glass membrane
3. the potential of the external reference electrode
4. the liquid junction potential.
The second term, -0.1984TpH, is the potential (in mV) at the outside surface of the pH glass. This potential
depends on temperature and on the pH of the sample. Assuming temperature remains constant, any change in
cell voltage is caused solely by a change in the pH of the sample. Therefore, the cell voltage is a measure of the
sample pH.
Note that a graph of equation 1, E(T) plotted against pH, is a straight line having a y-intercept of E
°
(T) and a slope
of -0.1984T.
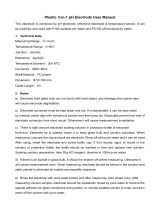
3.2 GLASS ELECTRODE SLOPE
Equation 1 is usually rewritten to remove the temperature dependence in the intercept and to shift the origin of
the axes to pH 7. See Appendix B for a more detailed discussion. The result is plotted in Figure 3-1. Two lines
appear on the graph. One line shows how cell voltage changes with pH at 25°C, and the other line shows the
relationship at 50°C. The lines, which are called isotherms, intersect at the point (pH 7, 0 mV). An entire family
of curves, each having a slope determined by the temperature and all passing through the point (pH 7, 0 mV)
can be drawn on the graph.
Figure 3-1 shows why temperature is important in pH measurements. When temperature changes, the slope of the
isotherm changes. Therefore, a given cell voltage corresponds to a different pH value, depending on the temper-
ature. For example, assume the cell voltage is -150 mV. At 25°C the pH is 9.54, and at 50°C the pH is 9.35. The
process of selecting the correct isotherm for converting voltage to pH is called temperature compensation. All mod-
ern process pH meters and most laboratory meters have automatic temperature compensation.
THEORY AND PRACTICE OF pH MEASUREMENT SECTION 3.0
MAKING THE pH MEASUREMENT
SECTION 3.0
MAKING THE pH MEASUREMENT
3.1 CONVERTING VOLTAGE TO pH
3.2 GLASS ELECTRODE SLOPE
3.3 BUFFERS AND CALIBRATION
3.4 PRECAUTIONS USING BUFFERS
3.5 ISOPOTENTIAL pH
3.6 SOLUTION TEMPERATURE COMPENSATION
3.7 SHIELDS, INSULATION, AND PREAMPLIFIERS
3.8 SENSOR DIAGNOSTICS
9

The slope of the isotherm is often called the glass electrode or sensor slope. The slope can be calculated from the
equation: slope = -0.1984 (T), or converting from Kelvin to Celsius, as slope = -0.1984 (t + 273.15), where t is tem-
perature in °C. The slope has units of mV per unit change in pH. The table lists slopes for different temperatures.
Temp (°C) Slope (mV/unit pH)
15 -57.2
20 -58.2
25 -59.2
30 -60.1
35 -61.1
The negative slope means that as pH increases, the
voltage reading decreases.
As the graph in Figure 3-1 suggests, the closer the
pH is to 7, the less important is temperature com-
pensation. For example, if the pH is 8 and the tem-
perature is 30°C, a 10°C error in temperature intro-
duces a pH error of ±0.03. At pH 10, the error in the
measured pH is ±0.10.
3.3 BUFFERS AND CALIBRATION
Figure 3-1 shows the performance of an ideal cell: one in which the voltage is zero when the pH is 7, and the
slope is -0.1984T over the entire pH range. In a real cell the voltage at pH 7 is rarely zero, but it is usually between
-30 mV and +30 mV. The slope is also seldom -0.1984T over the entire range of pH. However, over a range of
two or three pH units, the slope is usually close to ideal.
Because pH cells are not ideal, they must be calibrated before use. pH cells are calibrated with solutions having
exactly known pH, called buffers. Assigning a pH value to a calibration buffer is not a simple process. The labo-
ratory work is demanding, and extensive theoretical work is needed to support certain assumptions that must be
made. The need for assumptions when defining pH values can be traced to the fact that pH depends on hydrogen
ion activity, not concentration. Activity is related to concentration and is a way of accounting for the difference
between observed and predicted behavior in chemical systems. When physical or chemical measurements are
made on real solutions, the results are usually different from the values predicted from the behavior of ideal solu-
tions. The ratio of the true value to the ideal value at a given concentration is called the activity coefficient. The
product of the activity coefficient and the concentration is the activity. For reasons well beyond the scope of this
discussion, activity coefficients for single ions, for example, the hydrogen ion, cannot be measured. They can be
calculated, but the calculation involves making certain assumptions—these are the assumptions that must be
made when assigning pH values to buffers.
Normally, establishing pH scales is a task best left to national standards laboratories. pH scales developed by the
United States National Institute of Standards and Technology (NIST), the British Standards Institute (BSI), the
Japan Standards Institute (JSI), and the German Deutsche Institute für Normung (DIN) are in common use.
Although there are some minor differences, for practical purposes the scales are identical. Commercial buffers are
usually traceable to a recognized standard scale. Generally, commercial buffers are less accurate than standard
buffers. Typical accuracy for commercial buffers is ±0.01 pH units. Commercial buffers, sometimes called techni-
cal buffers, do have greater buffer capacity. They are less susceptible to accidental contamination and dilution than
standard buffers.
THEORY AND PRACTICE OF pH MEASUREMENT SECTION 3.0
MAKING THE pH MEASUREMENT
FIGURE 3-1. Glass Electrode Slope.
The voltage of a pH measurement cell depends on pH and
temperature. The further from pH 7, the greater the influ-
ence of temperature on the relationship between pH and
cell voltage.
10

The table above lists NIST standard buffers. Although
NIST provides reagents and instructions for preparing
the buffers, NIST or NIST-traceable buffers are readi-
ly available commercially. There are six primary stan-
dards and two secondary standards. The pH of each
buffer depends on temperature, and the range of tem-
peratures over which pH values are defined is not the
same for every buffer. Although NIST standard buffers
are defined to three digits past the decimal, practical
measurements of pH are rarely more accurate than
±0.05 pH units. See Section 4.0 for more information
of fundamental limitations on the accuracy of pH
measurements.
Figure 3-2 shows graphically what happens during
calibration. Assume the sensor is being calibrated
with commercial pH 7 and pH 10 buffer. When the
electrodes are placed in pH 7 buffer, the cell voltage
is V
7
, and when the electrodes are placed in pH 10
buffer, the cell voltage is V
10
. Note that V
7
is not 0 mV
as would be expected in an ideal sensor, but is slight-
ly different. During calibration, the analyzer also
measures the temperature, t.
THEORY AND PRACTICE OF pH MEASUREMENT SECTION 3.0
MAKING THE pH MEASUREMENT
FIGURE 3-2. Two-Point Buffer Calibration.
The graph shows a calibration using pH 7 and pH 10 buffers.
The calibration equation is the straight line connecting the
two points.
PRIMARY STANDARDS SECONDARY STANDARDS
Temp Phosphate Phosphate Carbonate/ Potassium Calcium
°C Tartrate Phthalate 1:1 1:3:5 Borax bicarbonate Tetroxalate hydroxide
0 - 4.003 6.982 7.534 9.460 10.321 1.666 -
5 - 3.998 6.949 7.501 9.392 10.248 1.668 -
10 - 3.996 6.921 7.472 9.331 10.181 1.670 -
15 - 3.996 6.898 7.449 9.276 10.120 1.672 -
20 - 3.999 6.878 7.430 9.227 10.064 1.675 -
25 3.557 4.004 6.863 7.415 9.183 10.014 1.679 12.454
30 3.552 4.011 6.851 7.403 9.143 9.968 1.683 -
35 3.549 4.020 6.842 7.394 9.107 9.928 1.688 -
37 - 4.024 6.839 7.392 9.093 - - -
40 3.547 4.030 6.836 7.388 9.074 9.891 1.694 -
45 3.547 4.042 6.834 7.385 9.044 9.859 1.700 -
50 3.549 4.055 6.831 7.384 9.017 9.831 1.707 -
55 3.554 4.070 - - - - 1.705 -
60 3.560 4.085 - - - - 1.723 -
70 3.580 4.12 - - - - 1.743 -
80 3.609 4.16 - - - - 1.766 -
90 3.650 4.19 - - - - 1.792 -
95 3.674 4.21 - - - - 1.806 -
TABLE 3-1. NIST Standard Buffers
11

The microprocessor calculates the equation of the straight line connecting the points. The general form of the
equation is:
E = A - B (t + 273.15) (pH - 7) (2)
The slope of the line is -B(t + 273.15), where t is the temperature in °C, and the y-intercept is A.
Most pH instruments, after calculating the slope and y-intercept from the calibration data, compare the results with
reference values programmed into the instrument. If the difference between the calculated slope and intercept and
the reference values are too great, the instrument will alert the user that a possible error exists. If the discrepancy
is very large, the instrument might also refuse to accept the calibration.
Once the sensor has been calibrated, the analyzer uses the calibration equation to convert subsequent cell voltage
readings into pH. The graph in Figure 3-2 illustrates the process.
3.4 PRECAUTIONS USING BUFFERS
It is apparent from the preceding discussion that a pH measurement is no better than the buffers used for calibra-
tion. If the buffers are contaminated or used improperly, the calibration will be in error and all subsequent meas-
urements will be wrong. Proper handling, storage, and use of buffers is important.
1. Calibrate with buffers having pH values that bracket the pH of the sample. For example, if the expected pH is
between 8 and 9, calibrate with pH 7 and 10 buffers. Commercial buffers for intermediate ranges are readily
available. Buffers outside the range pH 3 to pH 10 may not be available and must be prepared by the user.
2. Before starting calibration, be sure the sensor and the buffer are at the same temperature. If the sensor was
removed from a process stream having a temperature more than a few degrees different from the buffer, allow
at least twenty minutes for temperature equilibration.
3. If possible, calibrate with buffers having the same temperature as the process. If the buffer and process tem-
perature differ by more than about 15°C an error as great as 0.1 pH may result. Using hot buffers can be dif-
ficult, and precautions are necessary. Refer to Section 3.5 for more information.
4. As Table 3-1 shows, the pH of a buffer is a function of temperature. For example, NIST pH 10.01 buffer has
pH 10.01 only at 25°C. At 20°C the pH is 10.06, and at 30°C the pH is 9.97. Generally, the pH of an alkaline
buffer changes more with temperature than the pH of an acidic or neutral buffer. To reduce errors caused by
failure to use temperature-corrected buffer values, many process pH meters have an automatic calibration fea-
ture. Buffer pH and temperature data are programmed into the instrument. The instrument looks up and uses
the correct value in the calibration.
5. Buffers have limited shelf lives. Do not use a buffer if the expiration date has passed. Store buffers at con-
trolled room temperature.
6. Do not return used buffer to the stock bottle. Discard it.
7. Protect buffers from excessive exposure to air. Atmospheric carbon dioxide lowers the pH of alkaline buffers.
Other trace gases commonly found in industrial environments, for example, ammonia and hydrogen chloride,
also affect the pH of buffers. Molds, from airborne spores, grow readily in neutral and slightly acidic buffers.
Mold growth can substantially alter the pH of a buffer.
8. If a calibration involving an alkaline buffer gives suspect results, repeat the calibration using an acidic buffer in
place of the alkaline one. For example, suppose a sensor is calibrated using pH 7 and pH 10 buffer, and the
slope is 80% of the expected value. The low slope suggests a serious problem with the sensor. However, the
calibration was done with pH 10 buffer—a buffer highly susceptible to atmospheric contamination. Therefore,
before replacing the sensor, repeat the calibration using pH 7 and pH 4 buffers. If the slope calculated using
these buffers is reasonable, then it is likely that the pH 10 buffer used in the first calibration was bad. Obtain
fresh pH 10 buffer and repeat the calibration.
THEORY AND PRACTICE OF pH MEASUREMENT SECTION 3.0
MAKING THE pH MEASUREMENT
12

9. Rinse the sensor with deionized water before placing it in the buffer. Remove excess water from the sensor
by gently daubing it with a clean tissue. Do not wipe the sensor. Wiping may generate a static charge, lead-
ing to noisy readings. The static charge may take hours to dissipate. The few drops of deionized water carried
with the sensor into the buffer will not appreciably alter the pH.
3.5 ISOPOTENTIAL pH
Frequently, the calibration temperature and the process tem-
perature are different. Therefore, the calibration slope, which
depends on temperature, is not appropriate for the sample.
Figure 3-3 shows what the microprocessor does when buffer
and sample temperatures are different. Assume the sensor
was calibrated at temperature t
1
and the process temperature
is t
2
. To measure the pH of the process, the microprocessor
rotates the calibration line about the point (pH 7, A) until the
slope equals B(t
2
+ 273.15). The microprocessor then uses the
new isotherm to convert voltage to pH. The point (pH 7, A) is
called the isopotential pH. As Figure 3-3 shows, the isopoten-
tial pH is the pH at which the cell voltage does not change
when the temperature changes. All modern pH meters assume
the cell isopotential pH is 7.00. Some pH meters permit the
user to change the isopotential setting. Generally, the isopo-
tential pH should not be changed unless the sensor manufac-
turer specifically states what the isopotential pH should be.
The microprocessor makes assumptions when the measure-
ment and calibration temperatures are different. It assumes the
actual pH cell isotherms rotate about the point (pH 7, A). The
assumption may not be correct, causing the measurement to
be in error. The size of the error depends on two things: the dif-
ference between pH 7 and the cell isopotential pH and the dif-
ference between the calibration and measurement tempera-
tures. For a 10°C temperature difference and a difference in isopotential pH of 2, the error is about ±0.07 pH units.
The factors that cause the isopotential pH of a real cell to differ from 7 are beyond the scope of this discussion and
to a great extent are out of the control of the user as well. See Appendix B for a more detailed discussion of isopo-
tential pH.
Most pH cells do not have an isopotential pH point. Instead, the cell isopotential pH changes with temperature, and
the cell isotherms rotate about a general area. Most process pH sensors have an isopotential area centered rea-
sonably close to pH 7.0.
One way to reduce the error caused by disagreement between the sensor and meter isopotential pH is to calibrate
the sensor at the same temperature as the process. However, great care must be exercised when the buffer tem-
perature is significantly greater than ambient temperature. First, the buffer solution must be protected from evap-
oration. Evaporation changes the concentration of the buffer and its pH. Above 50°C, a reflux condenser may be
necessary. Second, the pH of buffers is defined over a limited temperature range. For example, if the buffer pH is
defined only to 60°C, the buffer cannot be used for calibration at 70°C. Finally, no matter what the temperature, it
is important that the entire measurement cell, sensor and solution, be at constant temperature. This requirement
is critical because lack of temperature uniformity in the cell is one reason the cell isopotential point changes when
the temperature changes.
THEORY AND PRACTICE OF pH MEASUREMENT SECTION 3.0
MAKING THE pH MEASUREMENT
13
FIGURE 3-3. Isopotential pH.
The graph shows two calibration lines. The original
calibration was done with pH 4 and pH 10 buffers at
temperature t
1
. Suppose the temperature changes
to t
2
. The pH analyzer automatically changes the
slope by the ratio (t
2
+ 273.15)/(t
1
+ 273.115). The
calibration equations rotate about the point (pH 7, A).

3.6 SOLUTION TEMPERATURE COMPENSATION
The pH of a solution, particularly an alkaline one, is a function of temperature. If the temperature changes, so does
the pH, even though the concentration of the acid or base causing the pH remains constant. Solution temperature
compensation is a way of converting the pH at the measurement temperature to the pH at a reference tempera-
ture. The reference temperature is almost always 25°C. Solution temperature compensation is not the same
as temperature compensation. Temperature compensation is the automatic calculation of pH from the measured
cell voltage and temperature. Solution temperature compensation is the calculation of pH at a reference tempera-
ture from the measured pH.
The change in pH with temperature is called the solution temperature coefficient. It has units of ΔpH/°C. For exam-
ple, ammonia solutions having concentration between 0.1 and 20 ppm have a temperature coefficient of -0.032 pH
units/°C. The pH decreases 0.032 units for every °C increase in temperature. Therefore, if the pH at 30°C is 9.32,
the pH at 25°C is 9.32 + (25 - 30)(-0.032) or 9.48. The size of the temperature coefficient depends on the identity
of the acid or base and its concentration. Usually the temperature coefficient must be determined empirically. Most
industrial pH analyzers have a solution temperature compensation feature.
3.7 SHIELDS, INSULATION, AND PREAMPLIFIERS
pH measurement systems, cell and meter, have high impedance. The high impedance circuit imposes important
restrictions on how the systems are designed.
The pH glass membrane causes the internal resistance of the pH cell to be several hundred MΩ. For the pH meter
to make an accurate voltage measurement, its input impedance must be substantially greater than the cell resist-
ance. Typical pH meters have an input impedance of about 1,000,000 MΩ. The high input impedance of the meter
requires that the insulation between the glass and reference electrode terminals be of high quality. If the insulation
is inadequate, the signal may bypass the meter input impedance. The resulting pH measurement will be serious-
ly in error.
Because the lead wire from the glass electrode connects two high resistances, electrostatic charges, which accu-
mulate on the wire from environmental influences, cannot readily drain away. Buildup of charge results in degrad-
ed, noisy readings. Shielding the wire with metal braid connected to ground at the instrument is one way to improve
the signal. It is also helpful to keep the sensor cable as far away as possible from AC power cables. To provide
further protection from environmental interference, the entire sensor cable can be enclosed in conduit.
To avoid the need for expensive cable and cable installations, a preamplifier built into the sensor or installed in a
junction box near the sensor can be used. The preamplifier converts the high impedance signal into a low imped-
ance one that can be sent as far as 2000 feet without special cable.
3.8 SENSOR DIAGNOSTICS
Sensor diagnostics alert the user to problems with the sensor or to actual sensor failures. The two sensor diag-
nostics are reference impedance and glass impedance.
The major contributor to reference impedance is the resistance across the liquid junction plug. In a properly func-
tioning electrode, the resistance of the liquid junction should be less than about 40 kΩ. If the junction is plugged
or if the filling solution or gel is depleted, the resistance increases. A high reference impedance may also mean the
sensor is not immersed in the process stream.
Glass impedance refers to the impedance of the pH-sensitive glass membrane. The impedance of the glass mem-
brane is a strong function of temperature. As temperature increases, the impedance decreases. For a change in
glass impedance to have any meaning, the impedance measurement must be corrected to a reference tempera-
ture. The impedance of a typical glass electrode at 25°C is about 100 MΩ. A sharp decrease in the temperature-
corrected impedance implies that the glass is cracked. A cracked glass electrode produces erroneous pH read-
ings. The electrode should be replaced immediately. A high (temperature-corrected) glass impedance implies the
sensor is nearing the end of its life and should be replaced as soon as possible.
THEORY AND PRACTICE OF pH MEASUREMENT SECTION 3.0
MAKING THE pH MEASUREMENT
14

4.1 JUNCTION POTENTIAL MISMATCH
All process and most laboratory pH sensors have a liquid junction. The presence of the liquid junction and the need
to calibrate pH sensors with buffers causes a fundamental error in the measurement.
When the glass and reference electrodes are placed in a buffer, a liquid junction potential, E
lj
, develops at the
interface between the buffer and the salt bridge. The liquid junction potential is part of the overall cell voltage and
is included in A in equation 2. Equation 2 on page 12 can be modified to show E
lj
, as a separate term:
E = A’ + E
lj
- B (t + 273.15) (pH - 7) (3)
or
E = E’ (pH, t) + E
lj
(4)
where E’ (pH, t) = A’ - B (t + 273.15) (pH - 7).
In Figure 4-1, calibration and measurement data are
plotted in terms of equation 4. The cell voltage, E, is
represented by the dashed vertical lines. The contri-
bution of each term in equation 4 to the voltage is also
shown. The liquid junction potentials in the buffers are
assumed to be equal and are exaggerated for clarity.
If the liquid junction potential in the sample differs from
the buffers, a measurement error results. Figure 4-1
illustrates how the error comes about. Assume the
true pH of the sample is pH
s
and the cell voltage is E
s
.
The point (pH
s
,E
s
) is shown in the figure. If the liquid
junction potential in the sample were equal to the
value in the buffers, the point would lie on the line.
However, the liquid junction potential in the sample is
greater, so the point E
s
lies above the calibration line.
Therefore, when the cell voltage is converted to pH,
the result is greater than the true pH by the amount
shown.
A typical mismatch between liquid junction potentials
in buffer and sample is 2-3 mV, which is equivalent to
an error of about ±0.02 pH units. If the sample con-
tains a strong acid or base or has a conductvity less
than about 1 µS/cm, the junction potential mismatch
can be on the order of 20-25 mV (±0.4 pH units). The
mismatch produces a fundamental error in pH deter-
minations using a cell with liquid junction.
THEORY AND PRACTICE OF pH MEASUREMENT SECTION 4.0
FUNDAMENTAL LIMITATIONS
SECTION 4.0
FUNDAMENTAL LIMITATIONS
4.1 JUNCTION POTENTIAL MISMATCH
4.2 SODIUM ERROR
FIGURE 4-1. Liquid Junction Potential Mismatch.
The dashed vertical lines are the measured cell volt-
ages for the buffers and the sample. The contribution
from each term in equation 4 is shown. The buffers
are are assumed to have identical liquid junction
potentials. Because most buffers are equitransferant,
i.e., the mobilities of the ions making up the buffer are
nearly equal, assuming equal liquid junction potentials
is reasonable. In the figure, the liquid junction poten-
tial of the sample is greater than the buffers. The dif-
ference gives rise to an error in the measured pH.
15

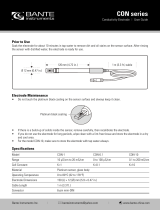
4.2 SODIUM ERROR
Figure 4-2 is a graphical depiction of sodium error. As the figure shows, sodium errors occur at high pH and cause
the measured pH to be less than the true value. Sodium errors come about because the potential of the glass
membrane depends not only on the concentration of hydrogen ions but also on the concentration of other metal
ions, for example, sodium.
Equation 1 on page 9 gave the relationship between cell voltage and pH.
E(T) = E°(T) - 0.1984 T pH (1)
Rewriting pH as -log [H
+
], equation 1 becomes:
E(T) = E°(T) + 0.1984 T log [H
+
] (5)
Recasting equation 5 to account for the influence of sodium gives:
E(T) = E°(T) + 0.1984 T log {[H
+
] + k[Na
+
]} (6)
In equation 6, k is a constant that describes the sensitivity of the glass membrane to sodium ions. The smaller k
is, the less susceptible the pH glass is to sodium error. As equation 6 shows, when the hydrogen ion concentra-
tion is large, it alone determines the cell voltage E(T). However, as pH increases and the hydrogen ion concen-
tration decreases, k[Na
+
] starts to become the more important term in the argument of the logarithm. Because
k[Na
+
] is a constant, the measured voltage does not change as much as it should for a given change in [H
+
], so
the pH is lower than expected. Eventually, the error becomes so great that changes in the hydrogen ion concen-
tration no longer affect the measured pH. At this point the concentration of sodium determines the cell voltage.
Most general purpose glass electrodes on the market today have almost no sodium error up to about pH 11. Above
pH 11 the measured pH can be substantially less than expected. High pH glass electrodes are available which have
practically no sodium error at pH 12, an error of about 0.2 pH at pH 13, and an error of about 0.4 pH at pH 14.
Sodium error tends to increase as the glass electrode ages.
THEORY AND PRACTICE OF pH MEASUREMENT SECTION 4.0
FUNDAMENTAL LIMITATIONS
16
Figure 4-2. Sodium Error.
The graph shows a typical sodium error. Up to pH 11, the measured pH is close to the expected value. There is
no sodium error. Above pH 11, the measured pH is less than expected. At about pH 13, the measured pH is con-
stant at 12.0. The glass electrode has lost all sensitivity to hydrogen ions. The term sodium error is really a mis-
nomer. Other alkali metal ions, like potassium, cause a similar, although less severe, error. Silver, which is not
an alkali metal, also causes "sodium" errors.
/