Page is loading ...

R&S®FSW-K60
Transient Analysis
User Manual
1175647802
Version 25
(;ÙÎÜ2)

This manual applies to the following R&S®FSW models with firmware version 5.30 and later:
●R&S®FSW8 (1331.5003K08 / 1312.8000K08)
●R&S®FSW13 (1331.5003K13 / 1312.8000K13)
●R&S®FSW26 (1331.5003K26 / 1312.8000K26)
●R&S®FSW43 (1331.5003K43 / 1312.8000K43)
●R&S®FSW50 (1331.5003K50 / 1312.8000K50)
●R&S®FSW67 (1331.5003K67 / 1312.8000K67)
●R&S®FSW85 (1331.5003K85 / 1312.8000K85)
The following firmware options are described:
●R&S FSW-K60 Transient Analysis (1313.7495.02)
●R&S FSW-K60H Transient Hop Measurements (1322.9916.02)
●R&S FSW-K60C Transient Chirp Measurements (1322.9745.02)
●R&S FSW-K60P Transient Phase Noise Measurements (1353.2413.02)
© 2023 Rohde & Schwarz GmbH & Co. KG
Muehldorfstr. 15, 81671 Muenchen, Germany
Phone: +49 89 41 29 - 0
Email: [email protected]
Internet: www.rohde-schwarz.com
Subject to change – data without tolerance limits is not binding.
R&S® is a registered trademark of Rohde & Schwarz GmbH & Co. KG.
All other trademarks are the properties of their respective owners.
1175.6478.02 | Version 25 | R&S®FSW-K60
Throughout this manual, products from Rohde & Schwarz are indicated without the ® symbol, e.g. R&S®FSW is indicated as
R&S FSW.

Contents
R&S®FSW-K60
3User Manual 1175.6478.02 ─ 25
Contents
1 Preface.................................................................................................... 9
1.1 Documentation overview..............................................................................................9
1.1.1 Getting started manual....................................................................................................9
1.1.2 User manuals and help................................................................................................... 9
1.1.3 Service manual............................................................................................................. 10
1.1.4 Instrument security procedures.....................................................................................10
1.1.5 Printed safety instructions............................................................................................. 10
1.1.6 Data sheets and brochures........................................................................................... 10
1.1.7 Release notes and open-source acknowledgment (OSA)............................................ 10
1.1.8 Application notes, application cards, white papers, etc.................................................10
1.1.9 Videos............................................................................................................................11
1.2 About this manual....................................................................................................... 11
1.3 Conventions used in the documentation..................................................................12
1.3.1 Typographical conventions............................................................................................12
1.3.2 Conventions for procedure descriptions........................................................................12
1.3.3 Notes on screenshots................................................................................................... 12
2 Welcome to the transient analysis application................................. 13
2.1 Starting the transient analysis application...............................................................13
2.2 Understanding the display information.................................................................... 14
3 About transient analysis..................................................................... 17
4 Measurement basics............................................................................18
4.1 Data acquisition.......................................................................................................... 18
4.2 Basics on input from I/Q data files............................................................................ 18
4.3 Signal processing....................................................................................................... 20
4.4 Signal models..............................................................................................................22
4.4.1 Frequency hopping....................................................................................................... 22
4.4.2 Frequency chirping........................................................................................................24
4.4.3 Automatic vs. manual hop/chirp state detection............................................................25
4.5 Basis of evaluation..................................................................................................... 25
4.6 Analysis region........................................................................................................... 26

Contents
R&S®FSW-K60
4User Manual 1175.6478.02 ─ 25
4.7 Zooming and shifting results.....................................................................................29
4.8 Measurement range.................................................................................................... 30
4.9 Trace evaluation.......................................................................................................... 32
4.9.1 Mapping samples to measurement points with the trace detector................................ 32
4.9.2 Analyzing several traces - trace mode.......................................................................... 34
4.9.3 Trace statistics.............................................................................................................. 35
4.10 Working with spectrograms.......................................................................................36
4.10.1 Time frames.................................................................................................................. 38
4.10.2 Markers in the spectrogram.......................................................................................... 39
4.10.3 Color maps....................................................................................................................39
4.11 Transient analysis in MSRA/MSRT mode................................................................. 43
5 Measurement results........................................................................... 46
5.1 Hop parameters...........................................................................................................47
5.2 Chirp parameters........................................................................................................ 57
5.3 Evaluation methods for transient analysis...............................................................68
6 Configuration........................................................................................83
6.1 Configuration overview.............................................................................................. 83
6.2 Signal description....................................................................................................... 85
6.2.1 Signal model................................................................................................................. 85
6.2.2 Signal states..................................................................................................................86
6.2.3 Timing............................................................................................................................90
6.3 Input and frontend settings........................................................................................91
6.3.1 Input source settings..................................................................................................... 91
6.3.1.1 Radio frequency input................................................................................................... 92
6.3.1.2 Settings for input from I/Q data files..............................................................................95
6.3.2 Output settings.............................................................................................................. 96
6.3.3 Digital I/Q 40G output settings.................................................................................... 100
6.3.4 Frequency settings......................................................................................................102
6.3.5 Amplitude settings.......................................................................................................103
6.4 Trigger settings......................................................................................................... 106
6.5 Data acquisition and analysis region...................................................................... 112
6.6 Bandwidth settings................................................................................................... 115
6.7 Hop / chirp measurement settings.......................................................................... 117

Contents
R&S®FSW-K60
5User Manual 1175.6478.02 ─ 25
6.7.1 General hop/chirp measurement settings....................................................................118
6.7.2 Specific measurement settings................................................................................... 120
6.7.3 Phase noise measurement settings (R&S FSW-K60P).............................................. 122
6.8 FM video bandwidth..................................................................................................123
6.9 Sweep settings.......................................................................................................... 123
6.10 Adjusting settings automatically.............................................................................126
7 Analysis.............................................................................................. 127
7.1 Display configuration............................................................................................... 127
7.2 Result configuration................................................................................................. 127
7.2.1 Result range................................................................................................................128
7.2.2 Table configuration......................................................................................................129
7.2.3 Parameter configuration for result displays.................................................................130
7.2.3.1 Parameter distribution configuration........................................................................... 130
7.2.3.2 Parameter trend configuration.....................................................................................132
7.2.4 Y-Axis scaling..............................................................................................................133
7.2.5 Units............................................................................................................................ 135
7.3 Evaluation basis........................................................................................................136
7.4 Trace settings............................................................................................................ 137
7.5 Trace / data export configuration............................................................................ 140
7.6 Spectrogram settings............................................................................................... 142
7.6.1 General spectrogram settings..................................................................................... 142
7.6.2 Color map settings...................................................................................................... 147
7.7 Export functions........................................................................................................149
7.8 Marker settings..........................................................................................................152
7.8.1 Individual marker setup............................................................................................... 152
7.8.2 General marker settings..............................................................................................155
7.8.3 Marker search settings and positioning functions....................................................... 157
7.8.3.1 Marker search settings................................................................................................157
7.8.3.2 Positioning functions................................................................................................... 159
7.9 Zoom functions......................................................................................................... 160
7.10 Analysis in MSRA/MSRT mode................................................................................163
8 How to perform transient analysis................................................... 165
8.1 How to configure the color mapping.......................................................................169

Contents
R&S®FSW-K60
6User Manual 1175.6478.02 ─ 25
8.2 How to export table data.......................................................................................... 172
9 Measurement examples.....................................................................174
9.1 Example: hopped FM signal.....................................................................................174
9.2 Example: chirped FM signal.....................................................................................178
10 Optimizing and troubleshooting.......................................................185
11 Remote commands to perform transient analysis..........................186
11.1 Introduction............................................................................................................... 187
11.1.1 Conventions used in descriptions............................................................................... 187
11.1.2 Long and short form.................................................................................................... 188
11.1.3 Numeric suffixes..........................................................................................................188
11.1.4 Optional keywords.......................................................................................................188
11.1.5 Alternative keywords................................................................................................... 189
11.1.6 SCPI parameters.........................................................................................................189
11.1.6.1 Numeric values........................................................................................................... 189
11.1.6.2 Boolean....................................................................................................................... 190
11.1.6.3 Character data............................................................................................................ 191
11.1.6.4 Character strings.........................................................................................................191
11.1.6.5 Block data................................................................................................................... 191
11.2 Common suffixes...................................................................................................... 191
11.3 Activating transient analysis................................................................................... 192
11.4 Configuring transient analysis................................................................................ 196
11.4.1 Input/output settings....................................................................................................196
11.4.1.1 RF input.......................................................................................................................196
11.4.1.2 Input from I/Q data files...............................................................................................200
11.4.1.3 Configuring the 2 GHz/ 5 GHz bandwidth extension (R&S FSW-B2000/B5000)........202
11.4.1.4 Configuring the outputs............................................................................................... 208
11.4.1.5 Digital I/Q 40G streaming output commands.............................................................. 209
11.4.2 Frequency....................................................................................................................211
11.4.3 Phase noise (R&S FSW-K60P)...................................................................................212
11.4.4 Amplitude settings.......................................................................................................216
11.4.5 Triggering.................................................................................................................... 221
11.4.5.1 Configuring the triggering conditions...........................................................................221

Contents
R&S®FSW-K60
7User Manual 1175.6478.02 ─ 25
11.4.5.2 Configuring the trigger output......................................................................................225
11.4.6 Data acquisition...........................................................................................................228
11.4.7 Bandwidth settings...................................................................................................... 230
11.4.8 Selecting the signal model.......................................................................................... 231
11.4.9 Configuring signal detection........................................................................................232
11.4.9.1 Chirp states................................................................................................................. 232
11.4.9.2 Hop states................................................................................................................... 236
11.4.10 Configuring the measurement range...........................................................................241
11.4.11 Configuring demodulation........................................................................................... 257
11.4.12 Selecting the analysis region...................................................................................... 258
11.4.13 Adjusting settings automatically.................................................................................. 261
11.5 Capturing data and performing sweeps................................................................. 261
11.6 Analyzing transient effects...................................................................................... 266
11.6.1 Configuring the result display......................................................................................267
11.6.1.1 General window commands........................................................................................267
11.6.1.2 Working with windows in the display...........................................................................268
11.6.2 Defining the evaluation basis...................................................................................... 276
11.6.3 Configuring the result range........................................................................................277
11.6.4 Selecting the hop/chirp................................................................................................279
11.6.5 Table configuration......................................................................................................280
11.6.5.1 Chirp results................................................................................................................ 280
11.6.5.2 Hop results.................................................................................................................. 290
11.6.6 Configuring parameter distribution displays................................................................ 300
11.6.7 Configuring parameter trends..................................................................................... 310
11.6.7.1 General commands..................................................................................................... 311
11.6.7.2 Chirp parameter trends............................................................................................... 312
11.6.7.3 Hop parameter trends................................................................................................. 331
11.6.8 Configuring the Y-Axis scaling and units.....................................................................349
11.6.9 Configuring traces....................................................................................................... 352
11.6.10 Configuring spectrograms........................................................................................... 357
11.6.11 Configuring color maps............................................................................................... 361
11.6.12 Working with markers remotely...................................................................................363
11.6.12.1 Setting up individual markers...................................................................................... 364

Contents
R&S®FSW-K60
8User Manual 1175.6478.02 ─ 25
11.6.12.2 General marker settings..............................................................................................370
11.6.12.3 Configuring and performing a marker search..............................................................371
11.6.12.4 Positioning the marker................................................................................................ 372
Positioning normal markers.........................................................................................372
Positioning delta markers............................................................................................374
11.6.12.5 Marker search (spectrograms).................................................................................... 376
Using markers............................................................................................................. 376
Using delta markers.................................................................................................... 380
11.6.13 Zooming into the display............................................................................................. 385
11.6.13.1 Using the single zoom.................................................................................................385
11.6.13.2 Using the multiple zoom..............................................................................................387
11.7 Configuring an analysis interval and line (MSRA mode only).............................. 388
11.8 Configuring an analysis interval and line (MSRT mode only).............................. 390
11.9 Retrieving results......................................................................................................392
11.9.1 Retrieving information on detected hops.....................................................................393
11.9.2 Retrieving information on detected chirps...................................................................421
11.9.3 Retrieving trace data................................................................................................... 455
11.9.4 Exporting trace and table results.................................................................................458
11.9.5 Retrieving captured I/Q data....................................................................................... 461
11.9.6 Exporting I/Q results to an iq-tar file............................................................................464
11.10 Status reporting system........................................................................................... 465
11.11 Programming examples........................................................................................... 465
11.11.1 Programming example: performing a basic transient analysis measurement.............465
11.11.2 Programming example: performing a chirp detection measurement.......................... 466
11.11.3 Programming example: performing a hop detection measurement............................ 468
11.11.4 Programming example: analyzing parameter distribution........................................... 471
11.11.5 Programming example: analyzing parameter trends.................................................. 471
Annex.................................................................................................. 473
A Reference............................................................................................473
A.1 Reference: ASCII file export format.........................................................................473
List of Commands (Transient Analysis)...........................................475
Index....................................................................................................491

Preface
R&S®FSW-K60
9User Manual 1175.6478.02 ─ 25
1 Preface
This chapter provides safety-related information, an overview of the user documenta-
tion and the conventions used in the documentation.
1.1 Documentation overview
This section provides an overview of the R&S FSW user documentation. Unless speci-
fied otherwise, you find the documents at:
www.rohde-schwarz.com/manual/FSW
Further documents are available at:
www.rohde-schwarz.com/product/FSW
1.1.1 Getting started manual
Introduces the R&S FSW and describes how to set up and start working with the prod-
uct. Includes basic operations, typical measurement examples, and general informa-
tion, e.g. safety instructions, etc.
A printed version is delivered with the instrument. A PDF version is available for down-
load on the Internet.
1.1.2 User manuals and help
Separate user manuals are provided for the base unit and the firmware applications:
●Base unit manual
Contains the description of all instrument modes and functions. It also provides an
introduction to remote control, a complete description of the remote control com-
mands with programming examples, and information on maintenance, instrument
interfaces and error messages. Includes the contents of the getting started manual.
●Firmware application manual
Contains the description of the specific functions of a firmware application, includ-
ing remote control commands. Basic information on operating the R&S FSW is not
included.
The contents of the user manuals are available as help in the R&S FSW. The help
offers quick, context-sensitive access to the complete information for the base unit and
the firmware applications.
All user manuals are also available for download or for immediate display on the Inter-
net.
Documentation overview

Preface
R&S®FSW-K60
10User Manual 1175.6478.02 ─ 25
1.1.3 Service manual
Describes the performance test for checking the rated specifications, module replace-
ment and repair, firmware update, troubleshooting and fault elimination, and contains
mechanical drawings and spare part lists.
The service manual is available for registered users on the global Rohde & Schwarz
information system (GLORIS):
https://gloris.rohde-schwarz.com
1.1.4 Instrument security procedures
Deals with security issues when working with the R&S FSW in secure areas. It is avail-
able for download on the internet.
1.1.5 Printed safety instructions
Provides safety information in many languages. The printed document is delivered with
the product.
1.1.6 Data sheets and brochures
The data sheet contains the technical specifications of the R&S FSW. It also lists the
firmware applications and their order numbers, and optional accessories.
The brochure provides an overview of the instrument and deals with the specific char-
acteristics.
See www.rohde-schwarz.com/brochure-datasheet/FSW
1.1.7 Release notes and open-source acknowledgment (OSA)
The release notes list new features, improvements and known issues of the current
firmware version, and describe the firmware installation.
The software makes use of several valuable open source software packages. An open-
source acknowledgment document provides verbatim license texts of the used open
source software.
See www.rohde-schwarz.com/firmware/FSW
1.1.8 Application notes, application cards, white papers, etc.
These documents deal with special applications or background information on particu-
lar topics.
See www.rohde-schwarz.com/application/FSW
Documentation overview

Preface
R&S®FSW-K60
11User Manual 1175.6478.02 ─ 25
1.1.9 Videos
Find various videos on Rohde & Schwarz products and test and measurement topics
on YouTube: https://www.youtube.com/@RohdeundSchwarz
1.2 About this manual
This Transient Analysis User Manual provides all the information specific to the appli-
cation. All general instrument functions and settings common to all applications and
operating modes are described in the main R&S FSW User Manual.
The main focus in this manual is on the measurement results and the tasks required to
obtain them. The following topics are included:
●Welcome to the Transient Analysis Application
Introduction to and getting familiar with the application
●Measurements and Result Displays
Details on supported measurements and their result types
●Measurement Basics
Background information on basic terms and principles in the context of the mea-
surement
●Configuration + Analysis
A concise description of all functions and settings available to configure measure-
ments and analyze results with their corresponding remote control command
●How to Perform Measurements in the Transient Analysis Application
The basic procedure to perform each measurement and step-by-step instructions
for more complex tasks or alternative methods
●Measurement Examples
Detailed measurement examples to guide you through typical measurement sce-
narios and allow you to try out the application immediately
●Optimizing and Troubleshooting the Measurement
Hints and tips on how to handle errors and optimize the test setup
●Remote Commands for Transient Analysis
Remote commands required to configure and perform Transient Analysis in a
remote environment, sorted by tasks
(Commands required to set up the environment or to perform common tasks on the
instrument are provided in the main R&S FSW User Manual)
Programming examples demonstrate the use of many commands and can usually
be executed directly for test purposes
●Reference
File format description
●List of remote commands
Alphabetical list of all remote commands described in the manual
●Index
About this manual

Preface
R&S®FSW-K60
12User Manual 1175.6478.02 ─ 25
1.3 Conventions used in the documentation
1.3.1 Typographical conventions
The following text markers are used throughout this documentation:
Convention Description
"Graphical user interface ele-
ments"
All names of graphical user interface elements on the screen, such as
dialog boxes, menus, options, buttons, and softkeys are enclosed by
quotation marks.
[Keys] Key and knob names are enclosed by square brackets.
Filenames, commands,
program code
Filenames, commands, coding samples and screen output are distin-
guished by their font.
Input Input to be entered by the user is displayed in italics.
Links Links that you can click are displayed in blue font.
"References" References to other parts of the documentation are enclosed by quota-
tion marks.
1.3.2 Conventions for procedure descriptions
When operating the instrument, several alternative methods may be available to per-
form the same task. In this case, the procedure using the touchscreen is described.
Any elements that can be activated by touching can also be clicked using an addition-
ally connected mouse. The alternative procedure using the keys on the instrument or
the on-screen keyboard is only described if it deviates from the standard operating pro-
cedures.
The term "select" may refer to any of the described methods, i.e. using a finger on the
touchscreen, a mouse pointer in the display, or a key on the instrument or on a key-
board.
1.3.3 Notes on screenshots
When describing the functions of the product, we use sample screenshots. These
screenshots are meant to illustrate as many as possible of the provided functions and
possible interdependencies between parameters. The shown values may not represent
realistic usage scenarios.
The screenshots usually show a fully equipped product, that is: with all options instal-
led. Thus, some functions shown in the screenshots may not be available in your par-
ticular product configuration.
Conventions used in the documentation

Welcome to the transient analysis application
R&S®FSW-K60
13User Manual 1175.6478.02 ─ 25
2 Welcome to the transient analysis applica-
tion
The R&S FSW-K60 is a firmware application that adds functionality to detect transient
signal effects to the R&S FSW.
The R&S FSW Transient Analysis application features:
●Analysis of transient effects
●Quick analysis even before measurement end due to online transfer of captured
and measured I/Q data
●Easy analysis of user-defined regions within the captured data
●Analysis of frequency hopping or chirped FM signals (with additional Transient
Analysis options)
This user manual contains a description of the functionality that the application pro-
vides, including remote control operation.
Functions that are not discussed in this manual are the same as in the Spectrum appli-
cation and are described in the R&S FSW User Manual. The latest version is available
for download at the product homepage.
An application note discussing RF signal analysis and interference tests using the R&S
FSW Transient Analysis application is available from the Rohde & Schwarz website:
1MA267: Automotive Radar Sensors - RF Signal Analysis and Inference Tests
Installation
You can find detailed installation instructions in the R&S FSW Getting Started manual
or in the Release Notes.
2.1 Starting the transient analysis application
The Transient Analysis application adds a new application to the R&S FSW.
To activate the Transient Analysis application
1. Press the [MODE] key on the front panel of the R&S FSW.
A dialog box opens that contains all operating modes and applications currently
available on your R&S FSW.
2. Select the "Transient Analysis" item.
The R&S FSW opens a new measurement channel for the Transient Analysis
application.
Starting the transient analysis application

Welcome to the transient analysis application
R&S®FSW-K60
14User Manual 1175.6478.02 ─ 25
The measurement is started immediately with the default settings. It can be configured
in the Transient "Overview" dialog box, which is displayed when you select the "Over-
view" softkey from any menu (see Chapter 6.1, "Configuration overview",
on page 83).
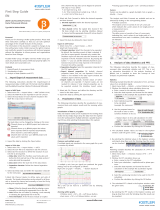
2.2 Understanding the display information
The following figure shows a measurement diagram during analyzer operation. All dif-
ferent information areas are labeled. They are explained in more detail in the following
sections.
1 2
3
4
5
6
1= Channel bar for firmware and measurement settings
2+3 = Window title bar with diagram-specific (trace) information
4 = Diagram area
5 = Diagram footer with diagram-specific information
6 = Instrument status bar with error messages, progress bar and date/time display
MSRA/MSRT operating mode
In MSRA and MSRT operating mode, additional tabs and elements are available. A
colored background of the screen behind the measurement channel tabs indicates that
you are in MSRA/MSRT operating mode.
For details on the MSRA operating mode see the R&S FSW MSRA User Manual. For
details on the MSRT operating mode see the R&S FSW Realtime Spectrum Applica-
tion and MSRT Operating Mode User Manual.
Understanding the display information

Welcome to the transient analysis application
R&S®FSW-K60
15User Manual 1175.6478.02 ─ 25
Channel bar information
In the Transient Analysis application, the R&S FSW shows the following settings:
Table 2-1: Information displayed in the channel bar in the Transient Analysis application
Ref Level Reference level
Att RF attenuation
Freq Center frequency for the RF signal
Meas BW Measurement bandwidth
Meas Time Measurement time (data acquisition time)
Sample Rate Sample rate
Model Signal model (hop, chirp or none)
SGL The sweep is set to single sweep mode.
In addition, the channel bar also displays information on instrument settings that affect
the measurement results even though this is not immediately apparent from the display
of the measured values (e.g. transducer or trigger settings). This information is dis-
played only when applicable for the current measurement. For details see the
R&S FSW Getting Started manual.
Window title bar information
For each diagram, the header provides the following information:
Figure 2-1: Window title bar information in the R&S FSW Transient Analysis application
1 = Window number
2 = Window type
3 = Trace color
4 = Trace number
5 = Detector mode
6 = Trace mode
Diagram footer information
The diagram footer (beneath the diagram) contains the following information, depend-
ing on the evaluation:
Time domain:
●Start and stop time of data acquisition
●Number of data points
●Time displayed per division
Frequency domain:
●Center frequency
●Number of data points
Understanding the display information

Welcome to the transient analysis application
R&S®FSW-K60
16User Manual 1175.6478.02 ─ 25
●Bandwidth displayed per division
●Measurement bandwidth
Spectrogram:
●Center frequency
●Number of data points
●Measurement bandwidth
●Selected frame number
Status bar information
Global instrument settings, the instrument status and any irregularities are indicated in
the status bar beneath the diagram. Furthermore, the progress of the current operation
is displayed in the status bar.
Understanding the display information

About transient analysis
R&S®FSW-K60
17User Manual 1175.6478.02 ─ 25
3 About transient analysis
Transient analysis refers to signal effects which may appear briefly or change rapidly in
time or frequency. Typical examples are spurious emissions or modulated signals
using frequency-hopping techniques. Such signals often require analysis of a large
bandwidth, if possible without gaps.
Ideally, such signals are analyzed in real-time mode, which employs special hardware
in order to capture and process data simultaneously, and seamlessly. However, if a
real-time analyzer is not available, the Transient Analysis application is a good choice.
Similarly to real-time mode, but without the special hardware, this application captures
data and asynchronously - before data acquisition is completed - starts analyzing the
available input and displays first results. Especially for large bandwidths or long mea-
surement times, analysis becomes much more efficient and the complete measure-
ment task can be sped up significantly. Although gaps may occur between successive
measurements with large bandwidths, the results from each individual measurement
are complete without gaps.
Thus, the Transient Analysis application supports you in analyzing time- and fre-
quency-variant signals with large bandwidths.

Measurement basics
R&S®FSW-K60
18User Manual 1175.6478.02 ─ 25
4 Measurement basics
Some background knowledge on basic terms and principles used in analysis of transi-
ent signals is provided here for a better understanding of the required configuration
settings.
●Data acquisition.......................................................................................................18
●Basics on input from I/Q data files.......................................................................... 18
●Signal processing....................................................................................................20
●Signal models..........................................................................................................22
●Basis of evaluation..................................................................................................25
●Analysis region........................................................................................................26
●Zooming and shifting results................................................................................... 29
●Measurement range................................................................................................30
●Trace evaluation......................................................................................................32
●Working with spectrograms.....................................................................................36
●Transient analysis in MSRA/MSRT mode...............................................................43
4.1 Data acquisition
The R&S FSW Transient Analysis application measures the power of the signal input
over time. How much data is captured depends on the measurement bandwidth and
the measurement time. These two values are interdependant and allow you to define
the data to be measured using different methods:
●By defining a bandwidth around the specified center frequency to be measured at a
specified sample rate
●By defining a time length during which a specified number of samples are mea-
sured at the specified center frequency
4.2 Basics on input from I/Q data files
The I/Q data to be evaluated in a particular R&S FSW application cannot only be cap-
tured by the application itself, it can also be loaded from a file, provided it has the cor-
rect format. The file is then used as the input source for the application.
For example, you can capture I/Q data using the I/Q Analyzer application, store it to a
file, and then analyze the signal parameters for that data later using the AM/FM/PM
Modulation Analysis application.
The I/Q data file must be in one of the following supported formats:
●.iq.tar
●.iqw
●.csv
●.mat
Basics on input from I/Q data files

Measurement basics
R&S®FSW-K60
19User Manual 1175.6478.02 ─ 25
●.wv
●.aid
An application note on converting Rohde & Schwarz I/Q data files is available from the
Rohde & Schwarz website:
1EF85: Converting R&S I/Q data files
When importing data from an I/Q data file using the import functions provided by some
R&S FSW applications, the data is only stored temporarily in the capture buffer. It over-
writes the current measurement data and is in turn overwritten by a new measurement.
If you use an I/Q data file as input, the stored I/Q data remains available for any num-
ber of subsequent measurements. Furthermore, the (temporary) data import requires
the current measurement settings in the current application to match the settings that
were applied when the measurement results were stored (possibly in a different appli-
cation). When the data is used as an input source, however, the data acquisition set-
tings in the current application (attenuation, center frequency, measurement band-
width, sample rate) can be ignored. As a result, these settings cannot be changed in
the current application. Only the measurement time can be decreased, to perform
measurements on an extract of the available data (from the beginning of the file) only.
For input files that contain multiple data streams from different channels, you can
define which data stream to be used for the currently selected channel in the input set-
tings. You can define whether the data stream is used only once, or repeatedly, to cre-
ate a larger amount of input data.
When using input from an I/Q data file, the [RUN SINGLE] function starts a single mea-
surement (i.e. analysis) of the stored I/Q data, while the [RUN CONT] function repeat-
edly analyzes the same data from the file.
Sample iq.tar files
If you have the optional R&S FSW VSA application (R&S FSW-K70), some sample
iq.tar files are provided in the C:\R_S\INSTR\USER/vsa/DemoSignals directory
on the R&S FSW.
Pre-trigger and post-trigger samples
In applications that use pre-triggers or post-triggers, if no pre-trigger or post-trigger
samples are specified in the I/Q data file, or too few trigger samples are provided to
satisfy the requirements of the application, the missing pre- or post-trigger values are
filled up with zeros. Superfluous samples in the file are dropped, if necessary. For pre-
trigger samples, values are filled up or omitted at the beginning of the capture buffer.
For post-trigger samples, values are filled up or omitted at the end of the capture buf-
fer.
Basics on input from I/Q data files

Measurement basics
R&S®FSW-K60
20User Manual 1175.6478.02 ─ 25
4.3 Signal processing
The R&S FSW Transient Analysis application measures the power of the signal input
over time. In order to convert the time domain signal to a frequency spectrum, an FFT
(Fast Fourier Transformation) is performed which converts a vector of input values into
a discrete spectrum of frequencies.
The application calculates multiple FFTs per capture, by dividing one capture into sev-
eral overlapping FFT frames. This is especially useful in conjunction with window func-
tions since it enables a gap-free frequency analysis of the signal.
Using overlapping FFT frames leads to more individual results and improves detection
of transient signal effects. However, it also extends the duration of the calculation. The
size of the FFT frame depends on the number of input signal values (record length),
the overlap factor, and the time resolution (time span used for each FFT calculation).
FFT window functions
Each FFT frame is multiplied with a specific window function after sampling in the time
domain. Windowing helps minimize the discontinuities at the end of the measured sig-
nal interval and thus reduces the effect of spectral leakage, increasing the frequency
resolution.
Additional filters can be applied after demodulation to filter out unwanted signals, or
correct pre-emphasized input signals.
Asynchronous data processing
During a measurement in the R&S FSW Transient Analysis application, the data is
captured and stored in the capture buffer until the defined measurement time has
expired. As soon as a minimum amount of data is available, the first FFT calculation is
performed. As soon as the required number of (overlapping) FFT results is available,
the detector function is applied to the data and the first frame is displayed in the Spec-
trogram (and any other active result displays).
Figure 4-1: Signal processing: calculating one spectrogram frame
Signal processing
/