Page is loading ...

For Research Use Only. Not for use in diagnostic procedures.
Genotyping Analysis Module
USER GUIDE
for use with QuantStudio™ Design and Analysis Software v2
Publication Number MAN0018749
Revision B.0

Life Technologies Holdings Pte Ltd | Block 33 | Marsiling Industrial Estate Road 3 | #07-06, Singapore 739256
For descriptions of symbols on product labels or product documents, go to thermofisher.com/symbols-definition.
The information in this guide is subject to change without notice.
DISCLAIMER: TO THE EXTENT ALLOWED BY LAW, THERMO FISHER SCIENTIFIC INC. AND/OR ITS AFFILIATE(S) WILL NOT BE
LIABLE FOR SPECIAL, INCIDENTAL, INDIRECT, PUNITIVE, MULTIPLE, OR CONSEQUENTIAL DAMAGES IN CONNECTION WITH OR
ARISING FROM THIS DOCUMENT, INCLUDING YOUR USE OF IT.
Revision history: Pub. No. MAN0018749
Revision Date Description
B.0 15 April 2020 Remove send to the instrument run queue.
A.0 14 October 2019 New document.
NOTICE TO PURCHASER: DISCLAIMER OF LICENSE: Purchase of this software product alone does not imply any license under any
process, instrument or other apparatus, system, composition, reagent or kit rights under patent claims owned or otherwise controlled
by Thermo Fisher Scientific, either expressly, or by estoppel.
Trademarks: All trademarks are the property of Thermo Fisher Scientific and its subsidiaries unless otherwise specified. TaqMan is a
registered trademark of Roche Molecular Systems, Inc., used under permission and license.
©2020 Thermo Fisher Scientific Inc. All rights reserved.

Contents
■CHAPTER 1 About the Genotyping Analysis Module ................. 5
Compatible data les ............................................................ 5
■CHAPTER 2 Workow: Genotyping analysis .......................... 7
■CHAPTER 3 Set up a plate le for genotyping analysis .............. 8
Select a system template or existing plate le to set up a new plate le ................ 8
Conrm or edit the run method for genotyping analysis .............................. 9
Conrm or edit the plate setup for genotyping analysis .............................. 9
Add samples and assign to wells ............................................ 10
Add SNP assays and assign to wells ......................................... 10
Edit reagent information .................................................... 11
Select a passive reference .................................................. 11
Review and save the plate le ................................................... 11
■CHAPTER 4 Perform genotyping analysis ........................... 13
Review results in the Amplification Plot ........................................... 13
Select the Genotyping Analysis Module ........................................... 13
Review results in the Allelic Discrimination Plot .................................... 13
Omit outliers from genotyping analysis ............................................ 15
(Optional) Review dye signal prole in the MultiComponent Plot ..................... 16
(Optional) Review signal prole in the Raw Data Plot ............................... 16
Edit Genotyping Analysis Setting ................................................ 16
■CHAPTER 5 About genotyping analysis .............................. 18
Overview of genotyping analysis ................................................. 18
Sample types for genotyping analysis ............................................ 19
Allelic Discrimination Plot overview ............................................... 19
QuantStudio™ Design and Analysis Software v2 Genotyping Analysis Module User Guide 3

■Documentation and support ............................................ 21
Related documentation ......................................................... 21
Customer and technical support ................................................. 21
Limited product warranty ....................................................... 21
Index ....................................................................... 22
Contents
4QuantStudio™ Design and Analysis Software v2 Genotyping Analysis Module User Guide

About the Genotyping Analysis
Module
The Genotyping Analysis Module for QuantStudio™ Design and Analysis Software v2
is used to detect single nucleotide polymorphism (SNP) variants of a target nucleic
acid sequence.
For more information about genotyping analysis, see Chapter 5, “About genotyping
analysis”.
Compatible data files
The software is compatible with data les for the following real-time PCR
instruments:
•QuantStudio™ 7 Pro Real-Time PCR System
•QuantStudio™ 6 Pro Real-Time PCR System
•QuantStudio™ 5 Real-Time PCR System (if the plate le for the instrument run is
created using QuantStudio™ Design and Analysis Software v2)
•QuantStudio™ 3 Real-Time PCR System (if the plate le for the instrument run is
created using QuantStudio™ Design and Analysis Software v2)
•QuantStudio™ 1 Real-Time PCR System (if the plate le for the instrument run is
created using QuantStudio™ Design and Analysis Software v2)
Data les for the following instruments are a legacy le format that can be opened in
the software, but can only be saved as the updated le format:
•QuantStudio™ 5 Real-Time PCR System (if the plate le for the instrument run
was not created using QuantStudio™ Design and Analysis Software v2)
•QuantStudio™ 3 Real-Time PCR System (if the plate le for the instrument run
was not created using QuantStudio™ Design and Analysis Software v2)
•QuantStudio™ 1 Real-Time PCR System (if the plate le for the instrument run
was not created using QuantStudio™ Design and Analysis Software v2)
•QuantStudio™ 6 Flex Real-Time PCR System
•QuantStudio™ 7 Flex Real-Time PCR System
•QuantStudio™ 12K Flex Real-Time PCR System (except OpenArray™ format)
•StepOnePlus™ Real-Time PCR System
•ViiA™ 7 Real-Time PCR System
•7500/7500 Fast Real-Time PCR System
•7900HT Real-Time PCR System
1
QuantStudio™ Design and Analysis Software v2 Genotyping Analysis Module User Guide 5

Note: To convert a legacy data le into the updated le format, open the data le,
then click Actions4Save As.
Chapter 1 About the Genotyping Analysis Module
Compatible data files
1
6QuantStudio™ Design and Analysis Software v2 Genotyping Analysis Module User Guide

Workow: Genotyping analysis
Review results in the Amplication Plot (page 13)
▼
Select the Genotyping Analysis Module (page 13)
▼
Review results in the Allelic Discrimination Plot (page 13)
▼
Omit outliers from genotyping analysis (page 15)
▼
(Optional) Review dye signal prole in the MultiComponent Plot (page 16)
▼
(Optional) Review signal prole in the Raw Data Plot (page 16)
▼
Edit Genotyping Analysis Setting (page 16)
IMPORTANT! If you omit wells or congure the analysis settings, click Analyze to
reanalyze the data.
2
QuantStudio™ Design and Analysis Software v2 Genotyping Analysis Module User Guide 7

Set up a plate le for genotyping
analysis
For detailed instructions about setting up a plate le, see Help4Help Contents.
Select a system template or existing plate file to set up a new plate
file
A plate le contains the information that is necessary to perform an instrument run,
including instrument setup, run method, plate setup, and analysis setting.
A system template is a non-editable plate le that is included with the software.
A new plate le must be created from a system template or a previously created plate
le.
For detailed information about system templates and plate les, see Help4Help
Contents.
1. In the home screen, click Set Up Plate.
The Plate Gallery opens to the System Templates tab.
2. IMPORTANT! Select a system template or a plate le that corresponds to your
instrument, block, and run mode. These properties are not editable after the
plate le has been created.
In the left pane, select the appropriate options to lter the system template and
plate le lists.
•Instrument
•Block
•Run Mode
•Analysis
Note: Thermal protocol, plate setup, and post-run analysis options are
independent of analysis module selection. Analysis module selection can be
changed at any point during plate le set or post-run analysis (see “Select
the Genotyping Analysis Module” on page 13).
3
8QuantStudio™ Design and Analysis Software v2 Genotyping Analysis Module User Guide

3. Navigate to, then select a system template or plate le.
Tab Description
System
Templates
Contains system templates, non-editable plate les that are
included with the software.
Select a system template to automatically generate a new plate
le that can be edited, then saved.
My Plate Files Contains plate les that were previously saved to My Plate Files.
plate les that are included with the software.
Select an existing plate le to edit, then save, or to save as a new
plate le.
Recents Contains plate les that were recently opened. Recently opened
plate les from System Templates and My Plate Files do not
populate this tab.
Select an existing plate le to edit, then save, or to save as a new
plate le.
Note: To view all options for opening the plate le, mouse over the plate le,
then click (Actions).
The plate le opens in the Run Method tab.
Confirm or edit the run method for genotyping analysis
For most analysis, the default run method is appropriate. The following options are
compatible for genotyping analysis.
•PCR
•1-step RT-PCR
•2-step RT-PCR
•In a plate le, in the Run Method tab, adjust the run method elements as
needed.
For detailed instructions about editing the run method, see Help4Help
Contents.
•Click (Actions)4Filter Settings to conrm or edit lter settings.
Confirm or edit the plate setup for genotyping analysis
For detailed instructions about plate setup, or to download example plate setup les,
see Help4Help Contents.
Chapter 3 Set up a plate file for genotyping analysis
Confirm or edit the run method for genotyping analysis 3
QuantStudio™ Design and Analysis Software v2 Genotyping Analysis Module User Guide 9

For detailed instructions about plate setup, see Help4Help Contents.
1. In the Plate Setup tab, add samples and assign to wells using the following
options.
•Import a plate setup le
•Manually add samples to the Samples table
•Manually add samples to wells in the plate layout
2. Conrm or edit sample information in the Samples table.
Column Description
Name Sample name
Color Sample color
Type[1] Genotyping analysis uses the following sample types.
•Unknown
•Positive 1/1
•Positive 1/2
•Positive 2/2
•Negative Control
[1] For more information, see “Sample types for genotyping analysis” on page 19.
3. Conrm or edit sample well assignments in the plate layout.
For detailed instructions about plate setup, see Help4Help Contents.
1. In the upper-left corner of the Plate Setup tab, click SNP.
2. Add SNP assays and assign to wells using the following options:
•Import an Assay Information File (AIF)
•Import a plate setup le
•Manually add SNP assays to the SNP Assays table
•Manually add SNP assays to wells in the plate layout
•Import TaqMan™ assay plate and card les
3. Conrm or edit target information in the SNP Assays table.
Column Description
Name SNP assay name
Color SNP assay color
Allele 1
Reporter
Fluorescent reporter dye for allele 1 of the SNP assay
Allele 1
Quencher
Quencher for allele 1 of the SNP assay
Add samples
and assign to
wells
Add SNP
assays and
assign to wells
Chapter 3 Set up a plate file for genotyping analysis
Confirm or edit the plate setup for genotyping analysis
3
10 QuantStudio™ Design and Analysis Software v2 Genotyping Analysis Module User Guide

Column Description
Allele 2
Reporter
Fluorescent reporter dye for allele 2 of the SNP assay
Allele 2
Quencher
Quencher for allele 2 of the SNP assay
Task[1] The software automatically assigns a task to the target in a well
based on the sample type in that well. The following tasks are
used for standard curve analysis.
•Unknown
•Positive 1/1
•Positive 1/2
•Positive 2/2
•Negative Control
[1] For more information, see “Sample types for genotyping analysis” on page 19.
4. Conrm or edit SNP assay well assignments in the plate layout.
1. In the Plate Setup tab, in the Targets/SNP Assays table pane, click Reagents.
2. In the Reagents table, click (Add).
3. Enter the reagent type, name, part number, lot number, and expiration date.
Note: If the master mix that you enter is not compatible with the current run
method, you have the option to apply the recommended run method for your
master mix, instrument, block, and run mode.
4. (Optional) Click (Remove) in the row of a reagent to delete it from the table.
1. In the upper-left corner of the Plate Setup tab, select a passive reference from
the dropdown list.
2. (Optional) Save the plate le or data le.
Review and save the plate file
1. In the Run Summary tab, review the run method selections, then edit if needed.
2. Review the plate setup, then edit if needed.
3. (Optional) Click the barcode eld, then scan the plate barcode.
4. (Optional) Select Add to My Plates.
Edit reagent
information
Select a
passive
reference
Chapter 3 Set up a plate file for genotyping analysis
Review and save the plate file 3
QuantStudio™ Design and Analysis Software v2 Genotyping Analysis Module User Guide 11

5. Select an instrument from the list.
If the instrument does not appear on the list, click System4Instruments to
add a new instrument.
6. Save the plate le.
Start the run on an instrument. For specics on starting an instrument run, see the
instrument documentation.
Chapter 3 Set up a plate file for genotyping analysis
Review and save the plate file
3
12 QuantStudio™ Design and Analysis Software v2 Genotyping Analysis Module User Guide

Perform genotyping analysis
Review results in the Amplification Plot
For detailed instructions about reviewing results in the Amplification Plot, see
Help4Help Contents.
If no data are displayed in the Quality Check tab, or if reanalysis is required, click
Analyze.
1. In the Quality Check tab, in the plot pane, select Amplification Plot from the
dropdown list.
2. Review the amplication status for each well.
3. Review or edit threshold settings.
4. Review or edit baseline settings.
Select the Genotyping Analysis Module
1. In an open data le, click Actions4Analysis Modules.
2. In the Analysis Modules window, select Genotyping, then click Ok.
The Genotyping Analysis Module opens.
Click Analyze, then review the results in the Genotyping tab.
Review results in the Allelic Discrimination Plot
For more information about the allelic discrimination plot, see “Allelic Discrimination
Plot overview” on page 19.
If no data are displayed in the Genotyping tab, or if reanalysis is required, click
Analyze.
1. In the Genotyping tab, in the upper-left corner of the Allelic Discrimination
Plot pane, select an assay from the Assays list (see Figure 1 on page 15).
The Allelic Discrimination Plot is displayed for the selected assay.
4
QuantStudio™ Design and Analysis Software v2 Genotyping Analysis Module User Guide 13

2. Conrm that the data points for each genotype control cluster along the
expected axis of the plot.
Table 1 Cluster assignments in an allelic discrimination plot
Content of samples Location in AD plot
Allele 1 homozygote[1] Lower right corner
Allele 2 homozygote[2] Upper left corner
Alleles 1/2 heterozygote[3] Approximately midway between Allele 1 and Allele 2
clusters
No‑template control Bottom left corner
Undetermined Anywhere outside the regions described above
No amplication With no‑template control (NTC) cluster in the bottom
left corner
[1] Labeled with allele 1 fluorescent dye.
[2] Labeled with allele 2 fluorescent dye.
[3] Labeled with allele 1 and allele 2 fluorescent dyes.
3. Conrm that the cluster at the bottom-left corner of the plot contains only
negative control wells.
Samples can unexpectedly cluster with the negative controls for one of the
following reasons.
•Samples contain no DNA
•Samples contain PCR inhibitors
•Samples are homozygous for a sequence deletion
4. Visually evaluate clusters for the three possible genotypes (see Figure 1 on
page 15).
Chapter 4 Perform genotyping analysis
Review results in the Allelic Discrimination Plot
4
14 QuantStudio™ Design and Analysis Software v2 Genotyping Analysis Module User Guide

8
1
3 4
7
65
2
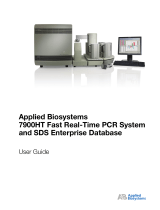
Figure 1 Allelic Discrimination Plot
1Assay selection
2Cycle Number slider—For analysis that includes real-time data, the slider allows you to
display the allelic discrimination data for all samples at each cycle during the PCR
amplication.
3NTC cluster
4Real-time PCR amplication trails—For analysis that includes real-time data
5Allele 2 homozygote cluster
6Allele 1/2 heterozygote cluster
7Allele 1 homozygote cluster
8Plot toolbar
To conrm results, retest outliers and samples with no amplication (cluster with
negative controls).
Omit outliers from genotyping analysis
Outlier wells have Cq values that differ signicantly from the average for the
associated replicate wells. To ensure Cq precision, consider omitting the outliers from
analysis.
1. In the Genotyping tab, select an option to omit wells from analysis.
Option Description
Omit wells in the Plate
Layout
Select outlier wells, then click (Actions)4Omit
Wells.
Omit wells in the Well Table Select Omit in the row of the outlier well.
2. Click Analyze to reanalyze the data with any outliers removed.
Chapter 4 Perform genotyping analysis
Omit outliers from genotyping analysis 4
QuantStudio™ Design and Analysis Software v2 Genotyping Analysis Module User Guide 15

(Optional) Review dye signal profile in the MultiComponent Plot
For more information about the MultiComponent Plot, see Help4Help
Contents.
If no data are displayed in the Quality Check tab, or if reanalysis is required, click
Analyze.
1. In the Quality Check tab, in the plot pane, select MultiComponent Plot from
the dropdown list.
2. Review the signal proles for the passive reference dye, reporter dye, and
negative control wells.
3. Review the plot to ensure that there are no irregularities in the dye signals.
(Optional) Review signal profile in the Raw Data Plot
For detailed instructions about reviewing results in the Raw Data Plot, see
Help4Help Contents.
If no data are displayed in the Quality Check tab, or if reanalysis is required, click
Analyze.
1. In the Quality Check tab, in the plot pane, select Raw Data Plot from the
dropdown list.
2. Click-drag the Cycle Number slider through all of the cycles, then conrm that
each lter displays the characteristic signal increase.
Edit Genotyping Analysis Setting
Open the Genotyping Analysis Module.
1. Click Actions4Genotyping Analysis Setting.
2. Select an option from the Analysis Data list to determine the data that used for
genotyping analysis.
Analysis Data Description
Post Read Only post-PCR read data is used to determine calls.
Pre Read & Post Read[1] The pre-PCR read is subtracted from the post-PCR read
to determine calls.
Chapter 4 Perform genotyping analysis
(Optional) Review dye signal profile in the MultiComponent Plot
4
16 QuantStudio™ Design and Analysis Software v2 Genotyping Analysis Module User Guide

Analysis Data Description
Real Time Data[2] The normalized reporter data (Rn) from the selected
cycle of the cycling stage is used to determine calls.
Analysis is not restricted to the last cycle. Adjust the
analysis cycle using the Cycle Slider in the Allelic
Discrimination Plot pane (see Figure 1 on page 15).
[1] The run method must include a pre-read stage.
[2] Data collection must be on during the PCR stage.
3. (Optional) Edit the following settings:
•Min Confidence %: Change the condence threshold to increase or
decrease stringency for making a genotype call.
•(Real Time Data Analysis Only) Baseline Start and Baseline End: Enter the
rst and last cycle that the software will use to calculate the baseline.
•(Real Time Data Analysis Only) Cycle Number: Change the cycle number
used to generate the normalized reporter data (Rn).
Option Description
Edit default analysis
settings
1. In the table, in the Default Setting row, click in a
cell to edit the setting.
2. To apply the default analysis settings to an assay,
in the assay row, select Use Default.
Edit analysis settings for
an individual assay
In the table, in the assay row, click in a cell to edit the
setting.
4. Click Apply.
The data is reanalyzed using the updated analysis settings.
Chapter 4 Perform genotyping analysis
Edit Genotyping Analysis Setting 4
QuantStudio™ Design and Analysis Software v2 Genotyping Analysis Module User Guide 17

About genotyping analysis
Overview of genotyping analysis
Genotyping analysis is used to detect single nucleotide polymorphism (SNP) variants
of a target nucleic acid sequence.
Genotyping analysis uses preformulated TaqMan™ SNP Genotyping Assays that
include the following components:
•Two sequence-specic primers for amplication of sequences containing the
SNP of interest
•Two allele-specic TaqMan™ probes for Allele 1 and Allele 2
For genotyping analysis, the software performs the following tasks:
1. The software normalizes the uorescence of the reporter dyes to the
uorescence of the passive reference dye in each well.
2. The software plots the normalized reporter dye signal of each sample well on an
Allelic Discrimination Plot, which contrasts the reporter dye intensities of the
allele-specic probes.
3. The software algorithmically clusters the sample data, and assigns a genotype
call to the samples of each cluster according to its position on the plot.
5
18 QuantStudio™ Design and Analysis Software v2 Genotyping Analysis Module User Guide

Sample types for genotyping analysis
Genotyping analysis includes the following sample types.
Sample type
(Type column in
Samples table)
Sample description
Automatic target
task assignment[1]
(Task column in
Targets table)
Unknown Test sample Unknown
Positive 1/1 Control sample that is heterozygous
allele 1/allele 2
Positive 1/1
Positive 1/2 Control sample that is heterozygous
allele 1/allele 2
Positive 1/2
Positive 2/2 Control sample that is homozygous for
allele 2
Positive 2/2
Negative Control Water or buffer
No amplication of the target should occur
in NTC wells.
Negative control
[1] The software automatically assigns a task to the target in a well based on the sample type in that well.
Allelic Discrimination Plot overview
The Allelic Discrimination Plot contrasts the Rn or the ΔRn of the reporter dyes for the
allele-specic probes of the SNP assay. It is an intermediary step in the software
algorithm for genotyping calls.
A typical Allelic Discrimination Plot shows homozygote clusters, a heterozygote
cluster, and the no-template controls. The points in each cluster are grouped closely
together and each cluster is located well away from the other clusters. For expected
cluster locations in the plot, see Figure 2 on page 20.
Chapter 5 About genotyping analysis
Sample types for genotyping analysis 5
QuantStudio™ Design and Analysis Software v2 Genotyping Analysis Module User Guide 19

1
1
1 2
5
43
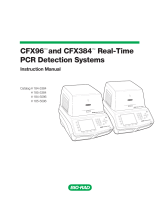
Figure 2 Example allelic discrimination plot
1No‑template control cluster
2Real-time PCR amplication trails (for analysis that includes real-time data)
3Allele 2 homozygote cluster
4Allele 1/2 heterozygte cluster
5Allele 1 homozygote cluster
Note:
·Undetermined samples may appear anywhere on the plot.
·No-amplication samples cluster with the no-template control samples.
Note: The clustering algorithm does not call genotypes if all the samples are one
genotype (form one cluster).
Chapter 5 About genotyping analysis
Allelic Discrimination Plot overview
5
20 QuantStudio™ Design and Analysis Software v2 Genotyping Analysis Module User Guide
/