
Virtual Power Meter
Operation Manual
Model VPM3
©Copyright 2018 by Bird Technologies, Inc.
Instruction Book Part Number 920-VPM3 Rev. F
Windows and Microsoft are registered trademarks
of the Microsoft Corporation

i
About This Manual
This manual covers the operating and maintenance instructions for the
following models:
Changes to this Manual
We have made every effort to ensure this manual is accurate. If you discover
any errors, or if you have suggestions for improving this manual, please send
your comments to our Solon, Ohio factory. This manual may be periodically
updated. When inquiring about updates to this manual refer to the part number
and revision on the title page.
Literature Contents
Chapter Layout
Introduction — Describes the features of the VPM3, lists compatible sensors
and provides installation instructions.
Displays — The VPM3 provides a variety of display types for viewing
measurement data, the displays are described in this chapter.
Menus — Menus are used in VPM3 for the purpose of sensor configuration
and viewing measurement data.
Measurement Modes — Most Bird sensors operate in Average Power mode,
but recent sensors have additional capabilities, this chapter describes the varies
modes available in VPM3.
Theory of Operation — This chapter provides in depth descriptions of VPM3
concepts.
Operating Procedures — This chapter provides procedures for operating
VPM3 with the compatible Bird Sensors, creating presets, making
measurements, and viewing saved data.
Specifications — Provides the PC requirements for VPM3 installation.
VPM3

ii
Table of Contents
About This Manual . . . . . . . . . . . . . . . . . . . . . . . . . . . . . . . . . . . . . . . . . i
Changes to this Manual . . . . . . . . . . . . . . . . . . . . . . . . . . . . . . . . . . . . . . . . . . . . i
Literature Contents . . . . . . . . . . . . . . . . . . . . . . . . . . . . . . . . . . . . . . . . . . . . . . . i
Chapter Layout . . . . . . . . . . . . . . . . . . . . . . . . . . . . . . . . . . . . . . . . . . . . . . . i
Chapter 1 Introduction . . . . . . . . . . . . . . . . . . . . . . . . . . . . . . . . . . . . . 1
VPM Installation . . . . . . . . . . . . . . . . . . . . . . . . . . . . . . . . . . . . . . . . . . . . . . . . 3
Chapter 2 Displays . . . . . . . . . . . . . . . . . . . . . . . . . . . . . . . . . . . . . . . . 5
Digital Display . . . . . . . . . . . . . . . . . . . . . . . . . . . . . . . . . . . . . . . . . . . . . . . . . . 5
Analog Display . . . . . . . . . . . . . . . . . . . . . . . . . . . . . . . . . . . . . . . . . . . . . . . . . . 7
Chart Display . . . . . . . . . . . . . . . . . . . . . . . . . . . . . . . . . . . . . . . . . . . . . . . . . . . 9
Chart Display Options . . . . . . . . . . . . . . . . . . . . . . . . . . . . . . . . . . . . . . . . 11
Chart Markers . . . . . . . . . . . . . . . . . . . . . . . . . . . . . . . . . . . . . . . . . . . . . . 12
Chart Axis Scaling . . . . . . . . . . . . . . . . . . . . . . . . . . . . . . . . . . . . . . . . . . . . 13
Measurement Details . . . . . . . . . . . . . . . . . . . . . . . . . . . . . . . . . . . . . . . . . . . 15
Measurements Tab . . . . . . . . . . . . . . . . . . . . . . . . . . . . . . . . . . . . . . . . . . 15
Statistics Tab . . . . . . . . . . . . . . . . . . . . . . . . . . . . . . . . . . . . . . . . . . . . . . . 15
Chapter 3 Menus . . . . . . . . . . . . . . . . . . . . . . . . . . . . . . . . . . . . . . . . . 16
Menu Bar . . . . . . . . . . . . . . . . . . . . . . . . . . . . . . . . . . . . . . . . . . . . . . . . . . . . . 16
File Menu . . . . . . . . . . . . . . . . . . . . . . . . . . . . . . . . . . . . . . . . . . . . . . . . . . 17
Mode Menu . . . . . . . . . . . . . . . . . . . . . . . . . . . . . . . . . . . . . . . . . . . . . . . . 21
Configure . . . . . . . . . . . . . . . . . . . . . . . . . . . . . . . . . . . . . . . . . . . . . . . . . . 22
Measurement Menu . . . . . . . . . . . . . . . . . . . . . . . . . . . . . . . . . . . . . . . . . 26
Trigger Menu . . . . . . . . . . . . . . . . . . . . . . . . . . . . . . . . . . . . . . . . . . . . . . . 28
Log Menu . . . . . . . . . . . . . . . . . . . . . . . . . . . . . . . . . . . . . . . . . . . . . . . . . . 30
View Menu . . . . . . . . . . . . . . . . . . . . . . . . . . . . . . . . . . . . . . . . . . . . . . . . . 31
Window Menu . . . . . . . . . . . . . . . . . . . . . . . . . . . . . . . . . . . . . . . . . . . . . . 32
Help Menu . . . . . . . . . . . . . . . . . . . . . . . . . . . . . . . . . . . . . . . . . . . . . . . . . 32
Control Panel Menus and Options . . . . . . . . . . . . . . . . . . . . . . . . . . . . . . . . . 33
Configure Button . . . . . . . . . . . . . . . . . . . . . . . . . . . . . . . . . . . . . . . . . . . . 34
Measurement Button . . . . . . . . . . . . . . . . . . . . . . . . . . . . . . . . . . . . . . . . 38
Trigger Button . . . . . . . . . . . . . . . . . . . . . . . . . . . . . . . . . . . . . . . . . . . . . . 39
Units Button . . . . . . . . . . . . . . . . . . . . . . . . . . . . . . . . . . . . . . . . . . . . . . . . 41
Amplitude Button . . . . . . . . . . . . . . . . . . . . . . . . . . . . . . . . . . . . . . . . . . . 41
Scale Button . . . . . . . . . . . . . . . . . . . . . . . . . . . . . . . . . . . . . . . . . . . . . . . . 42

VPM3 Operation Manual
iii
File Button . . . . . . . . . . . . . . . . . . . . . . . . . . . . . . . . . . . . . . . . . . . . . . . . . 43
Chapter 4 Measurement Modes . . . . . . . . . . . . . . . . . . . . . . . . . . . . . 44
Average Power Mode . . . . . . . . . . . . . . . . . . . . . . . . . . . . . . . . . . . . . . . . . . . 44
Time Domain Mode . . . . . . . . . . . . . . . . . . . . . . . . . . . . . . . . . . . . . . . . . . . . . 49
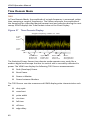
Statistical Power Mode . . . . . . . . . . . . . . . . . . . . . . . . . . . . . . . . . . . . . . . . . . 51
Statistical Power Measurement . . . . . . . . . . . . . . . . . . . . . . . . . . . . . . . . 51
Chapter 5 Theory of Operation. . . . . . . . . . . . . . . . . . . . . . . . . . . . . . 54
Sessions . . . . . . . . . . . . . . . . . . . . . . . . . . . . . . . . . . . . . . . . . . . . . . . . . . . . . . 54
Generic Session File . . . . . . . . . . . . . . . . . . . . . . . . . . . . . . . . . . . . . . . . . . 54
Serial Number Specific Session Files . . . . . . . . . . . . . . . . . . . . . . . . . . . . 54
Default Session Files . . . . . . . . . . . . . . . . . . . . . . . . . . . . . . . . . . . . . . . . . 54
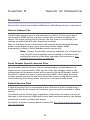
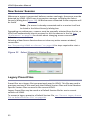
New Sensor Session . . . . . . . . . . . . . . . . . . . . . . . . . . . . . . . . . . . . . . . . . . . . . 55
Legacy Preset Files . . . . . . . . . . . . . . . . . . . . . . . . . . . . . . . . . . . . . . . . . . . . . . 55
Limit Indicators . . . . . . . . . . . . . . . . . . . . . . . . . . . . . . . . . . . . . . . . . . . . . . . . 56
Data Buffering . . . . . . . . . . . . . . . . . . . . . . . . . . . . . . . . . . . . . . . . . . . . . . . . . 57
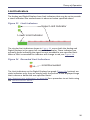
Frames . . . . . . . . . . . . . . . . . . . . . . . . . . . . . . . . . . . . . . . . . . . . . . . . . . . . 57
Points . . . . . . . . . . . . . . . . . . . . . . . . . . . . . . . . . . . . . . . . . . . . . . . . . . . . . 57
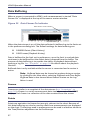
Snapshots . . . . . . . . . . . . . . . . . . . . . . . . . . . . . . . . . . . . . . . . . . . . . . . . . . . . . 58
Playback . . . . . . . . . . . . . . . . . . . . . . . . . . . . . . . . . . . . . . . . . . . . . . . . . . . . . . 59
Logging . . . . . . . . . . . . . . . . . . . . . . . . . . . . . . . . . . . . . . . . . . . . . . . . . . . . . . . 60
Log Contents . . . . . . . . . . . . . . . . . . . . . . . . . . . . . . . . . . . . . . . . . . . . . . . 60
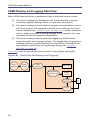
VPM3 Display and Logging Data Flow . . . . . . . . . . . . . . . . . . . . . . . . . . . . . . 63
Smoothing . . . . . . . . . . . . . . . . . . . . . . . . . . . . . . . . . . . . . . . . . . . . . . . . . 64
Chapter 6 Operating Procedures . . . . . . . . . . . . . . . . . . . . . . . . . . . . 68
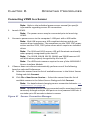
Connecting VPM3 to a Sensor . . . . . . . . . . . . . . . . . . . . . . . . . . . . . . . . . . . . 68
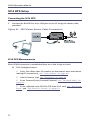
402X DPS Setup . . . . . . . . . . . . . . . . . . . . . . . . . . . . . . . . . . . . . . . . . . . . . . . . 69
Connecting the 402X Series DPS . . . . . . . . . . . . . . . . . . . . . . . . . . . . . . . 69
402X DPS Measurements . . . . . . . . . . . . . . . . . . . . . . . . . . . . . . . . . . . . . 69
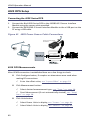
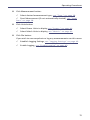
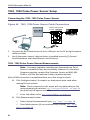
5014 DPS Setup . . . . . . . . . . . . . . . . . . . . . . . . . . . . . . . . . . . . . . . . . . . . . . . . 71
Connecting the 5014 DPS . . . . . . . . . . . . . . . . . . . . . . . . . . . . . . . . . . . . . 71
5014 DPS Measurements . . . . . . . . . . . . . . . . . . . . . . . . . . . . . . . . . . . . . 71
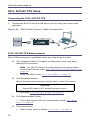
5015, 5015-EF TPS Setup . . . . . . . . . . . . . . . . . . . . . . . . . . . . . . . . . . . . . . . . 73
Connecting the 5015, 5015-EF TPS . . . . . . . . . . . . . . . . . . . . . . . . . . . . . 73
5015, 5015-EF TPS Measurements . . . . . . . . . . . . . . . . . . . . . . . . . . . . . . 73
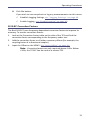
5015-EF Correction Factors . . . . . . . . . . . . . . . . . . . . . . . . . . . . . . . . . . . 74
5012, 5016, 5017, 5018, 5019 WPS Setup . . . . . . . . . . . . . . . . . . . . . . . . . . . 75
Connecting the 5012, 5016, 5017, 5018, 5019 WPS . . . . . . . . . . . . . . . . 75

Table of Contents
iv
5012, 5016, 5017, 5018, 5019 WPS Measurements . . . . . . . . . . . . . . . . 75
7020 WPS Setup . . . . . . . . . . . . . . . . . . . . . . . . . . . . . . . . . . . . . . . . . . . . . . . 77
Connecting the 7020 WPS . . . . . . . . . . . . . . . . . . . . . . . . . . . . . . . . . . . . 77
7020 WPS Measurements . . . . . . . . . . . . . . . . . . . . . . . . . . . . . . . . . . . . . 77
7022 Statistical Power Sensor Setup . . . . . . . . . . . . . . . . . . . . . . . . . . . . . . . 79
Connecting the 7022 Statistical Power Sensor . . . . . . . . . . . . . . . . . . . . 79
7022 Statistical Power Sensor Measurements . . . . . . . . . . . . . . . . . . . . 79
7023, 7025 Pulse Power Sensor Setup . . . . . . . . . . . . . . . . . . . . . . . . . . . . . 81
Connecting the 7023, 7025 Pulse Power Sensor . . . . . . . . . . . . . . . . . . 81
7023, 7025 Pulse Power Sensor Measurements . . . . . . . . . . . . . . . . . . . 81
Open Session File . . . . . . . . . . . . . . . . . . . . . . . . . . . . . . . . . . . . . . . . . . . . . . . 83
Save a Default Session File . . . . . . . . . . . . . . . . . . . . . . . . . . . . . . . . . . . . . . . 83
Open Measurement File . . . . . . . . . . . . . . . . . . . . . . . . . . . . . . . . . . . . . . . . . 84
Convert Legacy Preset File to Default Session File . . . . . . . . . . . . . . . . . . . . 84
Setting Limit Indicators . . . . . . . . . . . . . . . . . . . . . . . . . . . . . . . . . . . . . . . . . . 85
Add a Limit . . . . . . . . . . . . . . . . . . . . . . . . . . . . . . . . . . . . . . . . . . . . . . . . . 85
Edit a Limit . . . . . . . . . . . . . . . . . . . . . . . . . . . . . . . . . . . . . . . . . . . . . . . . . 86
Remove a Limit . . . . . . . . . . . . . . . . . . . . . . . . . . . . . . . . . . . . . . . . . . . . . 86
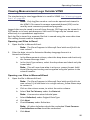
Viewing Data Using VPM3 Playback . . . . . . . . . . . . . . . . . . . . . . . . . . . . . . . . 87
Viewing Buffered Data . . . . . . . . . . . . . . . . . . . . . . . . . . . . . . . . . . . . . . . 87
Viewing Logged Data . . . . . . . . . . . . . . . . . . . . . . . . . . . . . . . . . . . . . . . . . 88
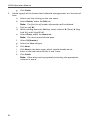
Creating Log Files . . . . . . . . . . . . . . . . . . . . . . . . . . . . . . . . . . . . . . . . . . . . . . . 89
Viewing Measurement Logs Outside VPM3 . . . . . . . . . . . . . . . . . . . . . . . . . 90
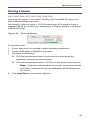
Zeroing a Sensor . . . . . . . . . . . . . . . . . . . . . . . . . . . . . . . . . . . . . . . . . . . . . . . 92
Chapter 7 Specifications. . . . . . . . . . . . . . . . . . . . . . . . . . . . . . . . . . . 93
Minimum PC Requirements . . . . . . . . . . . . . . . . . . . . . . . . . . . . . . . . . . . . . . 93
Software Prerequisites . . . . . . . . . . . . . . . . . . . . . . . . . . . . . . . . . . . . . . . 93
Limited Warranty . . . . . . . . . . . . . . . . . . . . . . . . . . . . . . . . . . . . . . . . . 94

1
Chapter 1 Introduction
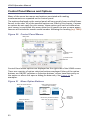
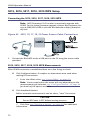
Virtual Power Meter (VPM) 3 is a powerful tool used to turn a PC into a Power
Meter. VPM3 is capable of displaying measurements from Bird’s USB
compatible Power Sensors.
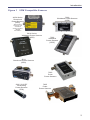
Figure 1 on page 2
shows the full line of USB
compatible sensors.
Note: ONLY sensors that have USB connections or USB Interface
cable can be used with VPM3 software.
VPM3 sports the following features:
Three display formats: Digital Display, Analog Display, and Chart
Display.
Supports all modes of operation available in Bird Power sensors: Aver-
age Power Mode, Time Domain Mode, Statistical Power Mode
Displays the full range of capabilities for each sensor, such as: Forward
Average Power, Reflected Average Power, Match Measurements,
Forward Peak Power, Forward Burst, Crest Factor, CCDF, Statistical
Power, Pulse Power, and Gated Average depending upon the
capabilities of the connected sensor.
Displays power measurements in Watts or dBm.
Displays match units in VSWR, Return Loss, Rho, or efficiency %,
reflected %.
Log measurement data to a file.
Playback Logged measurement Data.
Save and recall sensor configuration setups.

Introduction
2
Figure 1 VPM Compatible Sensors
402X Series
Directional
Power Sensors
(DPS)
5014
Directional Power Sensors
(DPS)
402X sensors
require the use
of the Bird
Sensor Interface
Module
4421A540-2
7020
Wideband Power Sensors
(WPS)
7023
Pulse
Power Sensors
5015, 5015-EF
Terminating
Power Sensors
(TPS)
7022
Statistical
Power Sensors
(STAT)
501X Series
Wideband Power Sensors
(WPS)
7025
Pulse
Power Sensors

VPM3 Operation Manual
3
VPM Installation
1. Insert installation CD.
2. Select Install Software when prompted.
Note: Set-up will inspect the computer for any missing operating
system prerequisites. If all are present, skip to step 6.
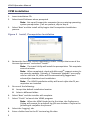
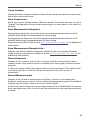
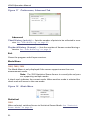
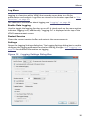
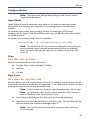
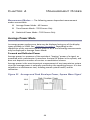
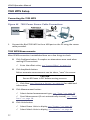
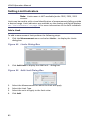
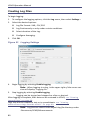
3. Select ‘Next ‘and the install utility begins the Prerequisites Installation
process.
Figure 2 Install, Prerequisites Installation
4. Review the End-User License Agreement, check “I accept the terms of the
License Agreement” and select “Install.”
Note: The install Utility will install the prerequisites. This may take
several minutes
Note: When completed, check with Microsoft
®
support center for
any security updates. Typically, if “Automatic Updates” are config-
ured on the host PC, these will be automatically flagged and
selected for download and installation.
Note: The VPM3 installation utility will launch after the OS pre-
requisites are installed.
5. Do one of the following:
Accept the default installation location
Select a different folder:
6. Select ‘Next’ and the installer will complete.
7. Select “Finish” to launch the VPM3 program:
Note: When the VPM3 loads for the first time, the Preferences
Dialog will prompt for a default log file save location. Perform the
following to complete the process.
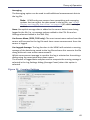
8. Select the ‘Logging’ tab.
9. Enter a folder local to the PC to store log file data.

Introduction
4
Note: This can be changed at any time in the Preferences. All
active sensor sessions must be closed before Preferences Dialog
can be opened.
10. Select the Advanced Tab.
11. Select the language in the drop down menu.
Note: For any non-US English language setting, select ‘Windows’.
Any standard formats such as number and date formats from
“Regional and Language Options” found in the
Windows Control Panel will be mimicked in the VPM3 interface.

5
Chapter 2 Displays
Bird Power Sensors offer a variety of measurement capabilities. The modes and
displays available in VPM3 will depend on the connected sensor. All of the
display types discussed in this chapter are available in the VPM3 for all sensors.
Display Types — Measurements may be displayed using the following
display types:
Digital Display - Bar
Analog Display - Meter
Chart Display - X/Y Graph
Measurement Details — All sensor measurements are displayed in the
details section just below the measurement display. The details section consist
of the following tabs
Measurements Tab
Statistics Tab
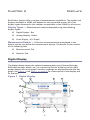
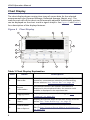
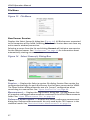
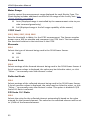
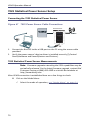
Digital Display
The digital display shows the selected measurement type (Forward Average,
Reflected Average, Match, etc.) in a numerical format at the top of the main
power display over a bar graph. Ancillary readings are displayed under the bar
graph. See
Figure 3
and
Table 1 on page 6
for a description of the display and
its features.
Figure 3 Digital Display

Displays
6
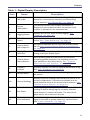
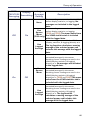
Table 1 -
Item Name Description
Digital Display Description
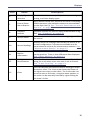
1 Menu Bar
Menu bar contains menus for controlling VPM3
operation, measurement selection, and controlling
sensor sessions.
See “Menu Bar” on page 16
.
2
Sensor
Information
The selected sensor part number information is
displayed in the window title bar, the sensors serial
number is displayed in the top status bar.
3 Logging Status
Displays the current status of data logging.
See
“Logging” on page 60
.
4
Data Stream
Status
Displays the current status of the data stream from the
sensor.
See “Data Buffering” on page 57
.
5
Control Panel
Menu Options
The options available for the currently selected Menu
Tab (7).
See “Control Panel Menus and Options”
on page 33
.
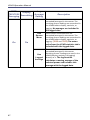
6
Display Type
Selection
Buttons allow the user to quickly select between digital,
analog, and chart display types.
7
Control Panel
Menu Buttons
Menu buttons allow the user access to menus for
controlling VPM3 operation, the available menus are
also available on the menu bar (1).
See “Control
Panel Menus and Options” on page 33
.
8
Playback
controls
Playback controls are used to replay buffered data or log
files.
See “Playback” on page 59
.
9 Sensor Status
Indicates the connection status or zeroing progress of
the sensor.
10 Sensor Readings
Displays all of the readings returned by the sensor in its
current configuration. Two tabs are available one for
measurements and one for measurement statistics.
See
“Measurement Details” on page 15
.
11 Bar Graph
The bar graph gives a visual indication of the main
reading as well as displaying the currently selected
measurement in numerical format. The scale of the
graph can be set to auto or full-scale.
12 Limit Indicators
Limit indicators give visual indication the measured
signal is less than or greater than user selected limits.
See
"Limit Indicators" on page 56
.

VPM3 Operation Manual
7
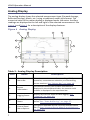
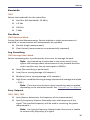
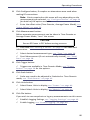
Analog Display
The analog display shows the selected measurement type (Forward Average,
Reflected Average, Match, etc.) using a traditional meter style format. The
numerical value of the meter reading is displayed under the meter. Ancillary
readings are displayed to the left and right of the selected measurement. See
Figure 4
and
Table 2
for a description of the displays features.
Figure 4 Analog Display
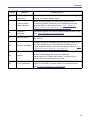
Table 2 - Analog Display Description
Item Name Description
1 Menu Bar
Menu bar contains menus for controlling VPM3
operation, measurement selection, and controlling
sensor sessions.
See “Menu Bar” on page 16
.
2
Sensor
Information
The selected sensor part number information is
displayed in the window title bar, the sensors serial
number is displayed in the top status bar.
3 Logging Status
Displays the current status of data logging.
See
“Logging” on page 60
.
4
Data Stream
Status
Displays the current status of the data stream from the
sensor.
See “Data Buffering” on page 57
.
5
Control Panel
Menu Options
The options available for the currently selected Menu
Tab (7).
See “Control Panel Menus and Options”
on page 33
.

Displays
8
6
Display Type
Selection
Buttons allow the user to quickly select between digital,
analog, and chart display types.
7
Control Panel
Menu Buttons
Menu buttons allow the user access to menus for
controlling VPM3 operation, the available menus are
also available on the menu bar (1).
See “Control
Panel Menus and Options” on page 33
.
8
Playback
controls
Playback controls are used to replay buffered data or log
files.
See “Playback” on page 59
.
9 Sensor Status
Indicates the connection status or zeroing progress of
the sensor.
10 Sensor Readings
Displays all of the readings returned by the sensor in its
current configuration. Two tabs are available one for
measurements and one for measurement statistics.
See
“Measurement Details” on page 15
.
11 Meter
The meter gives a visual indication of the main reading
as well as displaying the currently selected
measurement in numerical format. The scale of the
meter can be set to auto or full-scale.
12 Limit Indicators
Limit indicators give visual indication the measured
signal is less than or greater than user selected limits.
See
"Limit Indicators" on page 56
.
Item Name Description

VPM3 Operation Manual
9
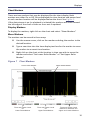
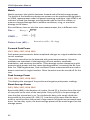
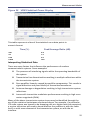
Chart Display
The chart display shows running time trace of sensor data for the selected
measurement type (Forward Average, Reflected Average, Match, etc.). The
scale for each axis of the chart can be manually adjusted. Additionally, markers
can be displayed on the chart to aid in signal analysis. See
Figure 5
and
Table 3
for a description of the displays features.
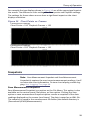
Figure 5 Chart Display
Table 3 Chart Display Explanation
Item Name Description
1 Menu Bar
Menu bar contains menus for controlling VPM3
operation, measurement selection, and controlling
sensor sessions.
See “Menu Bar” on page 16
.
2
Sensor
Information
The selected sensor Part number information is
displayed in the window title bar, the sensors serial
number is displayed in the top status bar.
3 Logging Status
Displays the current status of data logging.
See
“Logging” on page 60
.
4
Data Stream
Status
Displays the current status of the data stream from the
sensor.
See “Data Buffering” on page 57
.
5
Control Panel
Menu Options
The options available for the currently selected Menu
Tab (7).
See “Control Panel Menus and Options”
on page 33
.

Displays
10
6
Display Type
Selection
Buttons allow the user to quickly select between digital,
analog, and chart display types.
7
Control Panel
Menu Buttons
Menu buttons allow user access to menus for controlling
VPM3 operation, the available menus are also available
on the menu bar (1).
See “Control Panel Menus and
Options” on page 33
.
8
Playback
controls
Playback controls are used to replay buffered data or log
files.
See “Playback” on page 59
.
9 Sensor Status
Indicates the connection status or zeroing progress of
the sensor.
10 Sensor Readings
Displays all of the readings returned by the sensor in its
current configuration. Two tabs are available one for
measurements and one for measurement statistics.
See
“Measurement Details” on page 15
11
Marker
Information
Displays the values on the x and y-axis for the current
marker position. There is also difference data displayed.
See “Chart Markers” on page 12
.
12 Scroll Buttons
Thew Scroll buttons allow the user to manually scroll
along the x-axis when the x-axis scale is set to manual.
See “X-Axis Scrolling” on page 13
.
13 Chart
The chart displays the selected sensor reading on a two
dimension chart. The Y-Axis scale shows the Power of
the signal over time on the X-Axis. The Y-Axis scale can
be set to auto or full-scale, using the menu options, or
the scale can be manually entered by right-clicking on
the chart’s Y-Axis.
Item Name Description

VPM3 Operation Manual
11
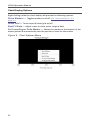
Chart Display Options
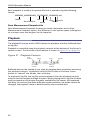
Right clicking inside the chart display will provide the following options:
Show Markers — Toggles markers on & off.
See “Chart Markers” on
page 12
.
Show Grid — Turns major & minor grid on/off
Best Fit Data — Adjust scales to show entire range of data
Set Lower/Upper Delta Marker — Moves the marker to the location of the
mouse pointer & automatically sets the position in time for the marker.
Figure 6 Chart Options Menu

Displays
12
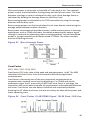
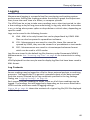
Chart Markers
There are two markers that may be displayed for the chart display. Both
markers are either On or Off. Once displayed the time location and power level
at each markers location will be displayed below the chart. See
Figure 7
.
If the data stream is on (or playback is initiated) the markers will move toward
the left edge of the chart as time on the x-axis is updated.
Display Markers
To display the markers, right click on the chart and select “Show Markers.”
Move Markers
The markers can be moved in three ways:
Use the mouse cursor, click on the marker and drag the marker to the
desired location.
Type a new time into the time display text box for the marker to move
the marker to an exact time location.
Right click on the chart at the location in time you wish to move the
marker and select “Set Lower Delta Marker” or “Set Upper Delta
Marker.”
Figure 7 Chart Markers

VPM3 Operation Manual
13
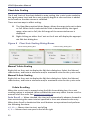
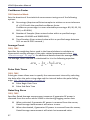
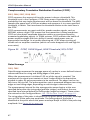
Chart Axis Scaling
The X and Y axis of the chart default to auto scaling, the y-axis is auto scaled to
the signal power level and the x-axis typically begins at zero and time is added
to the scale as the data stream is collected.
There are two ways to affect scaling.
The View Menu option Meter Range, allows the range to be set to Auto
or Full. When Auto is selected the scale is determined by the signal
range, when set to Full, the full range of the connected sensor is
displayed.
Right clicking on either the Y axis or the X axis will display the appropri-
ate Edit Axis dialog box.
Figure 8 Chart Axis Scaling Dialog Boxes
Manual Y-Axis Scaling
Right click on the y-axis to display the Edit Axis dialog box. Select the Manual
radio button, and enter a minimum and/or maximum value for the y-axis scale.
Manual X-Axis Scaling
Right click on the y-axis to display the Edit Axis dialog box. Select the Manual
radio button, and enter a minimum and/or maximum value for the y-axis scale.
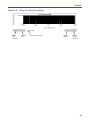
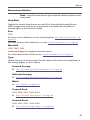
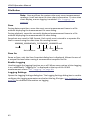
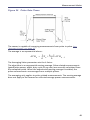
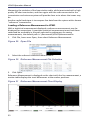
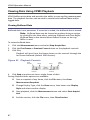
X-Axis Scrolling
When the x-axis is set to manual using the Edit Access dialog box, the x-axis
scrolling option is activated. When enabled the user may select to auto scroll or
manual scroll the scale. See
Figure 9 on page 14
.
Auto Scroll — When checked, the chart will automatically advance forward in
time maintaining the same interval specified in the x-axis manual scale entry.
When Auto Scroll is deselected the scroll buttons are operational and perform
the following functions:
<<, >> — Moves chart to start, end of log
<, > — Moves chart one span to the left or right

Displays
14
Figure 9 Chart X-Axis Scrolling

VPM3 Operation Manual
15
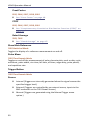
Measurement Details
All sensor measurements are displayed in the details section just below the
measurement display. The details section consist of the following tabs:
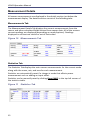
Measurements Tab
The Measurement Details Tab displays the current measurements from the
sensor and other calculated fields derived from sensor data. All of the sensors
current readings are displayed (depending on mode/options). Readings
displayed in red text are invalid or out of limits data.
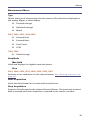
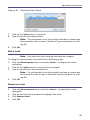
Figure 10 Measurements Tab
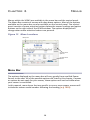
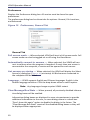
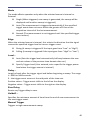
Statistics Tab
The Statistics Tab displays the main sensor measurements for the current mode
along with the mean, min, and max for each measurement.
Statistics are automatically reset if a change is made that affects power
measurement such as adding an input offset.
Statistics can be manually reset by clicking Reset (XXX) in the top left corner of
the statistics table.
Figure 11 Statistics Tab
Page is loading ...
Page is loading ...
Page is loading ...
Page is loading ...
Page is loading ...
Page is loading ...
Page is loading ...
Page is loading ...
Page is loading ...
Page is loading ...
Page is loading ...
Page is loading ...
Page is loading ...
Page is loading ...
Page is loading ...
Page is loading ...
Page is loading ...
Page is loading ...
Page is loading ...
Page is loading ...
Page is loading ...
Page is loading ...
Page is loading ...
Page is loading ...
Page is loading ...
Page is loading ...
Page is loading ...
Page is loading ...
Page is loading ...
Page is loading ...
Page is loading ...
Page is loading ...
Page is loading ...
Page is loading ...
Page is loading ...
Page is loading ...
Page is loading ...
Page is loading ...
Page is loading ...
Page is loading ...
Page is loading ...
Page is loading ...
Page is loading ...
Page is loading ...
Page is loading ...
Page is loading ...
Page is loading ...
Page is loading ...
Page is loading ...
Page is loading ...
Page is loading ...
Page is loading ...
Page is loading ...
Page is loading ...
Page is loading ...
Page is loading ...
Page is loading ...
Page is loading ...
Page is loading ...
Page is loading ...
Page is loading ...
Page is loading ...
Page is loading ...
Page is loading ...
Page is loading ...
Page is loading ...
Page is loading ...
Page is loading ...
Page is loading ...
Page is loading ...
Page is loading ...
Page is loading ...
Page is loading ...
Page is loading ...
Page is loading ...
Page is loading ...
Page is loading ...
Page is loading ...
Page is loading ...
-
 1
1
-
 2
2
-
 3
3
-
 4
4
-
 5
5
-
 6
6
-
 7
7
-
 8
8
-
 9
9
-
 10
10
-
 11
11
-
 12
12
-
 13
13
-
 14
14
-
 15
15
-
 16
16
-
 17
17
-
 18
18
-
 19
19
-
 20
20
-
 21
21
-
 22
22
-
 23
23
-
 24
24
-
 25
25
-
 26
26
-
 27
27
-
 28
28
-
 29
29
-
 30
30
-
 31
31
-
 32
32
-
 33
33
-
 34
34
-
 35
35
-
 36
36
-
 37
37
-
 38
38
-
 39
39
-
 40
40
-
 41
41
-
 42
42
-
 43
43
-
 44
44
-
 45
45
-
 46
46
-
 47
47
-
 48
48
-
 49
49
-
 50
50
-
 51
51
-
 52
52
-
 53
53
-
 54
54
-
 55
55
-
 56
56
-
 57
57
-
 58
58
-
 59
59
-
 60
60
-
 61
61
-
 62
62
-
 63
63
-
 64
64
-
 65
65
-
 66
66
-
 67
67
-
 68
68
-
 69
69
-
 70
70
-
 71
71
-
 72
72
-
 73
73
-
 74
74
-
 75
75
-
 76
76
-
 77
77
-
 78
78
-
 79
79
-
 80
80
-
 81
81
-
 82
82
-
 83
83
-
 84
84
-
 85
85
-
 86
86
-
 87
87
-
 88
88
-
 89
89
-
 90
90
-
 91
91
-
 92
92
-
 93
93
-
 94
94
-
 95
95
-
 96
96
-
 97
97
-
 98
98
-
 99
99


BIRD 5012D Owner's manual
- Type
- Owner's manual
- This manual is also suitable for
Ask a question and I''ll find the answer in the document
Finding information in a document is now easier with AI
Related papers
-
BIRD 7037 Series Owner's manual
-
-
-
-
-
-
-
-
-
 Bird Brain AT-400 Antenna Tester AT-400 User manual

Other documents
-
LCI U6 User guide
-
Omega PT-104 and TC-08 Owner's manual
-
 Magnescale MeasureViewer (J) Owner's manual
-
 Magnescale MeasureViewer (US) Owner's manual
-
MARK-10 Model 5i Force/Torque Indicator User guide
-
 Blue Corvus The Bird User manual
-
Jabra Noise Guide User guide
-
Panasonic CZCSWAC2 Operating instructions
-
Mitsubishi Electric EMU2-PK3-EN User manual
-
Geovision GV-5016 Video Capture Card Installation guide


