Page is loading ...

12
ba75432e0
Operating Instructions
Part 1:
Part 2:
General Information
Functional Description
0/20


1
Contents
1 Photometers. . . . . . . . . . . . . . . . . . . . . . . . . . . . . . . . . . . . . . 2
1.1 Photometry . . . . . . . . . . . . . . . . . . . . . . . . . . . . . . . . . . . . . 2
1.2 The Photometers. . . . . . . . . . . . . . . . . . . . . . . . . . . . . . . . . 3
2 Photometric Test Kits . . . . . . . . . . . . . . . . . . . . . . . . . . . . . 3
2.1 Basic Principle. . . . . . . . . . . . . . . . . . . . . . . . . . . . . . . . . . . 3
2.1.1 Spectroquant
®
Cell Tests . . . . . . . . . . . . . . . . . . . . 4
2.1.2 Spectroquant
®
Reagent Tests . . . . . . . . . . . . . . . . . 4
2.2 Notes for Practical Use . . . . . . . . . . . . . . . . . . . . . . . . . . . . 5
2.2.1 Measuring Range . . . . . . . . . . . . . . . . . . . . . . . . . . 5
2.2.2 Influence of pH . . . . . . . . . . . . . . . . . . . . . . . . . . . . 7
2.2.3 Influence of Temperature . . . . . . . . . . . . . . . . . . . . 7
2.2.4 Time Stability . . . . . . . . . . . . . . . . . . . . . . . . . . . . . 7
2.2.5 Influence of Foreign Substances. . . . . . . . . . . . . . . 8
2.2.6 Dosing of Reagents . . . . . . . . . . . . . . . . . . . . . . . . 8
2.2.7 Shelf-life of the Reagents . . . . . . . . . . . . . . . . . . . . 9
3 Sample Preparation. . . . . . . . . . . . . . . . . . . . . . . . . . 9
3.1 Taking Samples. . . . . . . . . . . . . . . . . . . . . . . . . . . . . . . . . . 9
3.2 Preliminary Tests . . . . . . . . . . . . . . . . . . . . . . . . . . . . . . . . . 10
3.3 Dilution . . . . . . . . . . . . . . . . . . . . . . . . . . . . . . . . . . . . . . . . 10
3.4 Filtration . . . . . . . . . . . . . . . . . . . . . . . . . . . . . . . . . . . . . . . 11
3.5 Homogenization. . . . . . . . . . . . . . . . . . . . . . . . . . . . . . . . . . . . . . . . . . . . . . . . 12
3.6 Decomposition . . . . . . . . . . . . . . . . . . . . . . . . . . . . . . . . . . . . . . . . . . . . . . . . . 12
4 Pipetting System . . . . . . . . . . . . . . . . . . . . . . . . . . . . . . . . . 14
5
Analytical Quality Assurance (AQA)
. . . . . . . . . . . . . . . 15
5.1 Quality Control at the Manufacturer . . . . . . . . . . . . . . . . . . 15
5.2 Quality Control for the User. . . . . . . . . . . . . . . . . . . . . . . . . 16
5.2.1 Checking the Photometer . . . . . . . . . . . . . . . . . . . . 17
5.2.2 Checking the Overall System . . . . . . . . . . . . . . . . . 17
5.2.3 Checking the Pipettes . . . . . . . . . . . . . . . . . . . . . . . 18
5.2.4 Checking Thermoreactors. . . . . . . . . . . . . . . . . . . . 18
5.2.5 Testing for Handling Errors . . . . . . . . . . . . . . . . . . . 19
5.3 Determination of Sample Influences . . . . . . . . . . . . . . . . . . 19
5.4 Definition of Errors . . . . . . . . . . . . . . . . . . . . . . . . . . . . . . . 20
photoLab
®
Series
Release 01/2012

2
photoLab
®
Series
1 Photometers
When a beam of light is transmitted through a colored solution, then this
beam loses its intensity, in other words a part of the light is absorbed by
the solution. Depending on the substance in question, this absorption
occurs at specific wave lengths.
Monochromators (e. g. narrow-band interference filters, lattices) are used
to select the wavelength from the total spectrum of a tungsten-halogen
lamp (VIS spectrum), a deuterium lamp (UV spectrum) or, respectively, a
xenon lamp.
The intensity of the absorption can be characterized using the transmit-
tance T (or, respectively, T in percent).
T = I/I
0
I
0
= Initial intensity of the light
I = Intensity of the transmitted light
If the light is not absorbed at all by a solution, then this solution has a
transmittance of 100 %; a com plete absorption of the light in the solution
means 0 % transmittance.
The measure generally used for the absorption of light is the absorbance
(A), since this correlates directly with the concentration of the absorbing
substance. The fol lowing connection exists between absorbance and
transmittance:
A = – log T
Experiments by BOUGUER (1698–1758) and LAMBERT (1728 –1777)
showed that the absorbance is dependent on the thickness of the ab-
sorbing layer of the cell used. The relationship between the absorbance
and the concentration of the analyte in ques
tion was discovered by BEER
(1825–1863). The com
bination of these two natu ral laws led to the deri va-
tion of Lambert-Beer’s law, which can be described in the form of the fol-
lowing equation:
A =
· c · d
=
Molar absorptivity, in l/mol x cm
d = Path length of the cell, in cm
c = Concentration of the analyte, in mol/l
1.1 Photometry
Release 01/2012

3
photoLab
®
Series
The photometers that belong to the Spectroquant
®
Analysis System differ
from con ven tional photo meters in the following important aspects:
•
The calibration functions of all test kits are electronically stored.
•
The measurement value can be immediately read off from the display
in the de sired form.
•
The method for the test kits (Cell Tests and reagent tests) belonging to
the Spectroquant
®
analysis system is automatically selected via the
scanning of the bar code
.
•
All cells formats used are automatically identified and the correct meas-
uring range is selected automatically
.
•
Instrument-supported AQA ensures that measurement results can be
used as secure, reproducible, and recognized analytical results.
•
New methods can be downloaded from the internet site
www.merck-chemicals.com/photometry and permanently stored in the
instrument.
For technical data and instructions for use please refer to the section
“Function description” or can also be found on the internet.
1.2 The Photometers
2 Photometric Test Kits
By means of reagents, the component of a sample to be analyzed is con-
verted into a colored compound in a specific reaction. The reagents or
reagent mix tures contain – in addition to the reagent selective for a para-
meter to be determined – a number of auxi liary substances that are
essential for the course of the reaction. These include, for example, buffers
for adjusting the pH to the optimal value for the reaction, and masking
agents that suppress or mini mize the influence of interfering ions.
The color reactions are in most cases based on standardized analytical
methods specifically optimized in terms of ease of use, a low working
effort, and shorter reaction times. Furthermore, methods cited in the litera-
ture or developed by ourselves are also used
. Details on the respective ref-
erence procedures are stated in the package insert or else in the para-
meter overview.
2.1 Basic Principle
1 Photometers
Release 01/2012

photoLab
®
Series
4
2 Photometric Test Kits
The principle behind the reagent tests is that the reagents necessary for the
color reaction are com bined in the form of liquid concentrates or solid-sub-
stance mixtures
. A few drops of the reagent concentrate are added to the
sample.
This means that there is no need to dilute the sample, which in turn
enhances the sensitivity of the detection
. The procedure generally used in
classical photometry by which the sample is made up to a defined volume
in a volumetric flask is dispensed with.
The method is selected automatically by means of the scanning of the bar
code by the AutoSelector.
All cells formats used are automatically identified and the correct measur-
ing range is selected automatically.
Subsequently the result is automatically shown on the display
.
2.1.2 Spectroquant
®
Reagent Tests
Release 01/2012
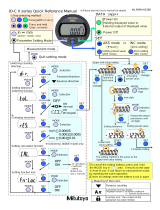
Identification mark for the
correct insertion into the cell
compartment of the photo-
meter
Cat. No. of test kit
Designation of test kit
Details regarding contents
Special cell in
optical quality
2.1.1 Spectroquant
®
Cell Tests
Leakproof cap
Bar code for identification
in the photometer
Risk phrases
Highly precise dosage of
the reagent
14560
CSB/COD
Quecksilber(II)-sulfat,
Schwefelsäure
Mercury(II) sulfate,
sulfuric acid
Mercure(II) sulfate,
acide sulfurique
Mercurio(II) sulfato,
ácido sulfúrico
7.91145.608x-XXXXXX
Merck KGaA,
64271 Darmstadt, Germany
Additional reagent(s)
Certain cell tests, e. g. COD or nitrite, already contain all necessary rea-
gents in the cells, and the sample must merely be added with a pipette.
In other tests, however for reasons of chemical compatibility it is neces-
sary to separate the test into two or three different reagent mixtures. In
such cases, besides the sample a metered reagent must also be added.

The intensity of the color of a solution, measured as the absorbance, is
proportional to the concentration of the respective analyte only within a
specific range. This mea sur ing range (effective range) is electro nically
stored in the photometers for each in di vidual test kit .
Below the specified measuring range, either a different cell or else another
procedure must be used. The lower limit of the measuring range either
takes the form of non linearity of the calibration curve, as shown in the
figure, or else is given by the method detection limit. The method detec-
tion limit of an analytical method is the lowest concentration of the ana-
lyte in question that can be measured quantitatively with a defined degree
of probability (e. g. 99 %).
The upper limit of the measuring range is the point at which the linear
correlation between the concentration and the absorbance ends. In such a
case the sample must be diluted accordingly so that it lies ideally in the
middle of the ef fective range (least-error measurement).
In photometry it is conventional practice to measure against the reagent
blank va lue. Here the analysis is carried out “blind”, i.e. without any ana-
lyte added. In stead of the sample volume, the corresponding quantity of
distilled or DI water is used. This reagent blank value is prestored in the
photometers belonging to the Spectroquant
®
analysis system, which
means that - due to the high batch reproducibility - it is possible to dis-
pense with a separate measurement of the reagent blank. At the lower
limit of the measuring range, the accuracy of the determination can be
enhanced by performing the measurement against a separately prepared
reagent blank.
2 Photometric Test Kits
2.2 Notes for Practicle Use
2.2.1 Measuring range
Concentration
Absorbance
Release 01/2012
photoLab
®
Series
5

6
Release 01/2012
photoLab
®
Series
Cat. No. Method Correct indi- Color change
cation of
result up to
sample conc.
114739 Ammonium CT 100 mg/l turquoise instead of green
114558 Ammonium CT 500 mg/l turquoise instead of green
114544 Ammonium CT 1000 mg/l turquoise instead of green
114559 Ammonium CT 5000 mg/l turquoise instead of green
114752 Ammonium Test 100 mg/l turquoise instead of green
100683 Ammonium Test 2500 mg/l turquoise instead of green
100605 Bromine Test 50 mg/l yellow instead of red
100595 Chlorine CT 25 mg/l yellow instead of red
100597 Chlorine CT 25 mg/l yellow instead of red
100598 Chlorine Test 25 mg/l yellow instead of red
100602 Chlorine Test 25 mg/l yellow instead of red
100599 Chlorine Test 25 mg/l yellow instead of red
100086/ Chlorine Test 300 mg/l yellow instead of red
87/88
100608 Chlorine Dioxide Test 15 mg/l yellow instead of red
114553 Copper CT 50 mg/l turquoise instead of blue
114767 Copper Test 50 mg/l turquoise instead of blue
114557 Fluoride CT 5 mg/l brown instead of violet
100809 Fluoride CT 5 mg/l brown instead of violet
114598 Fluoride Test 5 (50) mg/l brown instead of violet
100606 Iodine Test 50 mg/l yellow instead of red
101632 Monochloramine Test 300 mg/l turquoise instead of green
100607 Ozone Test 15 mg/l yellow instead of red
114551 Phenol CT 100 mg/l weakening of color
114831 Silver Test 5 mg/l no change (flocculation)
In some cases the intensity of the color of the solution and thus the ab-
sorbance can drop again when very high concentrations of the analyte
are present. The examples are listed in the following table. The values indi-
cated in the display are cor rect up to the concentrations specified in the
third column, and false measuring values are ob tained above these con-
centrations. In such a case it is necessary to conduct a plau sibility check
by running preliminary tests using test strips or dilution.
2 Photometric Test Kits

7
Release 01/2012
Chemical reactions follow an optimal course only within a certain pH
range. The rea gents contained in the test kits produce an adequate buf-
fering of the sample sol u tions and ensure that the pH optimal for the reac-
tion in question is obtained.
Strongly acidic (pH < 2) and strongly alkaline (pH >12) sample solutions
can prevent the pH from being adjusted to an optimal range, since under
certain circumstances the buffering capacity of the test-kit reagents may
not be sufficient. Any necessary correction is made by the dropwise addi-
tion of diluted acid (reduces the pH) or diluted lye (raises the pH), testing
the pH with suitable indicator strips after each drop is added. The addition
of the acid or lye results in a dilution of the test solution. When up to five
drops are added to 10 ml of sample, the change in the volume can be
neglected, since the resultant error is lower than 2 %. The addition of larg-
er quantities should be duly con sidered by adjusting the sample volume
accordingly.
The specified pH values for the sample solution and, wherever applicable,
for the measurement solution are defined in the respective package
inserts and in the analy sis instruc tions in chapter 3 of the manual.
2 Photometric Test Kits
2.2.2 Influence of pH
The temperature of the sample solution and the reagents may have an
effect on the color reaction and thus on the measurement result
.
The typi-
cal tempe ra ture course is illustrated in the figure.
If the sample temperature is lower than 15 °C, false-low results must be
reckoned with. Temperatures exceeding 30°C generally influence the sta-
bility of the com pound that is formed in the reaction. The optimal tem-
perature for the color reaction is stated in the package inserts of the
respective Spectro quant
®
test kits.
Attention! After thermic decomposition proce dures, the de termina-
tion of COD or total contents of nitro gen, phos pho rus, or metal, a
sufficient wait ing time must be allowed for to permit the solution
cool to room temperature.
2.2.3 Influence of Temperature
Temperature (°C)
Absorbance
20
40
10
30
Most of the color reactions require a certain time to reach the maximum
color in ten sity. The solid curve in the figure at the right gives a schematic
impression of a typical time course. The behavior of relatively instable col-
or reactions with time is shown by the dotted curve.
The reaction time specified in the working instruc tions refers to the period
of time from the addition of the last reagent until the actual measurement.
In addition, the package inserts for the individual test kits also state the
time interval in which the mea sure ment value does not change. The maxi-
mum time inter val is 60 minutes; this time should not be ex ceeded, even in
the case of stable color reactions.
2.2.4 Time Stability
Reaction time (minutes)
Absorbance
30
60
photoLab
®
Series

8
Release 01/2012
photoLab
®
Series
Foreign substances in the sample solution can
•
raise the measurement value as a result of an amplification of the
reaction
•
lower the measurement value as a result of a prevention of the reaction.
A quantification of this effects is stated in tabular form in the respective
package inserts for the most important foreign ions. The tolerance limits
have been deter mined for the indi vidual ions; they may not be evaluated
cumulatively.
Suitability for use in seawater
A tabular survey (see appendix 1) provides infor mation on the suitability of
the tests in connection with seawater and also on the tolerances for salt
concentrations.
2 Photometric Test Kits
2.2.5 Influence of Foreign Substances
2.2.6 Dosing the Reagents
Small amounts of liquids are dosed by counting the number of drops from
a leak proof bottle
.
When using dropper bottles it is extremely important that the
bottle be held vertically and that the drops be added slowly
(approx. 1 drop per second). If this is not observed, the cor-
m
rect drop size and thus the correct amount of reagent are not
achieved.
A positive-displacement pipette should be used for larger quantities of liq-
uid or for the exact dosage of smaller reagent quantities. In these cases
the reagent bottles are not fitted with a dropper insert.
Solid substances are dosed either with the dose-metering cap or with
microspoons that are integrated into the screw cap of the respective rea-
gent bottle. The dose-metering cap is used for solid reagents or reagent
mixtures that are free-flowing.
In all other cases the substances are dosed with the microspoon.
In this case it is necessary to add only level microspoonfuls. To this end
the spoon must be drawn over the brim of the reagent bottle
.
At the first use replace the black screw cap of the reagent bottle by the
dose-metering cap.
Hold the reagent bottle vertically and, at each dosage, press the slide all
the way into the dose-metering cap. Before each dosage ensure that the
slide is completely retracted.
Reclose the reagent bottle with the black screw cap at the
end of the measurement series, since the function of the rea-
m
gent is impaired by the absorption of atmospheric moisture.

The taking of samples is the first and most impor tant step on the way to
obtaining the correct ana lysis result. Not even the most exact method of
analysis can correct any mistakes made in the taking of the sample. The
objective of the sampling proce dure is to gain a sample with a represen-
tative com position. The most important pre condition for gain ing a re-
presentative sample is the identification of the suitable sampling site.
Here it must be borne in mind that the solution to be investigated can dis-
play varying con centrations in different places at different times.
In sampling, a distinction is made between manual and automatic meth-
ods. In many cases a true picture of the average composition of the sam-
ple can be obtained only once several individual samples have been col-
lected; this can be done manually or with an automatic sampler.
Clean plastic containers with a volume of 500 or 1000 ml are suitable for
collecting samples. They should be rinsed several times, under vigorously
shaken, with the water to be investigated, and then filled free of air bub-
bles and immediately closed tightly. The containers must be protected
against the effects of air and heat and then be forward ed for the further
analytical steps as soon as possible. In ex ceptional cases, preserva tion
measures in the form of short-term refrigeration at +2 to +5 °C and
chemical conservation can be taken.
9
Release 01/2012
The Spectroquant
®
test kits are in most cases stable for 3 years when
stored in a cool, dry place. A few test kits have a lower shelf-life of 18 or
24 months or must else be stored in a refrigerator.
COD Cell Tests must be stored protected from light.
The expiry date of the package unit is printed on the outer label. The shelf-
life may become reduced when the reagent bottles are not reclosed tightly
after use or when the test kit is stored at temperatures higher than those
specified.
2 Photometric Test Kits
2.2.7 Shelf-life of the Reagents
3 Sample Preparation
3.1 Taking Samples
Sample preparation covers all the steps necessary before the actual anal-
ysis can be performed.
Parameter Preservation
COD +2 to +5 °C max. 24 h or
–18 °C max. 14 days
N compounds: analyze immediately, only in exceptional case
NH
4
-N, NO
3
-N, NO
2
-N
+2 to +5 °C max. 6 h
P compounds: short-term storage, no preservation;
PO
4
-P, P total with nitric acid to
pH 1, max. 4 weeks
Heavy metals short-term storage, no preservation;
with nitric acid to
pH 1, max. 4 weeks
photoLab
®
Series

10
Release 01/2012
photoLab
®
Series
3 Sample Preparation
3.2 Preliminary Tests
Correct measurement results can be obtained only within the measuring
range spe ci fied for each indi vi dual parameter. When dealing with sample
solutions of an un known concentration, it is advisable to establish whether
the sample concentration is indeed within the specified measuring range,
ideally roughly in the middle of the range.
Preliminary tests enhance the analytical reliability and make the determi-
nation of the necessary dilution ratios in the case of high concentrations
easier. Merckoquant
®
Test Strips are very well suited for preliminary
tests.
3.3 Dilution
Dilution of samples is necessary for two reasons:
•
The concentration of the parameter under investigation is too high, i. e.
it lies out side the measuring range.
•
Other substances contained in the sample interfere with the determina-
tion (matrix interference); false-high or false-low results may ensue.
The following auxiliaries are absolute prerequisites for the dilution of the
sample:
•
Volumetric flasks of varying sizes (e.g. 50, 100 and 200 ml)
•
Positive-displacement pipette
•
Distilled or DI water.
Only dilutions carried out with these auxiliary pro ducts are of sufficient reli-
ability in the area of trace analysis, to which photometry belongs (for the
sim pli fied procedure see page 11).
An important aspect here is that once the volumetric flask has been filled
up to the mark with distilled water the flask is closed and the contents are
thoroughly mixed.
The dilution factor (D
F
) resulting from the dilution procedure is calculated
as follows:
D
F
=
Final volume (total volume)
Initial volume (sample volume)
The analytical result is subsequently multiplied by the dilution factor.
A calculation can be dispensed with when the dilu tion is programmed into
the pho tometer. The dilution number (see the table on page 11) is
entered and the measure ment value is subsequently calculated cor rectly
and immediately displayed.

11
Release 01/2012
photoLab
®
Series
3 Sample Preparation
Desired Volume of Volume of Dilution Dilution
dilution sample
distilled water
factor number
[ml] [ml]
1:2 5 5 2 1+1
1:3 5 10 3 1+2
1:4 2 6 4 1+3
1:5 2 8 5 1+4
1:10 1 9 10 1+9
All dilutions should be made in such a way that the measurement value
lies in the middle of the measur ing range. As a rule, the dilution factor
should never be higher than 100. In the event that yet higher dilu tions
become necessary all the same, then this must be done in two separate
steps.
Example
Step 1: Make up 2 ml of sample to 200 ml with distilled water;
D
F
= 100, dilution number 1+ 99
Step 2: Take 5 ml of the above solution and make up to 100 ml;
D
F
= 20, dilution number 1+19
The dilution factor for the total dilution is calcu lated by multiplying the
individual dilutions:
D
F total
= D
F1
x D
F2
= 100 x 20 = 2000, dilution number 1+1999
Simplified procedure
Dilutions up to 1:10 can also be prepared without volumetric flasks in a
glass bea ker, measuring the volumes of the sample and the dilution water
using a pre viously calibrated positive-displacement pipette (see table for
instructions).
3.4 Filtration
Strongly turbid samples require pretreatment before they can determined
in a photometer, since the effect of turbidity can result in considerable
variations in the measurement values and in false-high readings. Care
must be taken here to ensure that the sub stance to be deter mined is not
contained in the sus pended material, in which case a sample decom-
po si tion must be carried out.
Compounds that always occur in dissolved form (for example ammonium,
nitrate, nitrite, chlorine, chlo ride, cyanide, fluoride, orthophosphate, and
sulfate) permit a previous filtration, even when the sample solution is
strongly turbid.
Weak turbidity is eliminated by the automatic turbi dity-correction
feature built into the photo meter (see Function description, “Device set-up/
Correction function”); in such cases it is not necessary to filter the sample
before analysis.
As a measure to distinguish between dissolved and undissolved water-
borne sub stances, the water sample can be filtered through a simple
paper filter. Following the recommendations stated in the refe rence me-
thods, membrane filters with a pore size of 0.45 µm are required for fine
filtration.

12
Release 01/2012
photoLab
®
Series
3 Sample Preparation
Draw out the liquid
to be filtered with
the syringe.
Screw the syringe
tightly into the front
side of the mem -
brane-filter attach-
ment.
Hold the syringe
upright and slowly
depress the piston
upwards until the
membrane- filter is
fully wetted free of
air bubbles.
Filter the contents
of the syringe into
the intended glass
vessel.
Procedure for microfiltration
As a measure to ensure that a representative sample can be taken in the
presence of suspended matter in the water sample in question, for certain
parameters - e. g. COD and the total content of heavy metals - the sample
must be homogenized. This must be carried out using a high-speed blend-
er (2 minutes at 5000 – 20 000 rpm and taking the sample while stirring.
3.5 Homogenization
Water-borne substances can be present in the sample for investigation in
a variety of forms: as the ion, bound more or less solidly in a complex, or
as a solid substance.
3.6 Decomposition
Complex
Solid
substance
Ion

13
Release 01/2012
photoLab
®
Series
The manner in which the sample is pretreated en ables the three pro-
portions to be dis tinguished from each other. This can be illustrated using
a copper-containing waste water sample as an example.
Decomposition converts the substance to be deter mined into an ana-
lyzable form. In most cases, de composition agents take the form of acids
in com bination with oxidiz ing agents; in exceptional cases (e. g. in the
determination of total nitrogen) an alka line decomposition is more effec-
tive. The type of decomposition procedure used de pends on the analyte to
be determined and the sample matrix.
3 Sample Preparation
Example
Filtration
Filtration
Decomposition
Decomposition
The ready-to-use sample-decomposition products
Spectro
quant
®
Crack
Set 10 and 20 are suited for the preparation of the sample materials for
the determinations stated in the table.
The decomposition processes are carried out in the
Spectro
quant
®
ther-
moreactor (capacity: 12 or 24 decomposition cells) at 120 °C or, respec-
tively, 100 °C. Details regarding the heating times and further treatment
can be found in the package inserts contained in the Spectroquant
®
Crack Set packs.
Determination of Sample preparation with
Total phosphorus* Crack Set 10 / 10C**
Total chromium* Crack Set 10 / 10 C
[= sum of chromate and chromium(III)]
Total metal Crack Set 10 / 10 C
[= sum of free and complex-bound metal]
Total nitrogen* Crack Set 20
* The decomposition reagents are already contained in the packs of the respective cell tests.
** Decomposition cells are included in the pack; empty cells are required for the decomposition for
Crack Sets 10 and 20.
Total content Dissolved proportion Dissolved proportion
Solid Substances
Cu(OH)
2
Complexes Cu-EDTA Complexes Cu-EDTA
Ions Cu
2+
Ions Cu
2+
Ions Cu
2+
Result A Result B Result C
Proportion:
Ionogenic = C
Complex = B– C
Solid Substances = A –B
Total content = A

14
Release 01/2012
photoLab
®
Series
3 Sample Preparation
In the event that the sample to be analyzed is a highly contaminated ma-
terial (high proportion of organic substances) or water-insoluble samples,
decomposition using concentrated acids and other agents is in dispensible
.
Corresponding examples from the collection of applications for real sam-
ples are available on request.
The necessity for decomposition can be checked according to the follow-
ing diagram:
For wastewater with a consistent composition, this check as a rule need
be carried out only once. It is, however, advisable to check the result peri-
odically.
4 Pipetting System
Positive-displacement pipettes permit
•
an exact dosage of the sample volume
•
a precise measurement of sample and reagent volumes and of the
volumes of water for dilution purposes
.
Pipettes of varying volumes and also ones with a fixed volume are available.
Sources of error and hints on how to avoid them:
•
Closely follow the instructions for use contained with the pipette in
question.
•
Check the pipetted volumes
a)
by weighing using analytical scales (weighing ac cu racy ±1 mg),
1 ml of water at 20 °C = 1.000 g ±1 mg
b) using Spectroquant
®
PipeCheck;
this is a pho tometric check of the pipette, and scales are not
necessary (see section “AQA”).
•
Avoidance of spread effects by rinsing the pipette several times with
the solution to be pipetted.
•
Always exchange the pipette tip.
•
Draw up the liquid slowly and depress piston completely to discharge
the liquid.
Decomposition
Measurement
Result A
A and B
idential?
No decomposition
necessary
Yes
Procedure
Measurement
Result B
Procedure
No
Decomposition
necessary

15
Release 01/2012
photoLab
®
Series
5 Analytical Quality Assurance (AQA)
The objective of analysis must always be to determine the true content of
the analyte in question as accurately and precisely as possible.
Analytical Quality Assurance represents a suitable and indispensible
method by which the quality of the user's own work can be assessed,
errors in the measurement system diagnosed, and the comparability with
the results obtained using the respec tive refe rence methods demonstrated.
Details regarding the necessity of AQA can be found
in the in Memoran-
dum A 704 of the German Association for the Water Sector, Wastewater,
and Waste Materials (Deutsche Vereinigung für Wasserwirtschaft, Abwas-
ser und Abfall e.V., DWA)
and in the corresponding self-con trol/self-moni-
toring regulations of the Ger man federal states (available in english).
Causes for errors can include:
•
the working materials used
•
the handling
•
the sample under investigation.
These errors have effects on both the accuracy and precision of the
results obtained.
Photometers and photometric test kits possess specifications that are
adhered to and above all else also documented by the manufacturer.
The certificate for the photometer enclosed with each device docu-
ments the quali ty of the measuring device.
5.1 Quality Control at the Manufacturer

16
Release 01/2012
photoLab
®
Series
5 Analytical Quality Assurance (AQA)
The certificate for the test kit, available for each lot produced, docu-
ments the quality of the reagents contained in the test kit.
Calibration function:
The calculated function must agree, within specified tolerances, with the
function electronically stored in the photometer.
Confidence interval:
Maximum deviation from the desired value over the entire mea suring
range; every measurement value can be affected by this deviation; this
parameter is a measure for the accuracy.
Standard deviation for the procedure:
Measurement for the dispersion of the measurement values over the
entire measuring range, ex pressed in ±mg/l.
Coefficient of variation for the procedure:
Measurement for the dispersion of the measurement values over the
entire measuring range, ex pressed in %. The smaller the standard devia-
tion/ coefficient of variation for the procedure, the more pronounced the
linearity of the calibration curve.
5.2 Quality Control for the User
= Test for the
overall system
Checking the
working equip-
ment
Pipette Test kit Photometer Thermoreactor
Checking the
handling
operations
Test for recovery
Carefully pipette 3.0 ml
of the sample into a
reaction cell, close tight-
ly with the sc re w cap,
an d mi x vigorously.
Caution, the cell
becomes very hot!
Suspend the bottom
sediment in the cell by
swirling.
Heat the reaction cell in
the thermoreactor at
148 °C for 2 hours.
Remove the reaction
cell from the thermo-
reactor and place in a
test-tube rack to cool.
Swirl the cell after
10 minutes.
Influence of the sample
M
isc
he
n
K
ü
vet
te wird
he
iß,
am
Ve
rsch
lu
ss
a
nfa
ssen
2 m
l P
rob
elösung
in
ein
Re
aktions
-
küvet
te
geben
im
The
rm
oreaktor
erh
it
ze
n
1
48
C, 1
20
min
mind. 10 mi
n
abküh
len
Abk
üh
le
n
auf
Raum
t
em
pe
r
atur
(m
ind
. 3
0 mi
n)
Mi
schen
M
es
sen
C2/25
C
S
B
150
0
Ch
e
m
i
s
c
h
e
r
Sa
u
e
r
s
t
of
fbe
d
a
r
f
Me§be
r
e
i
c
h
1
0
0
150
0
m
g/l
C
S
B
1
4
.
7
2
5
8
0
3
6
9
C
14
m
m
A complete check comprises the entire system, i. e. the working equipment
and the mode of operation. The photometer offers an optimum degree of
support in this re gard, in the form of the different quality mode. The instru-
ment, or the whole system (includ ing reagents and all accessories) will be
checked, depending on which quality mode selected. All of checking oper-
ations can thus be supported by the pho tometer and the check values
accordingly docu mented as per GLP (Good Laboratory Practice) recom-
mendations (see Function description, “Analytical Quality Assurance”).
The following diagram provides an overview regarding internal quality-
assurance aspects:
Art.Nr. / Cat.No. / Art. Nro. 1.14560.0001
Messbereich
Measuring Range / Inte rvalo de medida
4,0 - 40,0 mg/l CSB/COD/DQO
Sollwert
Target value
Valor nominal
(Standard / Patrón)
mg/l
CSB/COD/DQO
Messergebnis
Result / Resultado
(Standard / Patrón)
mg/l
CSB/COD/DQO
Charge-Nr. / Lot no. / Lot e nro. HC119527 4,0 4,7
8,0 8,7
12,0 11,8
Standard / Standard / Patrón Potassium hydrogen phthalate 1.02400 16,0 16,4
Photometer / Photometer / Fotómetro Referenz / Reference / Referencia 20,0 19,9
Wellenlänge / W avelength / Longitud de onda 340 nm 24,0 24,1
Küvette / Cell / Cubeta 16 mm rund / round / redonda 28,0 28,4
Prüfer / Tester / Verificador Fr. Brandner 32,0 32,4
Datum / Date / Fecha
20.09.2011 36,0 36,3
Datei / File / Fichero 1145600001_HC119527_EN 40,0 40,2
Sollwert
Target value
Valor nominal
Chargenwert
Lot value
Valor del lote
1,00 ± 0,03 0,99
99
0,4
1,410 ± 0,020 A 1,403 A
99
± 1,0 mg/l ± 0,8 mg/l
99
± 0,3 mg/l
99
± 2,5 % ± 1,4%
99
Merck KGaA
Qualitätskontrolle Laborleiter / Head of Lab.
Quality control / Control de calidad Jefe de laboratorio
n = 10
Verfahrensvariationskoeffizient
Variation Coefficient of the Method / Coeficiente de variación del procedimiento
31.10.2012
Reag.blindwert / Reagent blank / Valor en blanco del react +/- Tolerance / Tolerancia
Verfahrensstandarda bweichung
Standard Deviation of the Method / Desviación est ándar del procedimie nto
Vertrauensbereic h (95% Wahrscheinli chkeit)
Confidential interval (P=95%) / Intervalo de confianza (95 % de probabilidad)
Spectroquant
®
CSB-Küvettentest
Spectroquant
®
COD Cell Test / Spectroquant
®
Test en cubetas DQO
Chargenzertifikat
Lot Certificate / Certificado del lote
Ordinatenabschnitt / Ordinate segment / I ntersecto en ordenadas
Kalibrierfunkti on / Calibration Functi on / Función de calibraci ón
DIN 38402 A51 / ISO 8466-1
Steigung / Slope / Pendiente +/- Tolerance / Tolerancia
Verwendbarkeit
Expiry date / Fecha de caduci dad
0,0
5,0
10,0
15,0
20,0
25,0
30,0
35,0
40,0
0,0 5,0 10,0 15,0 20,0 25,0 30,0 35,0 40,0
Messergebnis / Result / Resultado (mg/l)
Sollwert / Target value / Valor nominal (mg/l)

Test for the overall system includes checking the working equipment and
checking the handling operations.
The overall system can be checked using standard solutions of a known
content, preferably with the Spectroquant
®
CombiCheck; this corres ponds
with the AQA 2 mode in the photometer.
Spectroquant
®
CombiCheck are ready-to-use standard solutions that in
terms of the analyte concentration are finely adjusted to the individual test
kits. They contain a mixture of several analytes that do not interfere with
each other. The stan dard solution (R-1) is used in the same way as a
sample. A double determination is recommended as a measure to
diagnose any random errors.
Standard solutions for photometric applications (CRM) are ready-to-
use standard solutions that in terms of the analyte concentration are finely
adjusted to the individual test kits. The standard solution is used in the
same way as a sample. A double determination is recommended as a
measure to diagnose any random errors.
In addition to the CombiCheck and the standard solutions for photometric
applications, it is also possible to use CertiPUR
®
stan dard solutions for
this checking procedure. These contain 1000 mg of the respective analyte
per liter of solution.
They can be diluted to different final con cen trations, which should prefer-
ably lie approxi mately in the middle of the mea sur ing range of the re spec-
tive test kit. The table presented in Appendix 2 pro vides an over-view of
the available CombiCheck and ready-to-use standard solu tions.
17
Release 01/2012
photoLab
®
Series
5 Analytical Quality Assurance (AQA)
5.2.1 Checking the Photometer
5.2.2 Checking the Overall System
As soon as the photometer is activated it is running a Self-Check. This
means the hardware and the soft ware of the photometer is checked and
compared with internal standards.
As soon as the photometer is activated it is running a Self-Check. This
means the hardware and the soft ware of the photometer is checked and
compared with internal standards.
The photometer itself is checked in the AQA 1 mode with the
Spec tro quant
®
Photo Check: the pack in cludes round cells con tain ing
stable
test solu tions (secondary
stan dards) for checking the photo meter
at the
445, 525, and 690 nm wave lengths. The test solutions
are measured
in a refe rence photo me ter monitored with primary standards, and the
certificate stating the absorbance values is enclosed with the package
unit. These desired values with the per missible tolerances are entered into
the pho tometer or else handwritten into the control chart. For the meas-
ure ment the cell is placed in the compartment for the round cell and identi-
fied by the photometer via the bar code, and the measured absorbance is
com pared with the de sired value. The ab sorbance is shown on the display
and can be entered into the corresponding control chart.
The measurement of four cells for a given wavelength tests – in addition to
the wavelength accuracy – also the linearity of the absorbance over the
effective range.
The verification of the instrument, as it is required by DIN/ISO 9000 or
GLP, can be easily performed by using the Spec tro quant
®
PhotoCheck.
The PhotoCheck hence offering the possibility to check the instrument. All
of the corresponding documentation, required by these certifi cation guide-
lines, is done by the photometer auto ma tically.
Mischen
Küvette
wird heiß
,
am Verschluss
anfass
en
2 ml Probelösung
in ein
Reaktions-
küvette geben
im
Thermore
a
ktor
erh
it
zen
148 C, 12
0 min
mind. 10 min
abkühlen
Abk
ühlen
a
uf
Raumt
em
pera
tur
(min
d. 30 min
)
M
isc
he
n
Messen
C2/25
C
S
B
150
0
Ch
e
m
is
c
h
e
r
Sa
u
e
r
s
t
offbe
d
a
r
f
Me§be
r
e
i
ch
1
0
0
150
0
mg/l C
S
B
1
4
.
7
2
5
8
0
3
6
9
C
14
m
m

18
Release 01/2012
photoLab
®
Series
5 Analytical Quality Assurance (AQA)
Due to li mited shelf-life characteristics, there are no CombiCheck or
ready-to-use standard solutions for certain parameters. Appendix 3 is a
compilation of standard working procedures necessary to make your
own solutions of a defined concentration. This allows the control of param-
eters where there are no simple to prepare solutions available.
If the test for the overall system shows that all requirements are fulfilled,
the individual results are flagged as AQA2. If not, an error message is giv-
en and the individual components of the instrument have to be checked in
detail.
The Spectroquant
®
PipeCheck is used to check the pipettes. The pack
contains cells filled with color-dye concentrates. After the addition of a
predefined volume
of water using the pipette in question, the
cell is meas-
ured against a corre sponding reference cell also contained in the pack.
The difference in the absorbance values of the measurement cell and ref-
erence cell may not exceed the tolerances given in the package insert.
If the tolerances are exceeded, the instructions given in the section
“Pipetting system” must be followed accordingly.
5.2.3 Checking the Pipettes
This is checked by means of the thermosensor. The thermoreactor is pre-
heated as described in the Instructions for use. When the control lamp
goes out, the temperature is measured in any one of the bores of the ther-
moreactor
.
The following desired temperatures must be achieved:
Block temperature 100 °C = desired temperature 100 ±3 °C
Block temperature 120 °C = desired temperature 120 ±3 °C
Block temperature 148 °C = desired temperature 148 ±3 °C
The even distribution of the temperature over all bores can also be docu-
mented using the thermosensor.
5.2.4 Checking Thermoreactors
/