Page is loading ...

User Guide | EVAL-ADAQ23875
UG-1896
Evaluating the ADAQ23875 16-Bit, 15 MSPS μModule Data Acquisition Solution
PLEASE SEE THE LAST PAGE FOR AN IMPORTANT
WARNING AND LEGAL TERMS AND CONDITIONS. Rev. A | 1 of 23
FEATURES
►ADAQ23875 15 MSPS, 16-bit µModule evaluation board
►Versatile analog signal conditioning circuitry
►On-board reference, LDO, and power supply circuits
►PC software for control and data analysis of time and frequency
domain
►System demonstration platform-compatible (SDP-H1)
EVALUATION BOARD KIT CONTENTS
►EVAL-ADAQ23875FMCZ evaluation board
EQUIPMENT NEEDED
►PC running Windows 10 or higher
►SDP-H1 (EVAL-SDP-CH1Z) controller board
►Low noise, precision signal source (such as the SYS-2700 ser-
ies)
►Standard USB A to USB mini-B
►Band-pass filter suitable for 16-bit testing (value based on signal
frequency)
SOFTWARE NEEDED
►EVAL-ADAQ23875FMCZ ACE plug-in
►SDP-H1 driver
GENERAL DESCRIPTION
The EVAL-ADAQ23875FMCZ evaluation board enables simplified
evaluation of the ADAQ23875 15 MSPS, 16-bit, high speed, pre-
cision µModule® data acquisition solution. The evaluation board
demonstrates the performance of the ADAQ23875 µModule and is
a versatile tool for a variety of applications.
The ADAQ23875 µModule combines multiple common signal proc-
essing and conditioning blocks in a single device that includes a
low noise, fully differential analog-to-digital converter (ADC) driver,
a stable reference buffer, a high resolution, 16-bit, 15 MSPS suc-
cessive approximation register (SAR) ADC, and the critical passive
components necessary for optimum performance. A full description
of this product is available in the ADAQ23875 data sheet, which
must be consulted when using the evaluation board.
The EVAL-ADAQ23875FMCZ evaluation board interfaces with the
high speed system demonstration platform, SDP-H1 (EVAL-SDP-
CH1Z) via a 160-pin connector, as shown in Figure 2.
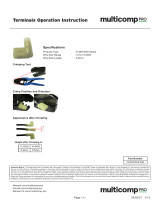
EVALUATION BOARD PHOTOGRAPH
Figure 1.

User Guide EVAL-ADAQ23875
TABLE OF CONTENTS
analog.com Rev. A | 2 of 23
Features................................................................ 1
Evaluation Board Kit Contents...............................1
Equipment Needed................................................1
Software Needed...................................................1
General Description...............................................1
Evaluation Board Photograph................................1
Evaluation Board Hardware...................................3
Setting Up the Evaluation Board ....................... 3
SDP-H1 Controller Board...................................3
Power Supplies.................................................. 3
Analog Inputs .................................................... 3
Link Configuration Options.................................4
Evaluation Board Connectors................................5
Software Installation ............................................. 6
Installing the ACE Software................................6
Software Operation................................................8
Launching the Software......................................8
Exiting the Software........................................... 8
Description of Analysis Window ........................ 8
Troubleshooting...................................................13
Connecting the EVAL-ADAQ23875FMCZ
and the SDP-H1 to the PC............................. 13
Verifying the Board Connection........................13
Disconnecting the EVAL-ADAQ23875FMCZ .. 13
Board Layout Guidelines..................................13
Mechanical Stress ...........................................14
Evaluation Board Schematics..............................15
Ordering Information ...........................................21
Bill of Materials.................................................21
Notes................................................................23
REVISION HISTORY
10/2022—Rev. 0 to Rev. A
Changes to Figure 2........................................................................................................................................ 3
Changes to Table 4..........................................................................................................................................5
Changes to Waveform Graph Section............................................................................................................. 8
Changes to Figure 11.....................................................................................................................................10
Added Figure 12; Renumbered Sequentially.................................................................................................10
11/2020—Revision 0: Initial Version

User Guide EVAL-ADAQ23875
EVALUATION BOARD HARDWARE
analog.com Rev. A | 3 of 23
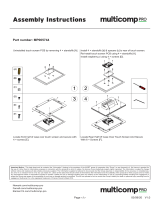
Figure 2. Simplified Evaluation Block Diagram
SETTING UP THE EVALUATION BOARD
Figure 2 shows the simplified evaluation board block diagram of
the EVAL-ADAQ23875FMCZ connected to the SDP-H1 controller
board. The board consists of one µModule (U1, ADAQ23875), a
choice of a 4.096 V reference (U5, LTC6655) or 2.048 V reference
(U3, ADR4520), on-board power supplies to derive the necessa-
ry supply rails using the LTM8049 (U6), the ADP7118 (U4), the
ADP7183 (U7), the LT3023 (U8), and an 800 MHz clock distribution
IC (U13). The user also has an option to use the A2 and A3
amplifiers, such as the ADA4899-1 and the ADG774 (U2), when
evaluating the ADAQ23875.
SDP-H1 CONTROLLER BOARD
The EVAL-ADAQ23875FMCZ evaluation board uses an SPI inter-
face and is connected to the high speed controller board for the
system demonstration platform (SDP-H1) controller board. The
SDP-H1 board requires power from a 12 V wall adapter. The
SDP-H1 has a Xilinx® Spartan 6 and an ADSP-BF527 processor
with connectivity to the PC through a USB 2.0 high speed port. The
controller boards allow the configuration and capture of data on the
daughter boards from the PC via a USB.
The SDP-H1 has an FMC low pin count (LPC) connector with
full differential LVDS and singled-ended LVCMOS support. It also
features the 160-pin connector, found on the SDP-B, which expos-
es the Blackfin® processor peripherals. This connector provides
a configurable serial, parallel I2C and SPI, and general-purpose
input/output (GPIO) communications lines to the attached daughter
boar for the functional description of the on-board power supplies.
POWER SUPPLIES
By default, all necessary supply rails on the EVAL-
ADAQ23875FMCZ are powered by a 3.3 V rail coming from the
SDP-H1 board. The EVAL-ADAQ23875FMCZ can be powered from
an external 3.3 V supply applied using the JP9 solder link if desired
(see Table 2). The EVAL-ADAQ23875FMCZ positive rails, 7 V
(+VS), 5 V (VDD), and 2.5 V (VIO), are generated from a combi-
nation of the power µModule, U6 (LTM8049), U4 (ADP7118-2.5),
and a dual output LDO, U8 (LT3023). The EVAL-ADAQ23875FMCZ
negative rail, −2.0 V (−VS), is generated by a combination of the
power µModule, U6 (LTM8049), and U7 (ADP7183). Each supply
rail includes necessary decoupling capacitors placed closed to the
device. A single ground plane is used on this board to minimize the
effect of high frequency noise interference.
Table 1. On-Board Power Supplies
Power Supply (V) Function
+7.5, −2.5 Supply rails using the LTM8049
+7 (default) VS+ rail using the LT3023
−2 (default) VS− rail using the ADP7183
+2.5 VIO rail using the ADP7118
+5 VDD rail using the LT3023
ANALOG INPUTS
The SMA connectors on the EVAL-ADAQ23875FMCZ (VIN+ and
VIN−) provide analog inputs from a low noise, audio precision sig-
nal source (such as the SYS-2700 or the SYS-x555 series). There
are three options available to feed analog inputs directly to the
ADG774, the ADA4899-1, and the ADAQ23875, as shown in Figure
21. To test the multiplexed functionality using the ADG774 (U2)
CMOS multiplexer in front of the ADAQ23875 (U1), the positive and
negative differential inputs of the ADG774 are switched continuous-
ly to generate a full-scale step. The optional amplifiers, ADA4899-1
(A2, A3), can be set up in a unity-gain configuration driving the
ADAQ23875. In a default configuration of board, an input signal via
VIN+ and VIN− can be fed directly to the ADAQ23875 by bypassing
U2, A2, and A3.

User Guide EVAL-ADAQ23875
EVALUATION BOARD HARDWARE
analog.com Rev. A | 4 of 23
The EVAL-ADAQ23875FMCZ is factory configured to provide the
appropriate input signal type, single-ended or fully differential, and
different gain/attenuation or input range scaling. Table 2 lists the
necessary jumper positions and link options for different configura-
tions. The default board configuration presents 4.096 V on the
REFBUF pin. The default board configuration also presents a
buffered 2.048 V (midscale) at the VCMO pin of the FDA on the
ADAQ23875.
To evaluate dynamic performance, a fast Fourier transform (FFT),
integral nonlinearity (INL), differential nonlinearity (DNL), or time
domain (waveform, histogram) test can be performed by applying
a very low distortion ac source (see Figure 14 to Figure 18). For
low input frequency testing below 100 kHz, it is recommended
to use a low noise, audio precision signal source (such as the
SYS-2700 series) with the outputs set to balanced floating. A
different precision signal source can be used alternatively with
additional band-pass filtering. The filter bandwidth depends on input
bandwidth of interest.
LINK CONFIGURATION OPTIONS
Multiple link options must be set correctly for the appropriate
operating setup before applying the power and signal to the EVAL-
ADAQ23875FMCZ. Table 2 shows the default link positions for the
EVAL-ADAQ23875FMCZ.
Table 2. Link Options for the EVAL-ADAQ23875FMCZ
Link Default Function Comment
JP3 Center to B FPGA CNV+ Change center to A when using ADC_PLL_CNV+.
JP4 Center to B FPGA CNV− Change center to A when using ADC_PLL_CNV−.
JP5 Center to A AMP+ Change center to B when using an external supply.
JP6 Center to A AMP− Change center to B when using an external supply. If configured to single supply
VS− to GND, remove both jumpers (JP6) and install R49 (0 Ω).
JP9 Center to A 3.3 V Change center to B when using an external 3.3 V supply.
P1 Tie Pin 2 and Pin 3
(connected to GND)
Two-lane digital output modes Digital input that enables two-lane output mode. Use this jumper to select either
single-lane or two-lane data output mode. The default setting is Pin 2 and Pin 3.
The Pin 2 and Pin 3 setting clocks out all data on the DA± pin. The Pin 1 and Pin 2
setting clocks out data alternately on the DA± and DB± pins.
P2 No connect ADCIN− Negative input of an internal ADC. Extra capacitance can be added on this pin to
reduce the RC filter bandwidth. Optional for the ADAQ23875.
P3 No connect ADCIN+ Positive input of an internal ADC. Additional capacitance can be added on this pin
to reduce the RC filter bandwidth. Optional for the ADAQ23875.
P4 Tie Pin 1 and Pin 2 PDB_AMP Active low. Connect this pin to GND to power-down the fully differential ADC driver.
Otherwise, connect it to VS+.
P5 Not applicable SDP-H1 FMC connector The EVAL-ADAQ23875FMCZ board interfaces to the SDP-H1 board via a 160-pin
connector.
P6 Tie Pin 1 and Pin 2 PDB_ADC Digital input that enables the power-down mode. When PDB_ADC is low, an
internal ADC core enters power-down mode, and all circuitry (including the LVDS
interface) is shut down. When PDB_ADC is high, the device operates normally.
Logic levels are determined by VIO.
P7 0 Ω installed −VS for the ADA4899-1 (A2, A3) Remove 0 Ω to use the external supply for the ADA4899-1 (A2, A3).
P8 0 Ω installed +VS for the ADA4899-1 (A2, A3) Remove 0 Ω to use the external supply for the ADA4899-1 (A2, A3).

User Guide EVAL-ADAQ23875
EVALUATION BOARD CONNECTORS
analog.com Rev. A | 5 of 23
The functional descriptions for all the connectors (including a 160-
pin FMC connector used to interface with the SDP-H1) used on
the EVAL-ADAQ23875FMCZ are listed in Table 2 and Table 3,
respectively.
There are several test points and single in line (SIL) headers on the
EVAL-ADAQ23875FMCZ. These test points provide easy access to
on-board signals for troubleshooting and evaluation purposes.
Table 3. On-Board Connectors
Connector Function
J1 CLKIN input
J2 EXT_CNV−
J3 External CLK input
J4 EXT_CNV+
VIN+ Analog input V+
VIN− Analog input V−
+3P3V External power supply
P5 SDP-H1 FMC connector
Table 4. 160-Pin FMC Connector (P5) Details
Signals Function
OSC_CLK+ 100 MHz low jitter positive line of differential pair for carrying clock signals from the daughter board.
OSC_CLK− 100 MHz low jitter negative line of differential pair for carrying clock signals from the daughter board.
CLK± ADAQ23875 CLK input signals connected to FPGA Bank 2.1, 2
CLK− ADAQ23875 CLK input signals connected to FPGA Bank 2.1, 2
DCO+ Positive line of differential pair for carrying clock signals from the daughter board.
DCO− Negative line of differential pair for carrying clock signals from the daughter board.
FPGA_CNV+ User defined signals connected to FPGA Bank 2.1, 2
FPGA_CNV− User defined signals connected to FPGA Bank 2.1, 2
DA± User defined signals connected to FPGA Bank 2.1
DB± User defined signals connected to FPGA Bank 2.1
+3P3V_FMC 3.3 V (3 A) power supply to daughter board.
SCL I2C clock line for reading FMC EEPROM.
SDA I2C data line for reading FMC EEPROM.
GA0 I2C geographical Address 0. Must be connected to Address Pin A1 of the FMC EEPROM.
GA1 I2C geographical Address 1. Must be connected to Address Pin A0 of the FMC EEPROM.
3P3VAUX 3.3 V (20 mA) power supply for powering only the FMC EEPROM.
PG_C2M Active high signal indicating that the 12P0V, 3P3V, and VADJ power supplies are turned on.
CNV_EN User defined signals connected to FPGA Bank 2.1
1User defined signals with a P suffix can be used as the positive pin of the differential pair. User defined signals with an N suffix can be used as the negative pin of the
differential pair. For further information, see the VITA 57 specification.
2User defined signals with a CC suffix are the preferred signal lines on which to transmit clock signals from the controller board to the daughter board. These signal lines are
connected to global clock lines on the FPGA, but they can also be used to carry any other user defined signal. For further information, see the VITA 57 specification.

User Guide EVAL-ADAQ23875
SOFTWARE INSTALLATION
analog.com Rev. A | 6 of 23
Before using the EVAL-ADAQ23875FMCZ, download and install
the ACE (Analysis, Control, Evaluation) software. Download
the software from https://www.analog.com/ en/design-center/evalu-
ation-hardware-and-software/ace-software.html.
ACE is a desktop software application allowing the evaluation and
control of multiple evaluation systems across the Analog Devices
product portfolio. The installation process consists of the ACE
software installation and the SDP-H1 driver installation.
To ensure that the evaluation system is correctly recognized when
it is connected to the PC, install the ACE software and the SDP-
H1 driver before connecting the EVAL-ADAQ23875FMCZ and the
SDP-H1 board to the USB port of the PC.
INSTALLING THE ACE SOFTWARE
To install the ACE software, take the following steps:
1. Download the ACE software to a Windows-based PC.
2. Double-click the ACEInstall.exe file to begin the installation.
By default, the software is saved to the following location:
C:\Program Files (x86)\Analog Devices\ACE.
3. A dialog box appears asking for permission to allow the pro-
gram to make changes to the PC. Click Yes to begin the
installation process.
4. Click Next > to continue the installation, as shown in Figure 3.
Figure 3. Evaluation Software Install Confirmation
5. Read the software license agreement and click I Agree (see
Figure 4).
Figure 4. License Agreement
6. Choose an installation location and click Next > (see Figure 5).
Figure 5. Choose Install Location
7. Select the PreRequisites checkbox to include the installation of
the SDP-H1 driver. Click Install (see Figure 6).
Figure 6. Choose Components
8. The Windows Security window appears. Click Install (see
Figure 7). The installation is in progress. No action is required
(see Figure 8).


User Guide EVAL-ADAQ23875
SOFTWARE OPERATION
analog.com Rev. A | 8 of 23
LAUNCHING THE SOFTWARE
When the EVAL-ADAQ23875FMCZ and SDP-H1 boards are prop-
erly connected to the PC, launch the ACE software. To launch the
ACE software, take the following steps:
1. From the Start menu, select All Programs > Analog Devices
> ACE > ACE.exe to open the main software window shown in
Figure 10.
2. The EVAL-ADAQ23875FMCZ icon appears in the Attached
Hardware section.
3. If the EVAL-ADAQ23875FMCZ is not connected to the
USB port via the SDP-H1 board when the software is
launched, the EVAL-ADAQ23875FMCZ board icon does not
appear in the Attached Hardware section. Connect the EVAL-
ADAQ23875FMCZ and SDP-H1 board to the USB port of the
PC and wait a few seconds, then continue following these
instructions.
4. Double-click the EVAL-ADAQ23875FMCZ board icon to open
the window shown in Figure 10.
5. Click Software Defaults and then click Apply Changes.
6. Click Proceed to Analysis to open the EVAL-
ADAQ23875FMCZ analysis shown in Figure 11.
EXITING THE SOFTWARE
To exit the software, click file icon on the upper right tab and then
click Exit.
DESCRIPTION OF ANALYSIS WINDOW
Click Proceed to Analysis in the chip view window to open the
window shown in Figure 14. The analysis view contains the Wave-
form tab, Histogram tab, FFT tab, INL tab, and DNL tab.
Waveform Tab
The Waveform tab displays results in time domain, as shown in
Figure 14. The Capture pane contains the capture settings, which
reflect in the registers automatically before data capture.
Capture Pane
The Sample Count dropdown list in the General Capture Settings
section allows the user to select the number of samples per chan-
nel per capture.
The user can enter the input sample frequency in kSPS in the Sam-
pling Frequency (KSPS) box in the General Capture Settings
section. Refer to the ADAQ23875 data sheet to determine the
maximum sampling frequency for the selected mode.
Click Run Once in the Device Settings section to start a data
capture of the samples at the sample rate specified in the Sample
Count dropdown list. These samples are stored on the FPGA
device and are only transferred to the PC when the sample frame is
complete.
Click Run Continuously in the Device Settings section to start a
data capture that gathers samples continuously with one batch of
data at a time.
Results Pane
The Display Channels section allows the user to select which
channels to capture. The data for a specific channel is only shown if
that channel is selected before the capture.
The Waveform Results section displays amplitude, sample fre-
quency, and noise analysis data for the selected channels.
Click Export to export captured data. The waveform, histogram,
and FFT data is stored in .xml files, along with the values of
parameters at capture.
Waveform Graph
The data waveform graph shows each successive sample of the
ADAQ23875 output. The user can zoom in on and pan across the
waveform using the embedded waveform tools. The channels to
display can be selected in the Display Channels section.
Click the display unit’s dropdown list (shown with the Codes option
selected in Figure 14) to select whether the data graph displays
in units of hexadecimal, volts, or codes. The axis controls are
dynamic.
When selecting either y-scale dynamic or x-scale dynamic, the
corresponding axis width automatically adjusts to show the entire
range of the ADAQ23875 results after each batch of samples.
Histogram Tab
The Histogram tab contains the histogram graph and the Results
pane, as shown in Figure 15.
The Results pane displays the information related to the dc per-
formance.
The histogram graph displays the number of hits per code within
the sampled data. This graph is useful for dc analysis and indicates
the noise performance of the device.
FFT Tab
The FFT tab displays FFT information for the last batch of samples
gathered, as shown in Figure 16. The FFT also allows the over-
sampling function with OSR up to 256×, as shown in Figure 19.
As a general rule, oversampling by a factor of four provides one
additional bit of resolution, or a 6 dB increase in dynamic range
(DR) of the ADAQ23875. In other words,
ΔDR = 10 × log10 (OSR) (in dB)

User Guide EVAL-ADAQ23875
SOFTWARE OPERATION
analog.com Rev. A | 9 of 23
INL, DNL Tab
The INL and DNL tab displays linearity analysis. INL is the devia-
tion of each individual code from a line drawn from negative full
scale through positive full scale. The point used as negative full
scale occurs ½ LSB before the first code transition. Positive full
scale is defined as a level 1½ LSB beyond the last code transition.
The deviation is measured from the middle of each code to the true
straight line.
In an ideal ADC, code transitions are 1 LSB apart. DNL is the
maximum deviation from this ideal value. DNL is often specified in
terms of resolution for which no missing codes are guaranteed.
To perform a linearity test, apply a sinusoidal signal with 0.5 dB
above full scale to the EVAL-ADAQ23875FMCZ board at the VIN+
and VIN− Subminiature Version A (SMA) inputs. Set the number
of hits per code and adjust to the desired accuracy. Using a large
number of hits per code results in a significant test time. Figure
17 and Figure 18 display captured data that includes the ±INL and
±DNL positions.
Analysis Pane
The General Settings section allows the user to set up the prefer-
red configuration of the FFT analysis. This configuration sets how
many tones are analyzed and if the fundamental is set manually.
The Windowing section allows the user to set up the preferred
windowing type to use in the FFT analysis and the number of
harmonic bins and fundamental bins that must be included in the
analysis.
The Single Tone Analysis and the Two-Tone Analysis sections
sets up the fundamental frequencies included in the FFT analysis.
When one frequency is analyzed, use the Single Tone Analysis
section. When two frequencies are analyzed, use the Two-Tone
Analysis section.
Results Pane
The Signal section displays the sample frequency, fundamental
frequency, and fundamental power.
The Noise section displays the signal-to-noise ratio (SNR) and
other noise performance results.
The Distortion section displays the harmonic content of the sam-
pled signal and dc power when viewing the FFT analysis.
Figure 10. EVAL-ADAQ23875FMCZ ACE Software Main Window


User Guide EVAL-ADAQ23875
TROUBLESHOOTING
analog.com Rev. A | 13 of 23
The SDP-H1 board is the communication link between the PC and
the EVAL-ADAQ23875FMCZ. Figure 2 shows a diagram of the con-
nections between the EVAL-ADAQ23875FMCZ and the SDP-H1
board.
To ensure that the evaluation system is correctly recognized when
it is connected to the PC, install the ACE software and the SDP-
H1 driver before connecting the EVAL-ADAQ23875FMCZ and the
SDP-H1 board to the USB port of the PC.
When the software installation is complete, set up the EVAL-
ADAQ23875FMCZ and the SDP-H1 board as described in the
following sections.
CONNECTING THE EVAL-ADAQ23875FMCZ
AND THE SDP-H1 TO THE PC
To connect the EVAL-ADAQ23875FMCZ and the SDP-H1 board to
the PC, take the following steps:
1. Ensure that all configuration links are in the appropriate posi-
tions, as described in Table 1.
2. Connect the EVAL-ADAQ23875FMCZ securely to the 160-way
connector on the SDP-H1 board. The EVAL-ADAQ23875FMCZ
does not require an external power supply adapter.
3. Connect the SDP-H1 board to the PC via the USB cable
enclosed in the SDP-H1 kit. Refer to Figure 2.
VERIFYING THE BOARD CONNECTION
To verify the board connection, take the following steps:
1. Allow the found new hardware wizard to run after the SDP-H1
board is plugged in to the PC. If using Windows XP®, search
for the SDP-H1 drivers. Choose to automatically search for
the drivers for the SDP-H1 board if prompted by the operating
system.
2. A dialog box may appear asking for permission to allow the
program to make changes to the computer. In this case, click
Yes. The Computer Management window opens.
3. Under System Tools, click Device Manager and use
the Device Manager window to ensure that the EVAL-
ADAQ23875FMCZ is connected to the PC properly.
4. If the SDP-H1 driver software is installed and the board is
connected to the PC properly, Analog Devices SDP-H1 ap-
pears under ADI Development Tools in the Device Manager
window, as shown in Figure 20.
Figure 20. Windows Device Manager
DISCONNECTING THE EVAL-ADAQ23875FMCZ
Always remove power from the SDP-H1 board or click the reset tact
switch located along the mini USB port before disconnecting the
EVAL-ADAQ23875FMCZ from the SDP-H1 board.
BOARD LAYOUT GUIDELINES
The printed circuit board (PCB) layout is critical for preserving
signal integrity and achieving the expected performance from the
ADAQ23875. A multilayer board with an internal, clean ground
plane in the first layer beneath the ADAQ23875 is recommended.
Care must be taken with the placement of individual components
and routing of various signals on the board. It is highly recommend-
ed to route input and output signals symmetrically. Solder the
ground pins of the ADAQ23875 directly to the ground plane of the
PCB using multiple vias. Remove the ground and power planes
under the analog input/output and digital input/output pins of the
ADAQ23875 (including F1 and F2) to avoid undesired parasitic
capacitance. Any undesired parasitic capacitance may impact the
distortion and linearity performance of the ADAQ23875.
The pinout of the ADAQ23875 eases layout and allows the analog
signals on the left side and the digital signals on the right side.
The sensitive analog and digital sections must be separated on the
PCB while keeping the power supply circuitry away from the analog
signal path. Fast switching signals, such as CNV± or CLK±, and the
DA± and DB± digital outputs must not run near or cross over analog
signal paths to prevent noise coupling to the ADAQ23875.
Good quality ceramic bypass capacitors of at least 2.2 µF (0402,
X5R) must be placed from the output of the LDOs generating
the μModule supply rails (VDD, VIO, VS+, and VS−) to GND to
minimize electromagnetic interference (EMI) susceptibility and to
reduce the effect of glitches on the power supply lines. All the other
required bypass capacitors are laid out within the ADAQ23875,
saving extra board space and cost. When the external decoupling
capacitors on the REFIN, VDD, and VIO pins near the µModule are
removed, there is no significant performance impact.

User Guide EVAL-ADAQ23875
TROUBLESHOOTING
analog.com Rev. A | 14 of 23
MECHANICAL STRESS
The mechanical stress of mounting a device to a board may cause
subtle changes to the SNR and internal voltage reference. The best
soldering method is to use IR reflow or convection soldering with a
controlled temperature profile. Hand soldering with a heat gun or a
soldering iron is not recommended.


/