Page is loading ...

Operating Instructions
1
Note: These instructions cover the specific operational characteristics
of POROS® 20 bulk media. The same media are also available in
prepacked columns. Contact your Applied Biosystems representative
for more details.
Your New POROS Media Is Unique!
Read this section before doing anything!
Applied Biosystems POROS 20 bulk media are made for Perfusion
Chromatography® flow-through, particle chromatography—a patented
new technology that performs bioseparations 10 to 100 times faster
than conventional HPLC or LC without loss in capacity or resolution.
Although columns packed with POROS 20 media can be operated on
standard HPLC and LC instrumentation, they are substantially different
from any columns you have used before. You may have to change the
way you run, and, to some extent, the way you think about
chromatography. In particular, the higher flow rates made possible by
Perfusion Chromatography allow you to perform experiments you
might once have considered a luxury, given the constraints of
conventional chromatography’s longer run times.
Please read the operating instructions carefully to ensure that you take
maximum advantage of the benefits that Perfusion Chromatography
technology provides.
Increase the Flow Rate
The largest single difference between POROS media and conventional
media is the flow rates under which high capacity and resolution are
achieved.
Although the media can be operated at flow rates typical of
conventional chromatography, you can realize the full benefits of
Perfusion Chromatography only by increasing the flow rate so that the
linear velocity is in the range of at least 2000 cm/hr.
Linear velocity (cm/hr) is calculated by dividing volumetric flow rate
(cm3/min) by the column cross-sectional area (cm2) and multiplying
by 60 min/hr.
The maximum flow rate is not limited by the media itself (high
resolution separations have been achieved at 10,000 cm/hr) but rather
is a function of the system used, the pressure limit on the column
selected, and how the column is packed. A typical linear flow rate for
POROS 20 media is 3,600 cm/hr.
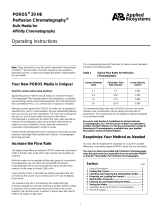
The corresponding volumetric flow rates for various column diameters
are listed in the following table.
Table 1 Typical Flow Rates for Perfusion
Chromatography
The dramatically higher flow rates of POROS columns and media
introduce new considerations into the design and execution of
experiments. This is particularly when you adapt a method developed
on conventional media.
Be sure to read Section 10, Guidelines for Using Perfusion
Chromatography, for a full discussion of these considerations.
Another excellent reference is The Busy Researcher’s Guide to
Biomolecule Chromatography, available from your Applied
Biosystems Technical Representative.
Reoptimize Your Method as Needed
You may need to reoptimize the separation to account for possible
differences in selectivity between POROS media and your old media.
The short run times associated with Perfusion Chromatography
make optimization quick and easy, especially if you are using the
VISION™ BioCAD® Workstation for Perfusion Chromatography.
Column Diameter
(mm) Volumetric Flow
Rate (ml/min) Linear Velocity
(cm/hr)
2.1 2.0 3,600
4.6 10.0 3,600
10 47.5 3,600
16 120.0 3,600
Contents Page
1 Product Description ..........................................................2
2 General Considerations ...................................................2
3 Reacting the Support ...................................................... 3
4 POROS AL Media.............................................................3
5 POROS EP Media.............................................................4
6 POROS OH Media............................................................5
7 Affinity Chromatography ...................................................5
8 Cleaning Up and Regenerating the Media .......................5
9 Storing the Media .............................................................5
10 Guidelines for Using Perfusion Chromatography ...........5
11 Technical Support ...........................................................7
POROS® 20 AL, EP and OH Perfusion
Chromatography Bulk Media for
Activated Affinity Chromatography

2
1 Product Description
POROS AL, EP and OH media are polymeric packings designed for
affinity chromatography of peptides, proteins, polynucleotides, and
other biomolecules with user-immobilized ligands in the Perfusion
Chromatography mode. The packings consist of cross-linked
poly(styrene-divinylbenzene) flow-through particles with a patented
bimodal pore-size distribution for rapid mass transport. This base
matrix is coated with a cross-linked polyhydroxylated polymer (POROS
OH), which is then activated with aldehyde (POROS AL) or epoxide
(POROS EP) functional groups.
POROS OH media is designed to be activated by the user, using any
of the conventional chemistries like glutaraldehyde, tresyl,
divinylsulfone, CNBr, and so on.
Table 2 Product Characteristics
Table 3 Chemical Resistance
2 General Considerations
General considerations regardless of chemistry are given below.
Guidelines (and in some cases, suggested protocols) for specific
surface chemistries are given in sections 5 to 8.
In activated affinity chromatography, coupling yield (ratio of molecule
offered to molecule immobilized), surface concentration (mass of the
immobilized molecule per unit support column bed volume), and
specific activity (biological activity per unit mass of immobilized
molecule), are determined by these variables:
•Binding buffer (pH)
•Concentration of molecule in binding solution
•Solubility of the molecule in binding solution
•Ratio of molecule mass to support mass or bed volume
•Concentration of support in binding solution
•Reaction time and temperature
•Reaction quenching
•Mode of reaction (batch or column)
Because molecules for immobilization differ substantially in reactivity
and in other properties, the optimal conditions for immobilization can
be determined only experimentally.
However, published papers and textbooks should be consulted, where
appropriate.
Surface Concentration Versus Yield and Activity
In general, maximum surface concentration of immobilized ligand is
achieved by high concentrations of both ligand and support and high
ratios of ligand to support during the coupling stage.
However, high surface concentration is often obtained at the expense
of low coupling yield and specific activity of the immobilized molecule.
Maximum utilization of rare or expensive molecules is usually achieved
at a lower ratio of molecule to support, and thus lower surface
concentration.
Use of Salting Out Conditions
In general, with macromolecules such as proteins, coupling under
salting out conditions can achieve both high coupling yield and high
surface concentration. To achieve this, add a saturated solution of
sodium sulfate or other anti-chaotropic salt to the coupling solution until
the solution just starts to become cloudy (just before the concentration
reaches the precipitation point). Avoid ammonium sulfate because
primary amines in the buffer interfere with all the reaction chemistries.
Although the support surface is quite hydrophilic, it is less hydrophilic
than the solution. When exposed in high salt concentration, the protein
partially precipitates on the support surface. This dramatically raises
the local concentration at the surface, driving the coupling reaction to a
much higher level.
Preparation of Concentrated Sodium Sulfate
At the high concentrations required in a salting out procedure (2 M, for
example), sodium sulfate can precipitate during preparation. To
prevent precipitation:
1. Dissolve the appropriate amount of solid sodium sulfate in hot
(80 °C) water in a volume close to the final buffer volume.
2. Allow the solution to slowly cool at room temperature.
3. When the temperature of the solution reaches approximately
30 °C, titrate to the final pH using as small a volume as possible so
that the buffer does not cool too rapidly.
4. Allow the buffer to cool to 25 to 30 °C.
5. Proceed with the immobilization.
Make sure all other buffers are at ambient temperature. If prepared
carefully, 2 M sodium sulfate is stable at room temperature.
Support Matrix Cross-linked poly(styrene-divinylbenzene)
Surface Functionality
POROS OH
POROS AL
POROS EP
POROS NH
POROS HY
Hydroxyl
Aldehyde
Epoxide
Primary amine
Hydrazide
Shrinkage/Swelling <1% from 1–100% solvent
Particle size 20 µm
Recommended
maximum flow rate 10,000 cm/hr
Maximum pressure
drop 170 bar (2,500 psi, 17 MPa)
Permeability <3 bar at 1,000 cm/hr (3 cm bed height)
pH Range
POROS AL, OH
POROS EP 1–14 (Up to 5.0 M NaOH, 1.0 M HCl)
3–9
Ionic Strength Range 0–5 M. All common salts.
Buffer Additives All common agents, including
8 M urea, 6 M guanidine
hydrochloride, ethylene glycol, and
detergents.
Solvents Water, 0–100% alcohols, acetonitrile,
other common organic solvents
Note: Do not expose to strong
oxidizers (such as hypochlorite),
oxidizing acids (such as nitric), or
strong reducing agents (such as
sulfite).
Operating Temperature 5–80 °C

3
3 Reacting the Support
It is desirable to react the support in a batch reaction before packing it
into a column. The concentrations of ligand and support can readily be
varied independently to give more flexible immobilization development.
Warning: POROS media is provided as a dry powder, which may form
a light dust. Use one of the following when handling dry POROS
media:
•NIOSH*/MSHA**-approved respirator with dust cartridge
•Fume hood
* National Institute for Occupational Safety and Health
** Mine Safety and Health Administration
Follow these guidelines to react the support:
•Form the binding solution by dissolving or exchanging the
ligand protein into the desired coupling buffer. For proteins, the
concentration should typically be in the range of 10 to 20 mg/
ml. Lower concentrations give higher coupling yield; higher
concentrations give higher surface concentration.
•Calculate the amount of dry powder needed to give the final
bed volume of your column: Use the ratio of dry powder to
packed bed volume listed on the product label. Example: If the
label indicates that 8.3 g of powder gives 25 ml of packed bed,
to pack a 10 ml column, weigh out 3.3 g of powder.
The packed bed volume specified on the label is based on a
packing pressure of 170 bar.
•Add the desired amount of dry support to the binding solution.
Keep in mind that a concentration of 0.15 g/ml or less is
typically used as a slurry concentration during the reaction
itself.
•Alternatively, the gel slurry can be prepared in advance in
sample buffer and washed extensively (at least 10 column
volumes) with the coupling buffer using a Buchner funnel. The
binding solution can then be added to the slurry in the desired
concentration.
•When reacting the support, it is necessary to gently agitate the
reaction tubes or vessels to prevent settling of the beads.
Shaking or tumbling are preferred techniques.
•Do not use a stir bar. It generates fines and may denature
proteins.
•After immobilization and any quenching reactions are
complete, wash the support extensively, first with coupling
buffer, then with a high salt (1 M NaCl) buffer to eliminate any
ligand that may be bound to the support through protein/protein
interactions.
•Wash the support with starting buffer, and pack the slurry into
the desired column.
3.1 Packing the Column
POROS 20 media are mechanically rigid and can therefore be packed
effectively both in low-pressure glass columns and in high-pressure
PEEK or stainless steel columns. The column bed supports (frits or
screens) should have a porosity of 10 µm or less.
Do not exceed 170 bar (2500 psi) pressure drop across the column
during or after packing.
3.2 Packing the Column
To ensure best results when you pack the column:
•Use a reservoir or adjustable column large enough to hold the
entire slurry, so that the bed may be packed all at once.
•Use flow-packing techniques. Gravity settling is time
consuming and usually results in poor performance.
Follow these steps:
1. Gently stir the slurry just before adding it to the column.
POROS beads have a density similar to water, so rapid settling is
not usually a problem.
2. Pour the slurry in gradually to minimize trapping air bubbles.
3. Tap the column gently to remove air bubbles.
4. Top off the column with the slurry solvent.
5. Connect the column to the packing pump.
6. Pack the column at a flow rate that yields a final pressure about
20 to 50% greater than the maximum anticipated operating
pressure.
7. After the bed is formed and the final pressure is reached, pump the
column with 10 to 20 bed-volumes of slurry solvent to stabilize the
bed.
4 POROS AL Media
Chemistry
The figure below shows the reaction chemistry of POROS AL media:
•Aldehyde groups on the surface of the support react selectively
with primary amines on the molecule, ultimately to form a
Schiff’s base.
•The Schiff’s base is subject to easy hydrolysis. Therefore, a
highly stable secondary amine linkage is formed by reacting
the Schiff’s base with a mild reducing agent.
Coupling Buffer
Do not use any buffer that contains primary amines (such as Tris).
•The optimum coupling pH is usually between 4 and 8.
•pH 6 to 7 usually produces good results.
•The use of salting out conditions is highly recommended (see
“Use of Salting Out Conditions” on page 2 for details).
Reaction Time and Temperature
The required reaction time depends on the ligand and the reaction
temperature.
Reaction times vary:
•At room temperature, allow at least 8 hours.
•At cold-room temperature, allow up to several days.
POROS AL Schiff’s Base
O
—CH2—CH + H2N——CH2—CH=N—+ H2O
—CH2–CH2–NH—
Reducing Agent

4
Generally, the longer the initial reaction time, the higher the surface
concentration and coupling yield.
When in doubt, perform an overnight reaction at room temperature for
good results, especially with proteins.
Note: Do not use cold-room temperature if salting out conditions have
been used. Salt crystals that form may damage POROS media.
Reduction Step
After the initial reaction and Schiff’s base formation, you must react the
support with a reducing agent to form a stable bond.
Consider the following when selecting a reducing agent:
•Sodium cyanoborohydride (NaCNBH3) is the most widely used
reducing agent. It is mild enough to prevent reduction of
disulfide bonds on proteins, but it is toxic and may present
disposal problems when used on a large scale.
•Sodium borohydride (NaBH4) should not be used in prepacked
columns. Although it reduces aldehyde groups, eliminating the
need for a quenching reaction, it may produce gas bubbles.
To reduce the support chemically:
1. Make up your reducing agent as a concentrated solution. A
suggested concentration is 5 mg of reducing agent per ml of
column-bed volume.
2. Start the reduction reaction according to the reducing agent you
are using. If you use:
•Cyanoborohydride: Begin the reduction reaction
simultaneously with the coupling reaction by mixing the protein
solution, coupling solution, and cyanoborohydride
•Other reducing agents: Add the reducing agent after the
coupling reaction is complete.
3. Allow the reduction reaction to proceed for approximately 2 hours
at room temperature or 8 hours in the cold room.
4. After the reduction reaction is complete, wash the support with
coupling buffer.
Quenching
Residual aldehyde functionality is likely to remain after the coupling
reaction. To quench these aldehydes:
1. React the support with a low-molecular-weight primary amine,
such as:
•0.2 M Tris buffer
•1 M ethanolamine in phosphate buffer
2. Include reducing agent in the quenching reaction mixture.
Quenching reactions are generally complete after 2 hours at any
temperature.
5 POROS EP Media
Chemistry
The figure below shows the reaction chemistry of POROS EP media.
Note that:
•The oxirane (epoxide) rings on the support react with primary
amines to form secondary amine linkages.
•Hydroxyls require high pH (for example, pH 10–12), resulting in
an α-hydroxy ether linkage. However, hydroxyls are less
reactive than amines.
•Epoxides also react with sulfhydryl groups. The pH of the
coupling buffer can be adjusted (for example, pH 6–8) to make
the sulfhydryl reaction selective in the presence of amines.
•At the elevated pH used for coupling amines and hydroxyls,
there is a slow competing hydrolysis of the epoxide groups to
form diols.
Coupling Buffer
Follow these guidelines when you select a coupling buffer:
•Do not use any buffer that contains primary amines (such as
Tris). Recommended buffers are carbonate, borate, and
phosphate.
•The optimum pH for coupling is usually in the range 9–11 for
amines and 6–8 for sulfhydryls.
•The use of salting out conditions is highly recommended (see
“Use of Salting Out Conditions” on page 2 for details).
•Organic solvents can be used if you add an appropriate organic
soluble base.
•Because of the hydrolysis reaction, POROS EP media has a
limited shelf life after the coupling buffer is added.
•If the packing is to be stored in coupling buffer for any
significant length of time, keep the packing cold, but DO NOT
FREEZE IT.
Reaction Time and Temperature
The required reaction time depends on the:
•Molecule being coupled
•pH
•Reaction temperature
The reaction is faster at higher pH and temperature and with small
molecule ligands. However, the competing hydrolysis reaction is also
faster. Reaction times vary:
•At room temperature with proteins, the reaction can take place
overnight.
•At cold-room temperature, several days are generally required.
Generally, the longer the initial reaction time, the higher the surface
concentration and coupling yield.
Note: Do not use cold-room temperature if salting out conditions have
been used. Salt crystals that form may damage POROS media.
POROS EP
O
—CH2–CH–CH2 + H2N——CH2–CH2–CH2–NH—
OH

5
Quenching
Some residual epoxide functionality is likely to remain after the
coupling reaction.
To quench these epoxides, use any of the following low-molecular-
weight reactants:
•0.2 M Tris buffer
•1 M ethanolamine in phosphate buffer
•0.1 M mercaptoethanol in phosphate buffer
Quenching reactions are generally complete after 2 hours at any
temperature.
6 POROS OH Media
POROS OH media offers a surface that is chemically similar to base
cellulose or agarose supports, containing a high concentration of
hydroxyl functionality. Activate POROS OH media with any of the
coupling chemistries used for agarose or cellulose matrixes, including:
•Cyanogen bromide
•Tresyl
•Glutaraldehyde
•Divinylsulfone
•Carbonyldiimidazole
•Periodate
•Triazine
•Diazonium
Consult standard textbooks for specific chemistries and protocols.
7 Affinity Chromatography
•The binding and elution buffers used for affinity
chromatography depend entirely on the nature of the ligand
interaction.
•Although the POROS support itself and the coupling linkage
are highly stable chemically, do not expose the column to
conditions that cause denaturation of the immobilized molecule
itself.
•Because Perfusion Chromatography media have such a high
rate of mass transport, the volumes required for complete
washing and elution of the column are generally quite low
(<5 column volumes).
8 Cleaning Up and Regenerating the
Media
POROS activated affinity media are stable to most agents typically
used in a regeneration procedure. Refer to Table 3 for details.
The regeneration protocol to use depends on the stability of the ligand
chosen and the nature of the sample containing the target molecule.
Multiple Injections
It is possible to use multiple injections of regeneration solutions instead
of pumping them directly. This method is recommended for very
aggressive or very viscous solvents. To clean by injections:
•Make the injection volume as large as possible.
•Use a low flow rate that allows at least several minutes’
exposure of the column to the regeneration solution.
Note: Backpressure increase is sometimes caused by a plugged inlet
frit. If backflushing the column does not solve the problem, replace the
inlet frit.
9 Storing the Media
Store the dry powder at room temperature, except for POROS EP,
which must be stored at 4 to 10 °C.
To store a packed column:
•Store the column between 5 and 30 °C.
•Store the column with the ends carefully sealed to prevent
drying. Drying results in decreased chromatographic efficiency.
Short-Term Storage
Store the column in any appropriate buffer.
Long-Term Storage
Add 0.02% sodium azide or 30% methanol to the column.
Warning: Sodium azide is toxic. Follow precautions and
decontamination procedures recommended by the National Institute
for Occupational Safety and Health.
10 Guidelines for Using Perfusion
Chromatography
When you make the transition to Perfusion Chromatography, consider
factors related to:
The chromatography system
•Account for System Pressure
•Check the Gradient System
•Adjust the Data Collection System
•Maintain Your Column and System
Experimental design
•Think in Terms of Column Volumes
•Adjust the Sample Load
•Measure Recovery Properly
10.1 Account for System Pressure
The high flow rates used with Perfusion Chromatography cause a
higher-than-usual system pressure (resulting from the chromatography
hardware itself). In some cases, this system pressure can be equal to
or even greater than the column pressure.

6
Therefore, when you use your POROS column, you cannot simply set
the upper pressure limit of the system at the pressure rating of the
column. Instead:
1. Determine the system pressure by:
a. Connecting a union in place of the column
b. Pumping the highest salt concentration to be used at the
planned flow rate
2. Set the upper pressure limit by adding the system pressure
observed above to the column pressure rating.
If the system pressure is too high:
1. Check carefully for plugged or crimped tubing or other restrictions
in your plumbing.
2. Use larger-ID or shorter tubing.
3. Use a larger detector flow cell.
In some systems, excessive system pressure can prevent the
high flow rates required to take full advantage of Perfusion
Chromatography technology.
It is important to isolate the relative contribution of column and
instrument when pressures approach the maximum column pressure.
Take the column out of line to determine those contributions (measured
pressure = column pressure drop + system pressure).
10.2 Check the Gradient System
High flow rates and short run times can expose both operational and
design problems in gradient blending systems. Gradient system
problems can affect step changes as well as linear gradients. Most
problems come from one of two sources:
•Excessive delay (dwell) or mixing volume can cause both delay
in the start of the gradient at the column and rounding or
distortion of the edges of the gradient. Mixing or delay volume
can be reduced by using a smaller mixer and shortening the
tubing between the mixer and sample injector.
•Poor gradient proportioning can cause either short-term
fluctuations or long-term inaccuracies. Adding a mixer can
sometimes help.
On the VISION or BioCAD Workstation, gradient performance is
tracked on each run with the internal conductivity detector. If there is
any question about gradient performance on other systems, the
gradient can be visualized as follows:
1. Connect a union in place of the column.
2. Form a gradient with water as the A solvent and
0.5% acetone in water as the B solvent with detection at 280 nm.
The UV absorbance is directly proportional to the concentration of
B solvent and can be compared to the programmed gradient.
Consult your system vendor for serious gradient problems.
10.3 Adjust the Data Collection System
Because Perfusion Chromatography runs are much shorter than
conventional chromatography runs, you may need to adjust your data
collection system as follows:
•To obtain high-definition chromatograms, use a shorter total
run time and higher data collection rate (or lower average peak
width parameter). A typical data collection rate is
10 points/second.
•If you use a chart recorder, increase the chart speed in
proportion to the flow rate increase.
10.4 Maintain Your Column and System
Perfusion Chromatography enables you to perform runs more quickly
than other chromatography techniques. For this reason, perform
maintenance tasks such as replacing filters or regenerating columns
after a certain number of runs, rather than after a specified period of
time. You can reduce the frequency of such maintenance by always
filtering the sample and eluent.
10.5 Think in Terms of Column Volumes
In any chromatographic separation, as flow rate increases, gradient
time must decrease to maintain constant gradient volume. At the flow
rates used for Perfusion Chromatography, the gradient times are
dramatically shorter than what you are accustomed to working with. To
convert a method to Perfusion Chromatography, keep the gradient
volume constant in terms of column volumes and adjust the time of the
gradient according to the new flow rate.
When you work routinely with Perfusion Chromatography, always think
of gradients in terms of column volumes, because a slight change in
gradient time may result in a dramatic difference in gradient volume
and column performance.
For example, on a conventional 4.6 × 250 mm analytical column
(volume 4.25 ml), a 45-minute run at 1 ml/min represents a
10.6 column volume gradient.
On a POROS 4.6mmD/100mmL column (volume 1.7 ml), a 5 ml/min
flow rate translates into 3 column volumes/min (5/1.7). Therefore, a
10.6 column volume gradient would be completed in 3.5 minutes.
The VISION and BioCAD Workstations allow you to program by
column volumes.
10.6 Adjust the Sample Load
If the volume of your POROS column is different from the column you
are currently using, adjust the sample volume or mass proportionally to
keep the same load per unit volume of column.
10.7 Measure Recovery Properly
Quantitation (recovery) measurements using peak integration are
comparable run to run only if the conditions are kept nearly constant.
Flow rate affects the value of the integrated peak area for a given mass
recovered, because the amount of material recovered in a peak is
equal to the concentration (absorbance) times the volume. However,
an integrator (or integration software) quantitates peaks by summing
absorbance measurements over time. A change in flow rate is a
change in the amount of volume over time.
Therefore, time integration does not allow comparison of
recovery at different flow rates. Direct comparison of your POROS
results with previous results on conventional chromatography
may lead to the incorrect conclusion that recovery is less on
POROS columns.
There are several ways to compensate for limitations in time-based
integration:
•Multiply the peak area by the flow rate. Unfortunately, because
integrators often vary the data rate with expected peak width,
this approach can give invalid results.
•Using peak height can give a general comparison, but
bandspreading differences due to different efficiencies or
gradient slopes will cause errors.

7
•Recovery may be compared accurately using peak integration
at the same flow rate, but doing this may not show important
effects such as a recovery increase due to shorter time on the
column with Perfusion Chromatography.
•Collect the peaks carefully and analyze using
spectrophotometry or other methods. Make sure to develop
blanks, especially when UV-absorbing components are present
in the eluent.
•If peak collection is not feasible, generate standard curves by
injecting increasing amounts of calibration standards of known
concentration. If the measured peak area increases linearly
with load, and the standard curve passes through the origin, it
is very likely that recovery is high.
11 Technical Support
Applied Biosystems is dedicated to helping you use Perfusion
Chromatography and POROS media to the fullest extent possible. Our
biochromatographers, bioprocess engineers, and applications
development laboratories are available for support ranging from
telephone consultation to full-scale method development.
Applied Biosystems also offers a full line of other POROS media for
Perfusion Chromatography in the reversed-phase, ion-exchange,
affinity, and other chromatographic modes. Please contact your
Applied Biosystems representative for technical and ordering
information.
Applied Biosystems publishes a continuing series of Application and
Technical Notes, highlighting specific purification problems and
technical aspects of Perfusion Chromatography. Contact Applied
Biosystems directly for a publication list.
For further details or for answers to questions on POROS 20 AL, EP
and OH media, Perfusion Chromatography, or other products, contact
Applied Biosystems. Refer to the back page of this document for
contact information.

Headquarters
850 Lincoln Centre Drive
Foster City, CA 94404 USA
Phone: +1 650.638.5800
Toll Free (In North America): +1 800.345.5224
Fax: +1 650.638.5884
Worldwide Sales and Support
Applied Biosystems vast distribution and
service network, composed of highly trained
support and applications personnel, reaches
into 150 countries on six continents. For sales
office locations and technical support, please
call our local office or refer to our web site at
www.appliedbiosystems.com.
Technical Support
In North America, for all POROS products,
call: +1 800.899.5858
www.appliedbiosystems.com
Applera Corporation is committed to providing
the world’s leading technology and information
for life scientists. Applera Corporation consists of
the Applied Biosystems and Celera Genomics
businesses.
Printed in the USA, 05/2002
Part Number 8-0031-40-0993 Rev. B
© Copyright 1996, 2001, 2002, Applied Biosystems. All rights
reserved.
For Research Use Only. Not for use in diagnostic procedures.
Information in this document is subject to change without notice.
Applied Biosystems assumes no responsibility for any errors that
may appear in this document. This document is believed to be
complete and accurate at the time of publication. In no event shall
Applied Biosystems be liable for incidental, special, multiple, or
consequential damages in connection with or arising from the use of
this document.
POROS products and perfusive chromatography are covered by U.S.
patents 5,030,352; 5,552,041; 5,605,623; and 5,833,861; foreign
patents pending. Chromatography materials of certain pore
geometries, including certain wide-pore supports, can permit
perfusive chromatography, that is, separations in which the rate of
intraparticle convection exceeds the rate of intraparticle diffusion.
Use of any such chromatography media at sufficiently high linear
velocity, without license, may constitute patent infringement. A limited
license to use the patented perfusive chromatography process is
granted with the purchase of POROS products from Applied
Biosystems. The license terminates upon expiration of the useful life
of the product.
Subtractive Assay technology, enabled by the use of
ImmunoDetection (ID) Sensor Cartridges and the INTEGRAL
Micro-Analytical Workstation, is covered by U.S. patent 5,234,586.
Other patents pending.
Applied Biosystems, BioCAD, ImmunoDetection, INTEGRAL,
Perfusion Chromatography, and POROS are registered trademarks
of Applera Corporation or its subsidiaries in the U.S. and certain
other countries.
AB (Design), Applera, and VISION are trademarks of
Applera Corporation or its subsidiaries in the U.S. and certain other
countries.
All other trademarks are the sole property of their respective owners.
/
