Page is loading ...

RAPID & RELIABLE PURIFICATION OF
EXTRACELLULAR VESICLES
SPECIFICATIONS AND OPERATIONAL
GUIDE FOR SMART COLUMNS
qEV10
USER MANUAL
www.izon.com

Izon Science Ltd. provides this document to its customers with a
product purchase to use in the product operation. This document
is copyright protected and any reproduction of the whole or any
part of this document is strictly prohibited, except with the written
authorisation of Izon Science Ltd.
The contents of this document are subject to change without notice. All
technical information in this document is for reference purposes only.
System configurations and specifications in this document supersede
all previous information received by the purchaser.
Izon Science Ltd. makes no representations that this document is
complete, accurate or error-free and assumes no responsibility and
will not be liable for any errors, omissions, damage or loss that might
result from any use of this document, even if the information in the
document is followed properly.
This document is not part of any sales contract between Izon Science
Ltd. and a purchaser. This document shall in no way govern or modify
any Terms and Conditions of Sale, which Terms and Conditions of Sale
shall govern all conflicting information between the two documents.
Izon products are designed and manufactured under a quality system
certified to ISO 13485:2016.
All third-party trademarks are the property of their respective owners.
Izon Science Ltd
PO Box 9292
Addington
Christchurch 8024
New Zealand
Telephone: +64 3 357 4270
Email: [email protected]
Website: www.izon.com
2www.izon.com

1 Definitions and Writing Conventions .......................................................4
2 Safety and Hazards ..................................................................................... 6
2.1 Hazards ............................................................................................................ 6
2.2 Storage ............................................................................................................ 8
2.3 Disposal ........................................................................................................... 8
3 Introduction to Size Exclusion Chromatography ................................. 9
3.1 Overview .......................................................................................................... 9
3.2 Intended Use: .................................................................................................11
3.3 Comparison of qEV/35nm and qEV/70nm series: .............................11
3.4 qEV10 Specifications ..................................................................................13
3.5 qEV10 Performance Characteristics .....................................................14
3.6 qEV10 EV Elution Profile ............................................................................16
3.7 qEV10 Sample Input Volume Effects ..................................................... 17
3.7.1 Effect of Sample Input Volume on EV Elution Profile ....................... 17
3.7.2 Effect of Sample Input Volume on Protein Elution Profile ...............18
3.7.3 Effect of Sample Input Volume on EV Dilution
and Recovery Rate ......................................................................................18
4 Manual Operating Instructions ................................................................19
4.1 Operational Recommendations ..............................................................19
4.2 Column Setup and Equilibration: ............................................................21
4.3 Sample Loading: .........................................................................................23
4.4 Column Flush and Storage ....................................................................... 23
4.5 Restoring Column Flow After a Blockage due
to Airlock in the Junction .......................................................................... 24
5 Resources ...................................................................................................... 25
5.1 Protocols for EV Isolation from Common Sources ............................ 25
5.2 EV Analysis Using TRPS ............................................................................25
TABLE OF CONTENTS
3
www.izon.com

Make sure to follow the precautionary statements
presented in this guide. Safety and other special
notices will appear in boxes and include the symbols
detailed in Table 1.
Table 1: Safety and Hazard Symbols
DEFINITIONS AND WRITING CONVENTIONS
1 /
This symbol indicates general advice on how to improve
procedures or recommends measures to take in specific
situations.
This symbol indicates where special care should be taken.
4www.izon.com

Table 2: Terminology Used in this Manual
TERM DEFINITION
Buffer volume
(Previously void
volume)
The volume of liquid that corresponds to the volume before
the Purified Collection Volume (PCV); this volume is collected
automatically into the central well. The buffer volume is different
for each column type.
Chromatography A method used primarily for separation of the components of a
sample. The components are distributed between two phases;
one is stationary while the other one is mobile. The stationary
phase is either a solid, a solid-supported liquid, or a gel. The
stationary phase may be packed in a column, spread as a layer
or distributed as a film. The mobile phase may be gaseous or
liquid.
Column volume The combined volume of packed material and buffer volume
(can be referred to as the bed volume).
Degassing Degassing involves subjecting a solution to vacuum to “boil” off
excess dissolved gas e.g. applying a vacuum to a flask.
Flow rate The volumetric flow in mL/min of the carrier liquid.
Purified Collection
Volume (PCV)
The volume immediately succeeding the buffer volume,
containing particles of interest purified from the loaded sample.
The PCV is different for each column type.
This symbol indicates general advice on how to improve
procedures or recommends measures to take in specific
situations.
This symbol indicates where special care should be taken.
5
www.izon.com

SAFETY AND HAZARDS
Refer to the Safety Data Sheet for the classification and labelling of
hazards and associated hazard and precautionary statements. The The
Safety Data Sheet for qEV Isolation columns is located at www.izon.
com/resources
2.1 Hazards
qEV SMART columns are a laboratory product. However, if
biohazardous samples are present, adhere to current Good Laboratory
Practices (cGLP) and comply with any local guidelines specific to your
laboratory and location.
Disposal of Biohazardous Material
The qEV SMART column contains < 0.1% sodium azide, which is
potentially fatal if swallowed or in contact with skin. Please review
the following guidelines and precautions prior to each use of the qEV
SMART column:
Prevention:
1. Do not get into eyes, on skin, or on clothing.
2. Wash skin thoroughly after handling.
3. Do not eat, drink, or smoke when using this product.
4. Avoid release of product into the environment.
5. Wear protective gloves and clothing; follow general
laboratory precautions.
2 /
6www.izon.com

Response
1. IF SWALLOWED: immediately call a POISON CONTROL CENTRE/
Doctor.
2. IF ON SKIN: Gently wash with plenty of soap and water and
immediately call a POISON CONTROL CENTRE/Doctor.
3. Remove immediately any contaminated clothing and wash
before reuse.
4. Collect any spillage and dispose of appropriately.
For more information, see the MSDS Documentation for Izon qEV
SMART columns: www.izon.com/resources
Sodium azide can be fatal if swallowed or in contact with skin. It can
cause damage to neurological organs through prolonged or repeated
exposure. It is very toxic to aquatic life with long-lasting effects.
Be sure to adhere to the following guidelines and comply with any
local guidelines specific to your laboratory and location regarding
use and disposal.
General Precautions:
— Always wear laboratory gloves, coats, and safety glasses with side
shields or goggles.
— Keep your hands away from your mouth, nose, and eyes.
— Completely protect any cut or abrasion before working with
potentially infectious or hazardous material.
— Wash your hands thoroughly with soap and water after working
with any potentially infectious or hazardous material before
leaving the laboratory.
— Remove watches and jewellery before working at the bench.
— The use of contact lenses is not recommended due to complications
that may arise during emergency eye-wash procedures.
7
www.izon.com

— Before leaving the laboratory, remove protective clothing.
— Do not use a gloved hand to write, answer the telephone, turn on a
light switch, or physically engage with people without gloves.
— Change gloves frequently.
— Remove gloves immediately when they are visibly contaminated.
— Do not expose materials that cannot be properly decontaminated
to potentially infectious or hazardous material.
— Upon completion of the tasks involving potentially infectious
or hazardous materials, decontaminate the work area with an
appropriate disinfectant or cleaning solution (1:10 dilution of
household bleach is recommended).
Dispose of the following potentially contaminated materials in
accordance with laboratory local, regional, and national regulations:
— Biological samples
— Reagents
— Used reaction vessels or other consumables that may be
contaminated
2.2 Storage
Rapid changes in temperature should be avoided, as this can introduce
bubbles into the gel bed.
Unused qEV columns can be stored at room temperature. Used qEV
columns can be stored at room temperature providing they have been
cleaned according to the instructions in this document and stored in
20% ethanol or 0.05% w/v sodium azide. If the appropriate solutions
are not available for storage at room temperature, then columns can
be stored at +4 to +8 °C after use.
2.3 Disposal
Waste buffer should be disposed of in a safe manner. Sodium azide
accumulation over time in copper pipes can result in an explosion.
8www.izon.com

INTRODUCTION TO SIZE EXCLUSION
CHROMATOGRAPHY
3 /
3.1 Overview
qEV Size Exclusion Chromatography (SEC) columns separate particles
based on their size as they pass through a column packed with a
porous, polysaccharide resin. As the sample passes through the column
under gravity, smaller particles enter the resin pores on their way down
and their exit from the column is delayed (Figure 1C). As the sample
exits the column, sequential volumes are collected. Particles will be
distributed across the volumes based on their size, with the largest
particles exiting the column first and the smallest particles exiting the
column last.
The packed column is equilibrated with a buffer, which fills the column.
The total column volume is occupied by both the solid resin (stationary
phase) and the liquid buffer (the mobile phase). As the particles do not
bind to the resin, the buffer composition will not significantly affect the
resolution (the degree of separation between peaks).
9
www.izon.com

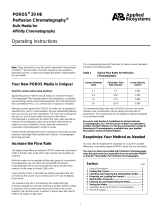
Figure 1: Process of SEC (A) Schematic picture of a resin bead with an electron microscopic enlargement.
(B) Schematic drawing of sample molecules diffusing into the pores of the resin beads. (C) Graphical
description of separation: (i) sample is applied to the column; (ii) the smallest particles (yellow) are more
delayed than the largest particles (red); (iii) the largest particles are eluted first from the column. Band
broadening causes significant dilution of the particle zones during chromatography. (D) Schematic
chromatogram. From: GE Healthcare and Biosciences. (n.d.). Size Exclusion Chromatography Principles and
Methods [Brochure]. Uppsala, Sweden. Accessed June 2019.
A
D
B C
iii iii
Equilibration
Sample is loaded
Large
particle
size
Small
particle
size
Intermediate
particle
size
Vo
Ve
Vt
Column volumes (CV)1CV
Absorbance
D
10 www.izon.com

3.2 Intended Use
Izon qEV columns isolate extracellular vesicles from biological samples.
qEV10 columns are equipped with RFID chips for use with the Izon
Automatic Fraction Collector (AFC). These chips will not impact
manual use. The column is intended to be used in research laboratories by
professional personnel for research use only. The qEV column is not intended
for diagnostic purposes and should not be used to make treatment decisions.
qEV columns are designed to isolate and purify vesicles from most
biological samples, including:
— Serum
— Plasma
— Saliva
— Urine
— Cerebrospinal Fluid (CSF)
— Cell culture media
NOTE: most ‘raw’ samples cannot be directly run on qEV columns and
analysed with TRPS without some preparation such as centrifugation
and concentration steps. Contact the Izon Support Centre for
recommendations and protocols.
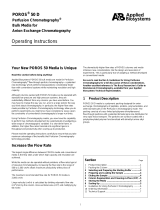
3.3 Comparison of qEV/35nm and qEV/70nm series
All qEV columns are available in one of two isolation ranges, the
qEV/35nm series and the qEV/70nm series. The qEV/35nm series of
columns generally perform better when the target particle to be isolated
is less than 110 nm in diameter, while the qEV/70nm series of columns
generally perform better when the target particle to be isolated is greater
than 110 nm in diameter (see Table 3). For optimal recovery of particles
between 35 and 350 nm a qEV/35nm series column is recommended. For
optimal recovery of particles between 70 and 1000 nm a qEV/70nm series
column is recommended.
11
www.izon.com

800
0
0.5
1.5
1
2
2.5
3
200 57350
Particle size (nm)
Recovery compared to qEV/70 column
70110 40
qEV/35nm SERIES qEV/70nm SERIES
Target Particle Size (nm) 35 nm to 350 nm 70 nm to 1000 nm
Optimum Recovery Range (nm) Particles < 110 nm Particles > 110 nm
Table 3: Specifications of qEV/35nm and qEV/70nm Series
Figure 2. Particle recovery by
size for qEV/35 series column
compared to qEV/70 series
column (pink line).
12 www.izon.com

qEV/35nm SERIES qEV/70nm SERIES
Target Particle Size (nm) 35 nm to 350 nm 70 nm to 1000 nm
Optimum Recovery Range (nm) Particles < 110 nm Particles > 110 nm
3.4 qEV10 Specifications
Table 4: qEV10 Specifications
Column name qEV10
Column series qEV10/35nm qEV10/70nm
Optimal separation size 35 - 350 nm 70 - 1000 nm
Run Time ~40 minutes
Column volume 69.3 mL
Sample load volume 10 mL*
Optimal fraction size 5 mL
Buffer volume** 21.4 mL
Flush volume 140 mL
Purified collection volume** 20 mL
EV peak after buffer volume** 10 ± 5 mL
Operational temperature 18 to 24 ºC
Buffer PBS
Largest size passable 1 µm
Top and bottom frit size 20 µm
pH stability working range 3 – 13
pH stability cleaning-in-place (CIP) 2 – 14
Shelf life (if stored correctly) 12 months
* Loading higher sample volumes results in a lower level of purity in the later vesicle volumes, greater overlap
between protein and EV elution peaks, and a higher protein peak within the PCV. Loading lower sample volumes
results in a higher dilution factor of the sample. The optimal recommended sample volume for purity on the qEV10
is 10 mL.
**Values for human plasma samples only.
13
www.izon.com

3.5 qEV10 Performance Characteristics
As shown in Figure 3 and 4 below, particles less than 70 nm typically elute
later than the PCV on the qEV/70nm, whereas particles larger than 35 nm
are captured in this zone on the qEV/35nm column. A higher recovery in the
PCV of particles larger than 70 nm occurs on the qEV/70nm series columns
compared with the qEV/35nm series (Fig. 4). Proteins typically elute slightly
earlier on the qEV/35nm series. Higher protein levels in the PCV are mainly
due to an increase in EV bound proteins.
Figure 3: Comparison of plasma protein elution and recovery levels of 69 nm
liposomes between a qEV10/35nm and a qEV10/70nm.
Volume (mL)
0.9
0.7
0.3
0.4
0.8
0.6
0.5
0.2
0.1
0
0.7
0.8
0.5
0.1
0.2
0.3
0.6
0.4
0
Absorbance (497 nm)
Plasma protein (Abs 280 nm)
Buffer
Volume
PCV
545 5025 30 35 40201510
qEV/70 liposomes
qEV/70 protein
qEV/35 liposomes
qEV/35 protein
Different samples may give slightly different elution profiles and
purity, hence an initial measurement of EV concentration and protein
contaminants in collected fractions is recommended.
14 www.izon.com

Figure 4: Comparison of plasma protein elution and recovery levels of 200 nm
particles between a qEV10/35nm and a qEV10/70nm.
Volume (mL)
0.9
0.7
0.3
0.4
0.8
0.6
0.5
0.2
0.1
0
0.7
0.8
0.5
0.1
0.2
0.3
0.6
0.4
0
Absorbance (600 nm)
Plasma protein (Abs 280 nm)
Buffer
Volume
PCV
545 5025 30 35 40201510
qEV/70 particles
qEV/70 protein
qEV/35 particles
qEV/35 protein
15
www.izon.com

3.6 qEV10 EV Elution Profile
The elution of vesicles typically peaks at 10 mL ± 5 mL after the buffer
volume, for a 10 mL sample volume and collecting 5 mL fractions.
Figure 5 shows the elution of vesicles when 10 mL of plasma sample is
loaded onto a qEV10/35nm column.
The majority of EVs typically elute in 20 mL after the buffer volume. If
higher purity is desired, collect only the first 15 mL. The user therefore
chooses between maximising recovery by collecting a bigger volume or
maximising purity by collecting a lesser volume.
The elution of plasma protein is slower, eluting predominantly from
25 – 70 mL after the buffer volume. Any vesicles recovered beyond 20
mL contain higher protein contamination and may be less suitable for
downstream analysis because of their lower purity.
Indicative protein elution profiles can be obtained by monitoring the
absorbance at a wavelength of 280 nm. An accurate measurement of
the level of protein can be obtained using a colorimetric protein assay.
Figure 5: Typical elution profile for a qEV10/35nm column with 10 mL of plasma loaded;
proteins elute later than extracellular vesicles (EVs) and similarly sized particles >60
nm. The vesicle concentration was measured using TRPS and relative protein levels by
absorbance at 280 nm.
Volume (mL)
0.8
1
0.6
0.4
0.2
0
10
8
6
5
4
1
2
3
9
7
0
Concentration (Particles/mL x 109)
Plasma protein (Abs 280nm dil. 1:20)
Buffer
Volume
PCV
510 15 20 6545 50 55 6040353025
16 www.izon.com

3.7 qEV10 Sample Input Volume Effects and
Recovery Rates
3.7.1 Effect of Sample Input Volume on EV Elution Profile
Loading higher sample volumes results in a lower level of purity in the
later vesicle volumes, greater overlap between protein and EV elution
peaks, and a higher protein peak within the PCV. Figure 6 shows the
effect of loading 5 mL and 10 mL of plasma. Note the delay in elution of
EVs in the 10 mL sample.
The optimal recommended sample volume for purity on the qEV10 is
10 mL, which consistently results in vesicles eluting in the 20 mL PCV.
Loss of vesicles occurs with sample volumes over 10 mL as the vesicle
elution is broadened. EVs collected outside of the 20 mL PCV are not
recommended for downstream analysis where high purity is required.
5 mL EV elution
5 mL protein elution
10 mL EV elution
10 mL protein elution
Figure 6: The effect of loading larger volumes is shown in the
extracellular vesicles (EVs) and similarly sized particles >60 nm
profiles from loading 5 mL and 10 mL of plasma.
Volume (mL)
8
5
6
7
3
4
2
1
0
Concentration (Particles/mL x 1010)
4051510 20 25 3530
Buffer
Volume
PCV
40
30
10
15
35
25
20
5
0
Protein concentration (Abs 280 nm)
17
www.izon.com

3.7.2 Effect of Resin Type on Protein Elution Profile
The PCV on a qEV10 contains very little protein, with protein levels
increasing in later volumes, as shown in Figure 7. Higher protein levels
for the qEV10/35nm are due in part to higher recovery of smaller EVs in
the PCV (refer to Fig. 2).
Figure 7: Percentages of protein cf. starting quantity of protein from loading 10 mL of plasma onto
a qEV10. Pink bars are the PCV. qEV10/70nm bars are dark pink and dark blue. qEV10/35nm bars
are light pink and light blue.
Volume (mL)
4
2
3
1
0
% Protein c.f. total
2515510 3020
18 www.izon.com

MANUAL OPERATING INSTRUCTIONS4 /
The following section provides instructions for the
manual use of qEV columns. For use of qEV columns
with the Automatic Fraction Collector (AFC)
instrument, please see the full AFC User Manual at:
support.izon.com
4.1 Operational Recommendations
The following recommendations are provided to ensure optimal
performance of the qEV column:
— Centrifuge samples prior to loading onto the column. To avoid
clogging of column frits, it is recommended to filter or centrifuge
the biological sample to remove large particulate matter.
— Centrifuge samples at 1,500 x g for 10 minutes to remove any
cells and large particles.
— Gently move the supernatant to a new tube and centrifuge
again at 10,000 x g for 10 min.
— For microvesicle isolation, use lower g-forces for the second
centrifugation step.
— Samples can be concentrated before application to the column or
after isolation if needed. It is possible to concentrate samples both
before and/or after use of the qEV column, however Izon offers
multiple column sizes to reduce the need for pre-analytical sample
concentration. If concentration protocols are needed, please
consider the following recommendations:
19
www.izon.com

— Concentration of some sample types may result in the
formation of precipitates and protein aggregates, especially
for urine samples. Concentrated samples should be
centrifuged at 10,000 x g for 10 minutes prior to loading onto
a qEV column.
— Izon recommends using Merck Millipore concentration devices
(Amicon® Ultra Centrifugal filters; C7715). Use according to
manufacturer’s recommendations.
— Concentration of samples after purification with qEV may
result in the loss of some EVs on the membrane.
— Single-use columns are advisable where the vesicles will be
analysed for nucleic acids. Use of a single-use column, such as the
Izon qEVsingle, will reduce the possibility of cross-contamination.
— Ensure that the sample buffer has been prepared appropriately.
To maintain the functionality of EVs, the flushing buffer should be of
the same temperature as the sample buffer. SEC can also be used
to exchange the buffer of a sample.
— Sample buffer temperature should be within the operational
temperature of 18-24 ˚C (65-75 ˚F).
— Sample buffers should be degassed and room temperature
to avoid air bubbles forming in the gel bed. Rapid changes in
temperature, for example removing packed columns from a cold
room and applying buffer at room temperature, can introduce
air bubbles in the packed bed, resulting in poorer separation.
— Use a buffer with an ionic strength of 0.15 M or greater to
avoid any unwanted ionic interactions between the solute
molecule and the matrix.
— Only use freshly filtered (0.22 µm) buffer to avoid introducing
particulate contamination.
— qEV columns come equilibrated in filtered PBS containing
<0.1% w/v sodium azide.
20 www.izon.com
/