Page is loading ...

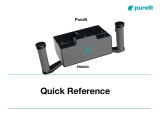
Pundit
Quick Reference
PD8050

PD8050 System

Digital
TGC -
AI positioning
camera
Dry point contact
Transducer elements
Instrument Overview
Stop
Digital
TGC + Linear
Gain -
Start/Snapshot
Linear
Gain +
Laser pointer

USB-C
Instrument Overview
WiFi
module
Power ON/OFF
Tablet holder

8 channel
Modularity
16 channel
Single handle

79330235
Accessories
79330345
UTH100 Universal tablet holder for Pundit PD UHA100 Universal tablet holder with chest harness
Can also be used as an iPad stand

Technology - 8 channels
Ch 1
1 channel =
3 transducer elements
Connected in parallel
Ch 2 Ch 3 Ch 4 Ch 5 Ch 6 Ch 7 Ch 8
21 cm
3 cm

Technology - Operating principle
One channel transmits
The signal is received on the other 7 channels
Each channel transmits in turn
A complete cycle is completed in ms
The individual signals are used to create a
B-scan image in real time

Technology - B-scan
Real time imaging
B-scan
slice perpendicular to
scanning surface
21 cm
Scanning surface
Back wall echo

A time slice or C-scan
shows the amplitude
of the signal at a
chosen depth
Technology - C-scan or Time Slice
Real time imaging
We can adjust the
thickness of the slice
and move it to any
depth

Recommended Workflow
Tips on structural assessment.
Structural assessment with the PD8050 is typically done for the following cases:-
1. Thickness measurement –e.g. tunnel lining thickness
2. Concrete quality assessment by means of ultrasonic pulse velocity measurements
3. Verification of the presence or absence of structural defects, in particular voids, delaminations and honeycombs.
4. Verification of the presence or absence of voids inside tendon ducts.
In all cases a good starting point is the recommended measurement settings
Case 1 –It is important to know the expected thickness of the tunnel and select the appropriate depth of field. This will usually be the intermediate range.
Because of the large amount of reinforcement used in tunnels, it is typically not advisable to use the near field setting as this has a reduced transmission voltage.
Case 2 –In this case it is necessary to know the thickness of the element being tested and to set the appropriate depth of field.
Case 3 –For this investigation it is necessary to find out as much information as possible on the suspected default. Are there drawings of the structure available?
How thick is the structure? What kind of defect is suspected? (e.g. a void caused by concrete not flowing freely due to dense reinforcement). Is the approximate
depth of the suspected defect known? Have any destructive tests been carried out to confirm the presence of a defect? Once this is known, the starting point is
to try and locate a position on the structure where there is a back wall echo clearly visible and then to compare this with the images taken at the suspected
defect locations.
Case 4 –This technique involves locating the tendon duct with a GPR instrument and then carrying out a full 3D matrix scan along the duct to look for variations
in amplitude which indicates the likely presence of voids. There are a number of guidelines available on this technique that the user is advised to consult for
further information.
Other than case 4, the best way to proceed is to try and detect a clean back wall image at some point on the structure.

Recommended Workflow
Tips on obtaining a good back wall image.
•Perform a provisional investigation. Without saving any data, move the sensor around the surface to try to locate a back wall echo.
If no back wall is immediately visible, try the following:-
•Try rotating the probe diagonally to reduce the influence of reinforcement.
•Try increasing the linear gain and digital TGC if no back wall echo is immediately visible.
(Note: in order to do this the auto gain function must be switched off.)
•If this fails, try increasing the analog gain and TGC.
•If this still does not work, then it may be necessary to use a lower frequency, either by setting the depth of field to far field, or by manually adjusting,
Reasons why a back wall image may not be visible:
•Coating on the surface with de-bonding to the concrete. Typically results in a totally red reflection from the top of the scan.
•Near to surface defect. Typically results in a totally red reflection from near the top of the scan.
•The element is too thick. Typically, the scan will be completely blue if there are no objects present.
•There is too much reinforcement or poor concrete quality causes too much attenuation.
•There are voids or honeycombs in the path. Typically, the objects will be visible as significant red, orange, yellow echoes.
•There are delaminations not visible due to destructive interference which block the path to the back wall. This occurs when the delaminations or voids
have very rough surfaces which scatter the reflections. The scan may appear totally blue in this case, even though there may be large defects visible.
This has been known to occur in steel fibre reinforced concrete and verified by destructive testing.

Recommended Workflow
Check Measurement
Settings
Adjust Gain and TGC
Calibrate Pulse Velocity
(Optional)
Provisional Investigation
Scan

Recommend Measurement Settings
Measuring Presets
Measuring mode
Line scan
Depth of field
Intermediate field
A.I. Positioning
Off
X
-spacing
21
Image Stabilizer
1
Units
Metric or Imperial
depending on region
Variation
Full matrix 3D for 3D imaging
Grid scan for large area heat maps
Near field for objects < 30 cm thick
Far field for objects > 1m thick
ON (Requires AI measurement tape)
Initial settings recommended to give a reasonable image on concrete without the need to calibrate the pulse velocity on
the test object.
Advanced Measuring Presets
Half Cycle
Off
Analog Gain
36 dB
Analog TGC
0 dB
Pulse Delay
8
ms
Variation
10 dB for objects thick objects (ca. 1m)

Recommend Measurement Settings
Image Processing
Auto Gain
ON
Global Pulse
Velocity
2600
Ascan
Signal and Envelope
Variation
If auto gain is off, then set Linear Gain and Digital
TGC to default values (0, 0)
Initial settings recommended to give a reasonable image on concrete without the need to calibrate the pulse velocity on
the test object.
Advanced Image Processing
Surface Wave
Cancellation
OFF
Raw Data Offset
(µs)
-
30
Variation
Removes noise caused by surface waves
Only change this if it can be calibrated with 1
st and
2
nd back wall echoes

Depth of Field – Custom Settings
Settings
Tx Frequency (
kHZ)
Low frequency
reduces resolution close to surface, increases
penetration depth
High frequency
increased resolution close to surface, decreases
penetration depth
Tx Voltage (V)
Adjust transmission signal strength
(Note!
On adjusting the voltage there is a short delay until it
reaches the new voltage level)
Max Transmission Time (µs)
Adjusts the maximum transmission range
If desired the depth of field settings can be individually adjusted

Analog Gain and TGC
For most test objects it is recommended to leave the Analog Gain and TGC at the default values and
to use the digital gain and TGC in Image Processing to obtain a good image.
TIP –double tap on the slider to reset to the defaults (36, 0)
However, particularly for deep objects it may be desirable to increase the analog gain and TGC.
In total there is 80 dB of gain available.
NOTE! If analogue gain and TGC are adjusted, remember to reset to the default values on
completion of the test.
Gain
Range 0 –80 dB
Maximum Total Gain
Gain + TGC
= 80dB
Time gain
compensation
Range 0 –20 dB

Advanced Settings – Half Cycle
Can help to distinguish near surface objects that are close to each other.
Pulse begin Pulse begin Pulse inversion
through
Reflection at a
concrete/air
boundary
Tx Pulse Rx waveform
(A-scan

Advanced Settings – Image Stabilizer
Used to reduce flicker on the real time B-scan image
The image displayed on screen is a combination of the latest real-time image data combined with a
percentage of the previous image data. The percentage is determined by the slider.
Slider set to 1 = no stabilization –Image presentation is immediate but it flickers
Slider set to 8 = maximum stabilization –Image takes longer to build up, but there is no flicker

Advanced Settings – Pulse Delay
Introduces a delay between transmission pulses.
Functionality used for research.
Tx Pulse
Default 8 ms
e.g. 16 ms
8 ms 8 ms
16 ms
Tx Pulse Tx Pulse
/