Page is loading ...

© Copyright 2010 National Semiconductor Corporation
December 14, 2010
Revision 1.3
ADC12D1X00RB
Reference Board Users’ Guide

- 2 -
© Copyright 2010 National Semiconductor Corporation
Table of Contents
1.0 Overview
1.1 Features
1.2 Packing List
1.3 References
2.0 Quick Start
2.1 Installing the WaveVision 5 Software
2.2 Installing the ADC12D1X00RB Hardware
2.3 Launching the WaveVision 5 Software
2.4 WaveVision 5 – User Interface Overview
2.5 System / Device Configuration
2.6 Data Capturing
3.0 Secondary Panel Description
4.0 Reference Board Functional Description
4.1 System Block Diagram
4.2 System Description
5.0 Electrical Specification

- 3 -
© Copyright 2010 National Semiconductor Corporation
1.0 Overview
The ADC12D1X00RB demonstrates a high-performance signal acquisition sub-system that
achieves 12-bit resolution and corresponding SNR and dynamic range on two channels at
signal frequencies in excess of 1.0 GHz and sampling rates of at least 1.0/1.6/1.8 GS/s or one
channel at a sampling rate of 2.0/3.2/3.6 GHz. The board showcases the following National
Semiconductor devices:
• ADC12D1X00 analog-to-digital converter
• LMX2531 clock synthesizer
• LP3878 and LP38853 linear LDO regulators
• LM20242, LM25576 and LM26400 switching regulators
• LM3880 power sequencing controller
• LM95233 temperature sensor
In addition, the board also employs the Xilinx XC4VLX25-11FFG668 Virtex-4 FPGA for the
critical function of capturing the high-speed digital data sourced by the ADC.

- 4 -
© Copyright 2010 National Semiconductor Corporation
1.1 Features
Demonstrates the ADC12D1X00's typical dynamic performance – see the datasheet for
full details.
Sample rates of up to 1.0/1.6/1.8 GS/s (limited by the ADC specifications and the FPGA
capture limitations)
Input signal frequencies up to 2.8 GHz (Non-DES Mode Full-Power Bandwidth)
On-board LMX2531 based clock circuit with a connector for a selectable external clock
A complete high-performance low-noise power management section for the ADC, clock
circuit, FPGA and USB controller
Single +7.5V power adapter input
Simplicity and performance of USB 2.0 connection to the PC
Functions with National's latest WaveVision 5 signal-path control and analysis software.
1.2 Packing List
The ADC12D1X00RB kit consists of the following components:
• ADC12D1X00RB Board
• Documentation Including
o ADC12D1X00RB Users Guide (this document)
o WaveVision 5 Users Guide
o ADC12D1X00RB schematic
o ADC12D1X00RB bill of materials
o ADC12D1X00RB test results from National lab
o End user license agreement
o Letter to the user
• Hardware Kit Including
o 110V-240V AC to +7.5V DC Power Adapter
o USB cable
o 4 – DC blocks
o 2 – 50Ω terminators
o 1 – Anaren balun board (useful bandwidth of 400 MHz to 3 GHz)
o 1 – Mini-Circuits balun board (useful bandwidth of 4.5 MHz to 3 GHz)
o 4 – 6” SMA cables
1.3 References
• *ADC12D1X00 datasheet
• *LMX2531 datasheet
*Note: Please refer to www.national.com
for the latest edition of all datasheets.

- 5 -
© Copyright 2010 National Semiconductor Corporation
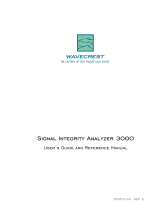
1.4 Board Orientation
Figure 1: ADC12D1X00RB Board Layout
Power
Auxiliary Data Port
(Mictor
TM
USB
I-ch. Sig.
Q-ch. Sig.
Clock
Ext. Trigger
Power
section
LMX2531
Clock
USB
Controller
FPGA
(Xilinx
LEDs
ADC12D1X00
ADC
Control
DCLK_RST
+7.5
Power
Switch

- 6 -
© Copyright 2010 National Semiconductor Corporation
Figure 2: Jumpers and LEDs

- 7 -
© Copyright 2010 National Semiconductor Corporation
2.0 Quick Start
This section will aid in bringing up the board for the first time as well as a brief tutorial on the
WaveVision 5 (WV5) software. Further description of the Reference Board is in subsequent
sections of this document. The software is further described in the WaveVision 5 Users' Guide
or the HELP function within the software. The ADC12D1X00 and LMX2531 datasheets should
be consulted for detailed understanding of device functionality.
The user is advised to construct a lab setup as close to the one shown in Figure 3 as possible.
This setup, along with the board and software configuration described below, is what was used
to test the reference board at National's lab. This set of conditions produces the stated
reference performance - which is normally included with each board shipped to customers. The
objective is to assure that the user can achieve the same performance as that recorded at
National's lab prior to board shipment.
Do not overdrive the signal and clock inputs or the ADC may be damaged. Refer to
the Electrical Specification section for the voltage tolerance of these inputs. Be very
cautious of signal generator power levels above +3 dBm. Input maximum is 4mW or
about +5 dBm maximum.
Figure 3: Recommended lab setup. A filter may not be necessary on the clock if the
generator is very clean (beyond -80dBm SFDR).

- 8 -
© Copyright 2010 National Semiconductor Corporation
2.1 Installing the WaveVision 5 Software
(Note: The WaveVision 5 software requires Windows XP operating system)
1. Insert the included WaveVision 5 CD-ROM into the computer CD drive.
2. Locate, unzip and run the install.bat program on the CD-ROM.
3. Follow the on-screen instructions to complete the installation.
2.2 Installing the ADC12D1X00RB Hardware
1. Place the ADC12D1X00RB Reference Board on a clean, static-free surface.
2. Make sure the board's jumpers are configured as follows as shown in Figure 2:
a. For the ADC, the "ECE (Extended Control Enable, active low)" jumper
should be installed in the LOW position. This enables SPI control of the
ADC.
b. Pin 9 on J15 must be connected to Ground for ac-coupled operation. The
board ships with this jumper in place as it is configured for ac-coupled
operation only. (The jumper is removed for dc-coupled operation. In that
case the applied signal must be dc-coupled, and have the common mode
DC voltage set to the required ADC12D1X00 V
CM
voltage.)
c. The PDI and PDQ jumpers must be in place as shown to enable both
channels of the ADC.
3. Connect the enclosed +7.5V DC power adapter to the power jack. Connect the other
side of the power supply to an AC outlet (100-240 VAC, 50-60 Hz).
4. Connect the input signal generator, the band-pass filter, the balun and the DC blocks to
the ADC12D1X00RB Reference Board's I-channel input connectors. Set the signal
generator at one of the frequencies and signal levels stated in the reference
performance report. Always use high-quality RF SMA cables for optimum performance.
Do not overdrive the signal and clock inputs as the ADC may be damaged. Refer to
the Electrical Specification section for the voltage tolerance of these inputs. Be very
cautious of signal generator power levels above about +3 dBm (2mW). This is
approximately 1 V-P-P which is also the full scale range of the ADC. Depending on
other hardware that is casaded with the generator path (baluns, filters, etc), caution
should be taken with signals above +3dBm
5. In the National lab, the following (or equivalent performance) equipment are used to test
the board. It is essential that the customer use signal generators, filters, DC blocks and a
balun of equivalent or better performance.
o Rohde & Schwarz SME-03 or SMA-100 signal generator
o
Filters - Trilithic tunable bandpass filter or other fixed frequency bandpass
filter of equivalent performance
o
Balun – Anaren Balun Board
o
DC blocks – Mini Circuits BLK-89 S+
o
50 Ω terminators – Mini Circuits ANNE 50+
Note: The board comes equipped with DC-blocks applied to the I-channel signal input
connectors and DC blocks and terminators applied to the unused Q-channel input
connectors. These must be used at all times - that is, the channel being used must be
connected through dc-blocks if the ADC is configured for ac-coupled operation (as
shipped). The unused channel must also be DC blocked then terminated to ac ground.
This is graphically illustrated in Figure 3.
6. Turn on the SW1 rocker power switch. Verify that the red LED (labeled LD1, near the J2
power jack) is lit.

- 9 -
© Copyright 2010 National Semiconductor Corporation
7. Connect the supplied USB 2.0 cable from the PC USB port to the ADC12D1X00RB USB
jack.
2.3 Launch the WaveVision 5 Software.
Start the WaveVision 5 software on your computer by selecting the desktop icon “WaveVision 5”
or by clicking on the Start button, and selecting
Programs -> WaveVision 5 -> WaveVision 5
The software will automatically detect the board and load the appropriate software profile and
will proceed to download the controller firmware and FPGA code onto the reference board. As
an alternative, the icon on the desktop can be used to launch WaveVision 5.
The WaveVision 5 user interface will appear on the computer screen. The STANDBY LED
should be green - meaning that the hardware is ready to capture data from the ADC upon the
user's command. The software and the board are ready to acquire data at this point. The status
LED’s should take on the following states when the system is ready for an acquisition:
(Where yellow or red is on, black is off and yellow with spokes indicates blinking)
health2
overrange_Q
trigger
standby
acquire
overrange_I
health1
overtemp
needcal
Ready to acquire
Acquiring
FPGA operational
ADC DCLKs good (either/both I&Q)
H/W trigger seen
Not yet implemented

- 10 -
© Copyright 2010 National Semiconductor Corporation
2.4 WaveVision 5 - User Interface Overview
Figure 4: WaveVision 5 Example Window
Figure 4 above shows the WV5 user interface panel (GUI). This is the top level interface panel.
It is arranged in such a way that the plot is always in the middle. There are tabs arranged on
each side of the window to give the user additional information or control of features.
The tabs available on the left side access panels that are pertinent to the current plot window -
such as channel selection, grid selection, FFT Readouts, and FFT controls.
The right side panels allow the user to take control of the hardware. These include the Signal
Source, Signal Control and Registers panels (the most relevant for this board).
In addition, a small FFT parameter summary box can be displayed by pressing CTL-R.
For more details on the general operation and use of WaveVision 5, please refer to the
WaveVision 5 Users Guide.

- 11 -
© Copyright 2010 National Semiconductor Corporation
2.5 System / Device Configuration
Prior to capturing data, confirm that the board is in the "ECE (Extended Control Enable)" mode,
The ECE jumper is located in the ADC pin control jumper area as shown in Figure 2. The board
should be sent with this jumper in place. This means that the ADC will be controlled through the
SPI interface and not with jumpers driving the control pins. This allows the user to control the
ADC's behavior through the WaveVision 5 Registers panel.
Figure 5: WaveVision 5 overview of control buttons
Figure 6: WaveVision 5 main window command buttons

- 12 -
© Copyright 2010 National Semiconductor Corporation
2.5.1 Main Panel
The main menu bar of the WaveVision 5 software has several control buttons as shown in
Figures 5 and 6, which may be used to perform most tasks with a button click.
1 - Load Plot
A new plot window is created and the Plot Load dialog is displayed. The selected plot file is
loaded into the new window.
2 - Import Data
Clicking this button creates a new time-domain plot and opens the Import Data dialog. Data may
be imported from WaveVision 4 data files as well as from ASCII data files created by other
programs.
3 - Create a New Time Domain Plot
Clicking this button creates a new time-domain plot. The plot will contain no data, but is
available as a data destination.
4 - Create a New Hardware Histogram Plot
Clicking this button creates a new hardware histogram plot. Hardware histograms are available
only in conjunction with evaluation boards which can gather histogram data internally. This
button is enabled only when an evaluation board which supports hardware histograms is
attached.
5 - Acquire Data
Click this button to acquire data to the active plot. If you have created more than one plot, the
Active plot has a highlighted title bar.
6 - Continuous Acquisition
This button is a toggle - when it is pressed, data is acquired continuously, one buffer after
another as fast as the hardware can go; when pressed again data acquisition stops. When in
continuous acquisition mode, acquisition may be started and stopped using the Acquire button
without leaving the continuous acquisition mode.
7 - FFT Averaging
This button is also a toggle - when it is pressed, FFT's are averaged. The number of buffers to
be averaged is specified in the hardware section of the Signal Sources tab.
Please refer to the WaveVision 5 Users Guide for more information.

- 13 -
© Copyright 2010 National Semiconductor Corporation
2.5.2 Plot Window Controls
Figure 7: WaveVision 5 plot window controls
1 - Load Plot
The Plot Load dialog is displayed, and the selected plot file is loaded into the new window.
2 - Save Plot
Displays the Plot Save dialog (this button is only active when the plot contains one or more
channels with data).
3 - Reset Zoom
Reset X and Y axis zoom to 100%.
4 - Clear
Clear data from all channels.
5 - Print
Print the plot.
6 - Time Domain
Display the plot as time domain data.
7 - FFT
Display the plot as an FFT
8 – Histogram
Display a histogram of the data.
9 - Close
Close this plot.

- 14 -
© Copyright 2010 National Semiconductor Corporation
2.5.3 Right Panels – Signal Source
Figure 8a: WaveVision 5 main window command buttons
Open the Signal Source panel on the right side of the window and confirm that the
ADC12D1X00RB is available and confirm that it is selected. There are four possible modes of
operation selectable here:
• I-Channel – Two channel mode capturing and viewing the I-channel data
• Q-Channel – Two channel mode capturing and viewing the Q-channel data
• I and Q - Two channel mode capturing and viewing both the I- and Q-channel data
• DES-mode –Dual Edge Sampling (interleaved) Mode
Double Edge Sampling (DES)
– Double edge sampling works much in the same way as single edge
sampling except that the signals is sampled both on the rising and falling edge of the sample clock. This
effectively doubles the sample rate. In this mode, both converters inside the ADC12D1X00 work on a
common input signal. The DES mode is selected from the Signal Source tab on the right side. Then, the
Q-channel can also be selected as the input. To do this, go the Register panel select Config and DESQ
and then perform a Write Config Register. Alternately, the DESIQ Mode may be selected so that both I-
and Q-channels are externally driven by the same signal. See the datasheet for more details.

- 15 -
© Copyright 2010 National Semiconductor Corporation
Note – When using “I and Q” mode, it is also necessary to select the Channels tab and deselect
the “Automatically hide inactive channels” option box in order to allow both channels to appear
on the plot. Alternatively, one channel may be displayed per plot:
Figure 8b: I and Q mode – one channel displayed per plot

- 16 -
© Copyright 2010 National Semiconductor Corporation
Figure 9: WaveVision 5 main window command buttons
• Sampling Rate - When the signal source panel is selected, the clock frequency is
displayed. This is initially the internal clock. In this example, 1800 MHz is generated by
the LMX2531 on the reference board. The sampling rate is determined by the FPGA
when the board is powered up. The calculation is accurate to better than 1%. If an
external source is in use, confirm that this number corresponds to the clock reference
that is applied. If it is not correct, subsequent data captures and display will not be
correct.
• Resolution – This will always be set to the ADC12D1X00 resolution which is 12 bits.
• Acquisition Size - This setting displays and selects the number of samples captured in
each acquisition. 4K samples is the default, with settings up to 32K samples. A larger
sample size increases the equivalent FFT bandwidth resolution, but at the expense of
more memory and slower acquisition time.
• Data Format - The default data format is offset binary for the ADC12D1X00.
• FFT buffers to average - The last option is the FFT averaging function. Using this
feature, subsequent samples can be averaged to obtain improved signal to noise.
However, this is at the expense of time.

- 17 -
© Copyright 2010 National Semiconductor Corporation
2.5.4 Right Panels - Registers
Next, configure the hardware (including the ADC) using the Registers control panel on the right
side. This is the most important of all the panels for controlling the ADC12D1X00RB.
This panel has twelve sub-tabs that control the settings of the board and registers inside the
ADC12D1X00. The twelve sub-tabs are shown below and include; Settings, Config, Cal Adjust,
I-channel, Q-channel, DES Adjust, t
AD
Adjust, AutoSync, and Temperature. The last three tabs
are register contents so that the user may verify register settings to be programmed in the
system.
Figure 10: The top level of the Register panel showing the available tabs
The following is a short description of each tab under the Register panel.
Settings: This tab gives choice of either External Clock or Internal Clock, and buttons to
initiate FPGA Reset, Reset Registers and Calibrate ADC. Calibration of the ADC should be
performed if changes occur such as device temperature, mode changes (single channel to dual
channel, single edge sampling (Non-DES) to double edge sampling (DES). For more
information, refer to the Calibration section of the ADC12D1X00 datasheet. The H/W Trigger
function is also enabled using the check box on this tab.
Note: If the Internal Clock is selected, then the External Clock signal generator should be
disconnected or switched off to prevent performance degradation.

- 18 -
© Copyright 2010 National Semiconductor Corporation
Config: This tab configures various features and modes of the ADC12D1X00 and is shown
below. It accesses or changes the following functions, all of which are controlled through
Configuration Register 1.
Figure 11: Config Panel
• DPS – DDR Phase Select – Determines the DDR Data-to-DCLK phase relationship. When
unchecked, the 0° Mode is selected. When checked the 90° Mode is selected.
• OVS – Output Voltage Select – Selects the LVDS differential output voltage. When this is
unchecked, the reduced output amplitude is selected. When checked, the standard (higher)
output amplitude is used.
• TPM – Test Pattern Mode – When checked the device will continually output a fixed pattern on
the Data and OR outputs. When cleared, the normal ADC Data and OR information are output.
• PDI – Power down I Channel when checked.
• PDQ – Power down Q channel when checked.
• LFS – Low Frequency Select – check this box for improved performance for Fclk < 300MHz.
• DESQ – Double Edge Sample mode uses Q input (rather than I input) when checked.
• DESIQ – Double Edge Sample mode with I and Q as input – shorts both I and Q inputs together.
• 2SC – Two’s Complement output mode is selected when checked. Default is offset binary.
• TSE – Check to enable Time Stamp feature.
Note: No changes will take effect until the Write Config Reg button is clicked.

- 19 -
© Copyright 2010 National Semiconductor Corporation
Cal Adjust: This tab controls the various adjustments which may be made to the Calibration
feature.
Figure 11a: Cal Adjust Panel
• CSS – Skip or include Rtrim calibration. When the Rtrim has been completed once, it is not
necessary to do it again until the device is power cycled.
• SSC – Calibration control via the SPI, i.e. not the pin-controlled option for calibration.
Note: No changes will take effect until the Write Config Reg button is clicked.

- 20 -
© Copyright 2010 National Semiconductor Corporation
I-channel: This tab changes the sign and the magnitude of the offset and the full scale range
settings.
Figure 12: I-Channel Panel
• I-channel Offset Sign – This pull-down selects a positive or negative offset.
• I-ch Offset – This slider selects the magnitude of I-ch Offset applied. Adjustment can be
done using the computer mouse/pointer, or using left/right arrow keys once the slider
has been selected. Although the offset is entered in a 10 bit (0 to 4095) relative form, it is
also displayed in approximate mV.
• I-Channel Full Scale - The approximate I-Channel input full scale range (mV peak-to-
peak) is selected, ranging from a minimum of 600mV to a maximum of 1000mV. The
default setting is 800mV.
Note: No changes will take effect until the Write I-ch Reg button is clicked. Also, the ADC must
be re-calibrated if the full-scale is changed.
Q-channel:
Similar to I-channel
/