Page is loading ...

ProPac 3R SCX
3 µm columns
Product manual
HPLC columns

Contents
Introduction 3
Strong cation exchange technology 3
SCX chromatography applications 3
ProPac 3R SCX 3 µm column 3
Operation: System requirements and column use and care 4
Getting started 4
System requirements 4
System void volume 4
Column use and physical specifications 4
Recommended buffers for salt and pH gradient separations 5
Recommended buffers for pH gradient separations 5
Column conditioning 6
Minimum equilibration volumes for buffers 6
Column storage and extended care 6
Column performance verification 6
SCX chromatography applications 7
Salt gradient principles 7
Example salt gradient methods 7
Lot-to-lot reproducibility 9
Stressed sample analysis 10
Salt gradient analysis of additional mAbs 11
Competitor comparison 12
pH gradient separation principles 13
Optimized pH gradient method 14
pH gradient analysis on additional mAbs 15
Reference 16
2Product manual thermofisher.com/propac

Introduction
Strong cation exchange technology
Thermo Scientific™ ProPac™ 3R Strong Cation Exchange (SCX)
3 µm columns are designed to provide fast, high efficiency,
high resolution separations of proteins and glycoproteins based
on their accessible surface charge. The 3 µm, monodisperse
particle is non-porous and based on a divinylbenzene resin
coated with a hydrophilic polymer layer to exclude proteins from
the surface of the resin to minimize secondary interactions.
Grafting of a functional polymeric layer to this hydrophilic surface
introduces sulfonic acid groups that provide the strong cation
exchange character for promoting protein binding using a low
ionic strength mobile phase at an appropriate pH (e.g., 20 mM
MES, pH 6.5). Running a gradient from low to high ionic strength
mobile phase or from low to high pH disrupts the ionic protein-
surface interactions resulting in protein and variant elution based
on their relative strength of interaction with the surface.
SCX chromatography applications
Protein SCX column technology is widely used in
biopharmaceutical development and qualification of protein-
based therapeutics and their associated variants. Most
commonly, they are used for the analysis of monoclonal
antibodies (mAbs), which are a class of therapeutics widely
applied to the treatment of cardiovascular diseases, autoimmune
disorders, and cancers. MAbs are of particular interest for their
ability to target specific cells for drug delivery or modulation of
cellular activity with reduced side effects compared to other
systemic delivery methods. Because of this specificity, mAbs
have been investigated for and applied to a wide range of
treatments with strong growth expected for the foreseeable
future. As the complexity of these therapeutics increases,
continued improvements in analytical technologies will be
required to characterize these therapeutics and fulfill regulatory
requirements to bring these therapeutics to market.
ProPac 3R SCX 3 µm column
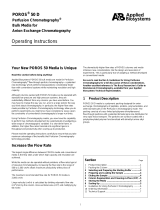
The ProPac 3R SCX 3 µm column is designed to achieve high-
efficiency protein separations. The packing material is based
on a 3 μm, nonporous, divinylbenzene monodisperse polymer
particle shown in Figure 1. Both the chemistry and size of the
base monodisperse particle are tightly controlled. The chemistry
consistency provides a solid platform for reproducibly producing
the hydrophilic layer and sulfonic acid SCX functionality using
controlled polymerization techniques. The 3 μm monodisperse
particle results in shorter diffusion distances to provide
reproducible mass transfer for narrow peaks. Due to increased
capacity associated with smaller particles, shorter columns can
also be used for faster run times with improved separation relative
to larger particle media that require longer column lengths to
achieve the same separation.
The uniform size of the particle enables precise control over
the column packing. The ProPac 3R SCX media are packed
in a PEEK (polyether ether ketone) hardware, which has
well-established bioinert properties to minimize nonspecific
adsorption of protein samples. The reproducible resin size and
chemistry combined with controlled synthetic and packing
manufacturing processes provide excellent lot-to-lot and column-
to-column reproducibility.
Figure 1: SEM image of 3 µm monodisperse ProPac 3R particles
(left) vs. 3 µm polydisperse particles (right)
Table 1. ProPac 3R SCX 3 µm columns
Description Dimensions Particle size Cat. no
Thermo Scientific ProPac 3R SCX columns
2 mm x 50 mm 3 μm 43103-052068
2 mm x 100 mm 3 μm 43103-102068
4 mm x 50 mm 3 μm 43103-054068
4 mm x 100 mm 3 μm 43103-104068
Product manual thermofisher.com/propac 3

Operation: System requirements
and column use and care
Getting started
Prior to using the ProPac 3R SCX 3 µm column, review all the
information in this section on system requirements and column
operation regarding flow rate, maximum pressure, mobile phase
composition, temperatures, etc. Following these specifications
for your column will help to ensure the column performs as it is
intended and maximize the lifetime of your column.
System requirements
ProPac 3R SCX 3 µm columns are designed to be used with
a standard bore bio-inert HPLC or UHPLC system having
a gradient pump module, autosampler, injection valve, and
a detector appropriate for your application (UV, DAD, VWD,
Fluorescence, MS). A Thermo Scientific™ Vanquish™ Flex, Thermo
Scientific™ Vanquish™ Horizon, and a Thermo Scientific™ UltiMate™
3000 BioRS totally inert UHPLC system is recommended for
best results. A properly setup system is required to ensure good
chromatographic performance and to extend the lifetime of your
column.
A biocompatible system is highly recommended for mobile
phases containing halide salts that can cause corrosion
of metallic components. Metal leaching from the system
components including the pump and connection tubing can
contaminate the column and compromise chromatographic
performance. Avoid using stainless steel tubing, ferrules, and
bolt assemblies and replace them with MP35N tubing, PEEK,
or other equivalent inert alternatives. For column-to-tubing
connections, Thermo Scientific™ Viper™ Capillary MP35N with
Thermo Scientific™ Viper™ Connection Fittings are strongly
recommended. If your column has become contaminated with
metals, the performance can be recovered by flushing with an
EDTA (ethylenediaminetetraacetic acid) solution as described in
Table 3.
System void volume
Tubing between the injection valve and detector should be
≤ 0.130 mm (0.0050” ID) tubing to minimize dispersion. Minimize
the length of all liquid lines, especially the tubing between the
column and the detector. The use of larger diameter and/or
longer tubing may decrease peak efficiency and peak resolution
Column use and physical specifications
To ensure that you do not damage the column hardware or
packed bed, take care to operate within the limits of the column.
Table 2 indicates the operational limits for each column format in
terms of flow rate, maximum column pressure drop from inlet to
outlet, temperature, and mobile phase pH.
Table 2. Recommend column operating conditions for
optimal performance and extending column lifetime
Column
Flow
rate
(mL/min)
Max
column
pressure
drop¹
psi (bar)
Temp
°C pH
2 mm x 50 mm 0.1-0.3
4500² (310)² Ambient
– 60°C 2-12
2 mm x 100 mm 0.1-0.2
4 mm x 50 mm 0.3-0.5
4 mm x 100 mm 0.3-0.5
¹The column pressure drop for a given flow rate is calculated as the pressure of the system with
column minus the pressure of system with union in place of column
²For PEEK body columns, the maximum pressure at the column inlet should not exceed 7000 psi
(485 bar) to avoid damaging the column body
Additional requirements for safe column operation:
• Always set up the mobile phase flow direction as indicated on
the column tag
• Avoid sharp pressure fluctuations as they may disrupt the
column bed
• When starting, stopping, or changing the flow rate, a flow
ramp rate (mL/min/min) of ~1/3 of the maximum flow rate for
the specific column format is recommended
4Product manual thermofisher.com/propac

Operation: System requirements
and column use and care Continued
Table 3. Recommend buffers and mobile phase
requirements
Parameter Recommended
Buffer • MES or other Good’s buers
• Thermo Scientific™ CX-1 pH gradient
buers
• LC-MS: Ammonium acetate,
ammonium bicarbonate, ammonium
formate and associated acids and
bases for pH gradients³
Minimum salt
concentration
• 20 mM NaCl to avoid high pressure
that can damage the column
stationary phase
• Caution: Never use pure deionized
water on the column as this will
result in irreversible damage
Detergent additives • Nonionic, anionic or zwitterionic
detergents
• Caution: Do not use cationic
detergents as they will irreversibly
bind to the column and reduce the
separation power
Organic solvent
compatibility⁴
• Up to 20% acetonitrile
• Up to 10% methanol
Cleaning agents • For metal contamination (Fe, Cu,
etc.) removal, flush the column at
0.4× the max column flow rate for
12 hours with 10mM EDTA + 50mM
NaCl adjusted to pH 8.0
Storage solution • Short term: ≥ 20 mM NaCl and your
application buer
• Long term: ≥ 20 mM NaCl and your
application buer + 0.1% sodium
azide
³Due to the weak ionic strength of volatile pH buffers, use lower flow rates for initial method
development until the column back pressure is understood. The flow rate can then be increased as
needed while still observing the maximum allowed pressure for the column.
⁴Acetonitrile and methanol have viscosity maxima when mixed with water at certain ratios. This
may cause unexpectedly high pressure. Always use low flow rates until the pressure behavior is
understood when using these chemicals. Mixtures of ACN and MeOH should be introduced and
removed gradually from the column using a gradient over 20 minutes to ensure a sharp viscosity
front does not results in a rapid pressure difference in-column that may damage the packed bed.
Recommended buffers for pH
gradient separations
For pH gradient separations, we recommend using Thermo
Scientific CX-1 pH gradient buffers (see Table 4 for part numbers),
which can be used to run a linear, highly reproducible pH
gradient from pH 5.6 to 10.2. As the majority of mAbs have a pI
between 6 and 10, these buffers can be used to separate the
mAbs from their associated charge variants with less method
development compared to salt gradients. Because of this, the
CX-1 pH gradient buffers present a simple platform method for
mAb analysis that can easily be tailored to the users own mAb by
simple adjustment of the gradient. For examples of mAb analyses
using the pH gradient buffers, please reference the applications
section below.
Table 4. Thermo Scientific CX-1 pH gradient buffers
Description Size pH Cat. no.
pH gradient buffer A
125 mL
pH 5.6
083273
250 mL 085346
500 mL 302779
1000 mL 303274
pH gradient buffer B
125 mL
pH 10.2
083275
250 mL 085348
500 mL 302780
1000 mL 303275
Recommended buffers for
salt and pH gradient separations
Salt gradient separations typically offer the best resolution
possible for individual applications. Please consult Table 3
below for recommended buffer conditions to achieve optimal
separations and maintain good column performance throughout
its lifetime.
Product manual thermofisher.com/propac 5

Operation: System requirements
and column use and care Continued
Column conditioning
Your column has been designed to minimize secondary
interactions and for low carryover. Depending on the nature
of your sample, column conditioning may be required prior to
achieving optimal performance. To quickly condition your column,
we recommend performing 1-2 sample overload injections of
10× your standard sample loading and standard gradient
method.
Minimum equilibration
volumes for buffers
Prior to sample loading and start of the gradient, the column
stationary phase must be properly equilibrated to promote
binding of the analytes. Salt and pH gradient buffers require
different volumes of buffer at sample loading conditions to
equilibrate the column. It is strongly advised that the user
evaluate the required equilibration volume by examining the
UV, pH, or conductivity of the mobile phase when making a
step change to their preferred loading conditions. The volume
of mobile phase eluted from the time of the step change to
when steady-state is observed for the mobile phase UV, pH, or
conductivity trace represents the minimum volume required for
equilibration of the stationary phase.
Column storage and extended care
To maintain the performance of your column between uses,
always store the column filled with the recommended buffers as
detailed in Table 3. Use the plugs the column was shipped with to
seal the ends of the column to prevent evaporation of the buffer
and drying of the stationary phase. The formation of salt crystals
in a dried bed may result in column clogging or reduced column
performance in subsequent uses.
Depending on the length of time between column uses, the
storage buffers should be used as follows:
• Short term storage (≤1 day): Fill the column with a low ionic
strength buer (e.g., 20 mM MES + ≥20 mM NaCl)
• Long term storage (>1 day): Fill the column with a low ionic
strength buer + ≥20 mM NaCl and supplemented with
0.1% sodium azide
Sodium azide serves as a preservative to prevent bacterial
growth that can damage the column phase, result in column
clogging, and decrease column performance. When using the
column again after storage with a sodium azide containing
buffer, flush the column with ≥10 column volumes of low ionic
strength buffer to remove all of the sodium azide before starting
any sample runs. At least 2 blank runs with a gradient from
low to high salt concentration prior to any sample runs are also
recommended for best performance for the initial sample runs.
Column performance verification
Each column is shipped with two Certificates of Analysis (CoA)
one verifying the resin performance and one verifying the column
performance. The resin qualification CoA details a salt gradient
separation of NISTmAb and variants on a 4 × 100 mm column.
This test is not performed for every column but is used to qualify
the resin performance prior to manufacturing columns. The
column CoA test is an isocratic analysis of equine cytochrome C.
Each CoA provides the test conditions used. These tests can be
reproduced to check the performance of your column. The lot
qualification test is performed using a 4 × 100 mm column and
the gradient and flow rate should be scaled based on column
length and diameter, respectively. The isocratic cytochrome
C test conditions can be used as described to verify column
performance. Note that differences in system configuration
may result in differences in retention time and chromatographic
performance. Table 5 provides purchasing information for the
proteins used in the CoA tests.
Table 5. Proteins used for resin lot qualification
and column performance test
Protein Supplier Cat. no.
NISTmAb NIST (National Institute of
Standards and Technology)
8671
Equine cytochrome C Sigma Aldrich C2506
6Product manual thermofisher.com/propac

SCX chromatography
applications
Two approaches are typically used for protein and variant
analysis on SCX columns: 1) salt gradient separation and 2) pH
gradient separation. For both approaches, the protein is loaded
onto the column stationary phase using a low ionic strength
buffer. However, the salt gradient approach relies on increasing
the solution ionic strength to elute the protein; whereas the
pH gradient approach shifts the net charge of the protein from
cationic to anionic to disrupt protein-surface interactions. Salt
gradients typically offer optimal separation of proteins and their
associated variants; however, these methods typically require
considerable development time investigating different buffer
components, pH, salts, gradient slopes, temperatures, etc.¹ In
contrast, the pH gradient approach is a simple platform method
for facile separation of proteins and their variants based on their
respective isoelectric points (pI).²
Salt gradient principles
When using a salt gradient, the ionic strength of the solution is
increased over time typically using a salt such as NaCl. At higher
salt concentrations, the cationic salt component will exclude
the interactions of the cationic protein species from the sulfonic
acid groups of the stationary phase leading to protein desorption
and elution from the column. Proteins with a greater number of
cationic groups and/or fewer anionic groups will tend to elute at
higher salt concentrations relative to those with fewer cationic
groups and/or more anionic groups. The following sections
provide a few specific examples of separation using salt gradient
methods. For a detailed discussion of method development using
salt gradients please reference application note “Salt gradient
analysis of monoclonal antibodies using a 3 µm monodisperse
SCX chromatography column”.¹
Example salt gradient methods
To effectively separate a protein and its associated variants, it is
important to optimize the method used to analyze the sample.
Common chromatographic parameters used to optimize methods
include mobile phase pH, starting gradient conditions, gradient
time, flow rate, temperature, and sample mass loading, which
can be optimized to provide high resolution, high reproducibility
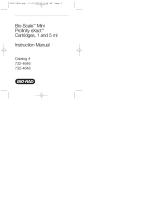
protein separations. Figure 2 shows two methods for NISTmAb
that have been optimized with (A) a fast analysis method using
a 10 min gradient at 0.5 mL/min and (B) a longer high-resolution
method using a 30 min gradient at 0.3 mL/min. The fast method
is practical for a QC environment where rapid sample analysis is
desired while the high-resolution longer gradient, provides greater
separation of main peak and charge variants enabling improved
separation and quantification of each variant. In both cases,
the high resolution and capacity of the ProPac 3R SCX column
provides narrow peaks with sufficient retention time separation to
detect the variants associated with NISTmAb.
Product manual thermofisher.com/propac 7

SCX chromatography
applications Continued
Column ProPac 3R SCX, 3 µm
Format 4 × 100 mm
Mobile phase A: 20 mM MES, pH 6.5
B: 20 mM MES, pH 6.5 + 0.5 M NaCl
Flow rate 0.5 mL/min
Injection 2 µL
Temp 30 °C
Detection UV, 280 nm
Sample NISTmAb – 10 mg/mL
Gradient %A %B
Time (min)
0.0 90 10
10.0 70 30
10.1 20 80
13.0 20 80
13.1 90 10
20.0 90 10
Figure 2: NISTmAb analysis using short method with 10-minute gradient at 0.5 mL/min (A) and Long method with
30-minute gradient at 0.3 mL/min flow rate (B)
Column ProPac 3R SCX, 3 µm
Format 4 × 100 mm
Mobile phase A: 20 mM MES, pH 6.5
B: 20 mM MES, pH 6.5 + 0.5 M NaCl
Flow rate 0.3 mL/min
Injection 2 µL
Temp 30 °C
Detection UV, 280 nm
Sample NISTmAb – 10 mg/mL
Gradient %A %B
Time (min)
0.0 90 10
30.0 70 30
30.1 20 80
33.0 20 80
33.1 90 10
40.0 90 10
mAU
036912 15
-50
0
100
200
300
mAU
Time (min)
mAU
Time (min)
14 16 18 20 22 24 26
28
-20
0
60
120
180
A
B
mAU
036912 15
-50
0
100
200
300
mAU
Time (min)
mAU
Time (min)
14 16 18 20 22 24 26 28
-20
0
60
120
180
A
B
8Product manual thermofisher.com/propac

SCX chromatography
applications Continued
Lot-to-lot reproducibility
Using the high resolution 30-minute gradient shown in Figure 2,
we compared the performance of three different lots of media to
evaluate the column-to-column and lot-to-lot reproducibility of the
ProPac 3R SCX columns. Figure 3 shows excellent reproducibility
observed in this analysis. The ProPac 3R technology platform
made using monodisperse particles and precision-controlled
chemistry makes this possible giving the user confidence in their
separation with different lots of media.
Figure 3: Chromatograms of three different lots using a long method with a 30-minute gradient at 0.3 mL/min flow rate.
Retention time of main mAb peak is normalized to aid comparison of variant separation of the detailed view of the mAb variants.
Column ProPac 3R SCX, 3 µm
Format 4 × 100 mm
Mobile phase A: 20 mM MES, pH 6.5
B: 20 mM MES, pH 6.5 + 0.5 M NaCl
Flow rate 0.3 mL/min
Injection 2 µL
Temp 30 °C
Detection UV, 280 nm
Sample NISTmAb – 10 mg/mL
Gradient %A %B
Time (min)
0.0 90 10
30.0 70 30
30.1 20 80
33.0 20 80
33.1 90 10
40.0 90 10
mAU
200
Time (min)
-20
100
Lot 1
14 16 18 20 22 24 26 28
Lot 2
Lot 3
Product manual thermofisher.com/propac 9

Figure 4: Overlaid chromatograms of non-stressed mAb sample (black) against a stressed sample (red).
Top chromatogram is analysis of NISTmAb sample and bottom chromatogram is analysis of Infliximab sample.
Stressed sample analysis
To illustrate the ability of the ProPac 3R SCX to differentiate
samples with irregular variant profiles, we compared the
separation of native forms of both NISTmAb and a sample that
was stressed at 40 °C for 72 hours. Thermal stressing of samples
typically results in an increase in the number of acidic variants
such as deamidation. The chromatograms below in Figure 4
demonstrates clear differences in the peak profile due to an
overall increase in the peak intensity and relative area of the
variant peaks for stressed samples (red traces). The ProPac 3R
SCX maintains excellent resolution of the peaks enabling easy
comparison against the unstressed samples.
Column ProPac 3R SCX, 3 µm
Format 4 × 100 mm
Mobile phase A: 20 mM MES, pH 6.5
B: 20 mM MES, pH 6.5 + 0.5 M NaCl
Flow rate 0.3 mL/min
Injection 2 µL
Temp 30 °C
Detection UV, 280 nm
Sample NISTmAb – 10 mg/mL
Gradient %A %B
Time (min)
0.0 90 10
30.0 70 30
30.1 20 80
33.0 20 80
33.1 90 10
40.0 90 10
mAU
Time (min)
14 16 18 20 22 24 26
20
-1
0
0
40
50
Stressed sample
SCX chromatography
applications Continued
10 Product manual thermofisher.com/propac

SCX chromatography
applications Continued
Salt gradient analysis of additional mAbs
High resolution methods were also developed for four additional
mAbs using a salt gradient. Each mAb was optimized using an
initial non-eluting salt concentration to load the protein followed by
a linear gradient to elute the sample. The general gradient used is
provided here with Table 6 giving the initial and final %B gradient
values for each mAb. Figure 5 demonstrates excellent mAb-variant
separation for each mAb using the ProPac 3R SCX 4 × 100 mm
with a simple salt gradient in MES buffer pH 6.5 at 30 °C over
30 minutes.
Figure 5: Analysis of selected mAbs on a 4 × 100 mm column using a general gradient with optimized initial and final %B values
detailed in Table 6. Left chromatogram shows the full signal range with the right chromatogram showing the detailed view of the mAb variants.
NIST NIST
Infliximab Infliximab
Pertuzumab Pertuzumab
Vedolizumab Vedolizumab
Secukinumab Secukinumab
0
51015202530
714 21
28
100
-10
60
-10
100
-10
80
-10
25
-5
15
-3
15
-3
15
-3
10
-3
10
-3
Time (min)
mAU
Time (min)
mAU
General mAb gradient for 4 × 100 mm
Mobile phase A: 20 mM MES pH 6.5
B: 20 mM MES + 500mM NaCl pH 6.5
Flow rate 0.3 mL/min
Temp 30 °C
Gradient %B (Table 6)
Time (min)
0.0 Initial
30.0 Final
30.1 80
33.0 80
33.1 Initial
40.0 Initial
Product manual thermofisher.com/propac 11

Table 6: Gradient parameters for analysis of
mAbs using salt gradient
mAb Initial %B Final %B
NISTmAb 10 30
Infliximab 722
Pertuzumab 10 25
Vedolizumab 522
Secukinumab 522
SCX chromatography
applications Continued
Competitor comparison
Figure 6 below compares the performance of the ProPac 3R
SCX column against our current Thermo Scientific™ MAbPac™
SCX-10 column and a competitor’s 3 µm SCX column. For
the MAbPac SCX-10 the flow rate is increased to 1 mL/min to
maximize performance. For the competitor’s column, the flow
rate was scaled to the larger 4.6 mm column ID. Relative to the
250 mm long MAbPac SCX-10 column, the 100 mm ProPac 3R
SCX shows similar separation of the proximal acidic peak and
clearly better resolution and detection of the more distal acidic
peaks which elute as a single peak on the MAbPac SCX-10.
Figure 6: Comparison of NISTmAb separation on MAbPac SCX-10, 10 µm 4 × 250 mm; ProPac 3R SCX, 3 µm 4 × 100 mm;
and a competitor’s SCX 3 µm 4.6 × 100mm columns using a high-resolution 25-minute gradient method. Retention times
are normalized for comparison of variant separation.
MAbPac SCX-10,10 µm,
4 × 250 mm, 13-23 %B
ProPac 3R SCX, 3 µm,
4 × 100 mm, 16-26 %B
Competitor’s SCX, 3 µm,
4.6 × 100 mm, 14-24 %B
Time (min)
mAU
21210864
11
614 2018
22
30
0
-3
Column See chromatogram for column type
and format
Mobile phase A: 20 mM MES, pH 6.5
B: 20 mM MES, pH 6.5 + 0.5 M NaCl
Flow rate
Red: 1.0 mL/min
Blue: 0.5 mL/min
Black: 0.66 mL/min
Injection
Red: 10 µL
Blue: 2 µL
Black: 2.6 µL
Temp 30 °C
Detection UV, 280 nm
Gradient See chromatogram for change in %B
Time (min)
0.0 Binitial
25.0 Bfinal
25.1 50
27.0 50
27.1 Binitial
37.0 Binitial
Basic peak resolution for NISTmAb is also improved with narrower
peaks for improved peak detection on the ProPac 3R SCX.
Compared against the competitor 3 µm SCX, the ProPac 3R SCX
shows better separation of the proximal acidic peak and has better
separation of the distal acidic peaks. The basic peaks show similar
performance to the competitor product but with an overall greater
peak spread for the ProPac 3R SCX due to its higher capacity.
Overall, in both these comparisons, the ProPac 3R SCX has the
advantage in variant separation to provide improved analysis and
quantitation.
12 Product manual thermofisher.com/propac

SCX chromatography
applications Continued
pH gradient separation principles
When using a pH gradient, the cationic protein is adsorbed to the
stationary phase at low pH conditions followed by a gradient of
increasing mobile phase pH. As the pH of the buffer increases,
the charge of the protein shifts from cationic to neutral and then
anionic at higher buffer pH values. The change in protein charge
results in desorption from the anionic surface and elution from
the column. This mechanism is shown schematically in Figure 7
with the charge of a theoretical protein. The y-axis indicates the
pH operating range from 5.6 to 10.2 for the Thermo Scientific
CX-1 pH gradient buffers used in this manual. Many cationic
proteins including mAbs have a pI in this range allowing them to
Figure 7: Schematic of adsorption and desorption mechanism of
cationic proteins on anionic stationary phase using pH gradient buffer
Time (min)
pH
Positive
Negative
pH 10.2
pH 5.6
5
6
7
8
9
10
11
Isoelectric point (pl)
Neutral
--
--
-
-
-
-
--
-
-
-
-
----
-
-
-
-
--
-
-
-
-
----
-
-
-
-
--
-
-
-
-
--
be analyzed using this buffer system. For pH gradient methods,
the ProPac 3R SCX column 2 x 50 mm is recommended for two
reasons 1) the narrow ID will provide good detection sensitivity at
low mass loading levels and 2) the short column length minimizes
method time for analysis. The following sections provide a few
specific examples of separation using pH gradient methods.
For a detailed discussion of method development using
pH gradients please reference application note “Method
development for pH gradient analysis of monoclonal antibodies
using a 3 µm monodisperse particle strong cation exchange
chromatography column”.²
Product manual thermofisher.com/propac 13

SCX chromatography
applications Continued
Optimized pH gradient method
For pH gradients, the pH range over which the separation occurs
is the primary method parameter requiring optimization. The
gradient time and flow rate can then adjusted to fine tune the
separation and minimize run time. We provide here in Figure 8
an optimized method using a 5 min gradient at 0.3 mL/min for
fast separation of NISTmAb charge variants. The high flow rate
Column ProPac 3R SCX, 3 µm
Format 2 × 50 mm
Mobile phase A: 1×, CX-1 buffer A pH 5.6
B: 1×, CX-1 buffer B pH 10.2
Flow rate 0.3 mL/min
Injection 1 µL
Temp 30 °C
Detection UV, 280 nm
Sample NISTmAb – 10 mg/mL
Gradient %A %B
Time (min)
-0.2 50 50
0.0 50 50
5.0 40 60
6.0 40 60
6.1 100 0
7.0 100 0
7.1 50 50
14.0 50 50
Figure 8: Enlarged view of chromatogram for NISTmAb analysis using an optimized 5 minute gradient at 0.3 mL/min flow rate
mAU
Time (min)
80
-1
0
02468
reduces gradient delay and column re-equilibration time while
the fast 5-minute gradient time elutes the protein and associated
variants over a short time-period. With this optimized method,
the high resolution and capacity of the ProPac 3R SCX column
provides narrow peaks with sufficient retention time separation to
detect the variants associated with NISTmAb.
Using the optimized 5-minute gradient method shown in Figure 8,
the performance of three different lots of media were compared to
evaluate the column-to-column and lot-to-lot reproducibility of the
ProPac 3R SCX columns. Figure 9 shows excellent reproducibility
observed in this analysis. The ProPac 3R technology platform
made using monodisperse particles and precision-controlled
chemistry makes this possible giving the user confidence in their
separation with different lots of media.
14 Product manual thermofisher.com/propac

SCX chromatography
applications Continued
Figure 9: Zoomed-in view of chromatograms of three different lots
using optimized method with a 5-minute gradient at 0.3 mL/min flow
rate. Retention time of main mAb peak is normalized to aid comparison
of variant separation.
Time (min)
mAU
Lot 1
Lot 2
Lot 3
0.52 468
120
-20
0
pH gradient analysis on additional mAbs
The same approach of pH gradient optimization was applied to
four additional mAbs. Each method was optimized for mobile
phase composition and sample loading using a flow rate of
0.3 mL/min to achieve fast variant analysis with a total method
time of 14 minutes using a linear pH gradient. For each mAb
evaluated, initial and final gradient values for %B of CX-1 pH
gradient buffers, are provided in Table 7. Figure 10 demonstrates
excellent mAb-variant separation for each mAb using the
ProPac 3R SCX 2 × 50 mm column with a simple pH gradient
over 5 minutes using CX-1 gradient buffers at 30 °C.
General mAb gradient for 2 × 50 mm
Mobile phase A: 1x CX-1 buffer A pH 5.6
B: 1x CX-1 buffer B pH 10.2
Flow rate 0.3 mL/min
Temp 30 °C
Gradient %B (Table 7)
Time (min)
-0.2 Initial
0.0 Initial
5.0 Final
6.0 Final
6.1 0
7.0 0
7.1 Initial
14.0 Initial
Table 7: Gradient parameters for analysis of
mAbs using pH gradient
mAb Initial
%B
Final
%B Concentration Inj vol.
(µL)
NISTmAb 50 60 10 mg/mL 1.0
Infliximab 24 44 5 mg/mL 3.0
Pertuzumab 36 51 5 mg/mL 1.5
Vedolizumab 23 38 5 mg/mL 1.5
Secukinumab 27 47 5 mg/mL 1.5
Product manual thermofisher.com/propac 15

For Research Use Only. Not for use in diagnostic procedures. © 2023 Thermo Fisher Scientific Inc. All rights reserved. All
trademarks are the property of Thermo Fisher Scientific and its subsidiaries unless otherwise specified. PEEK is a trademark of Victrex
USA, Inc. This information is presented as an example of the capabilities of Thermo Fisher Scientific products. It is not intended to
encourage use of these products in any manner that might infringe the intellectual property rights of others. Specifications, terms and
pricing are subject to change. Not all products are available in all countries. Please consult your local sales representative for details.
MAN-IS-006-EN 0323
Learn more at thermofisher.com/propac
02468
024 6
Time (min) Time (min)
NIST
Infliximab
Pertuzumab
Vedolizumab
Secukinumab
mAU
mAU
NIST
Infliximab
Pertuzumab
Vedolizumab
Secukinumab
8
-10
100
-10
110
-10
110
-10
100
-10
80
-10
30
-10
30
-10
30
-10
30
-10
30
Figure 10: Analysis of mAbs on a 2 × 50 mm column using the general mAb gradient detailed in Table 7. Left chromatogram shows the full
signal range with the right chromatogram showing the detailed view of the mAb variants.
Reference
1. Olivares, R., Bechler, S., Thermo Fisher Scientific Application
note AN001694, Salt gradient analysis of monoclonal
antibodies using a 3 µm monodisperse SCX chromatography
column (2023), Thermo Fisher Scientific, Sunnyvale, CA, USA
2. Olivares, R., Bechler, S., Thermo Fisher Scientific Application
note AN001814, Method development for pH gradient analysis
of monoclonal antibodies using a 3 µm monodisperse particle
strong cation exchange chromatography column (2023),
Thermo Fisher Scientific, Sunnyvale, CA, USA
/