User Guide | Danfoss Gas Detection - PC tool
4 | DKRCI.PS.S00.C1.02 | 520H12961
© Danfoss | DCS (MWA) | 2018.06
4
Main window with short
description (continued)
Parameters has four submenus:
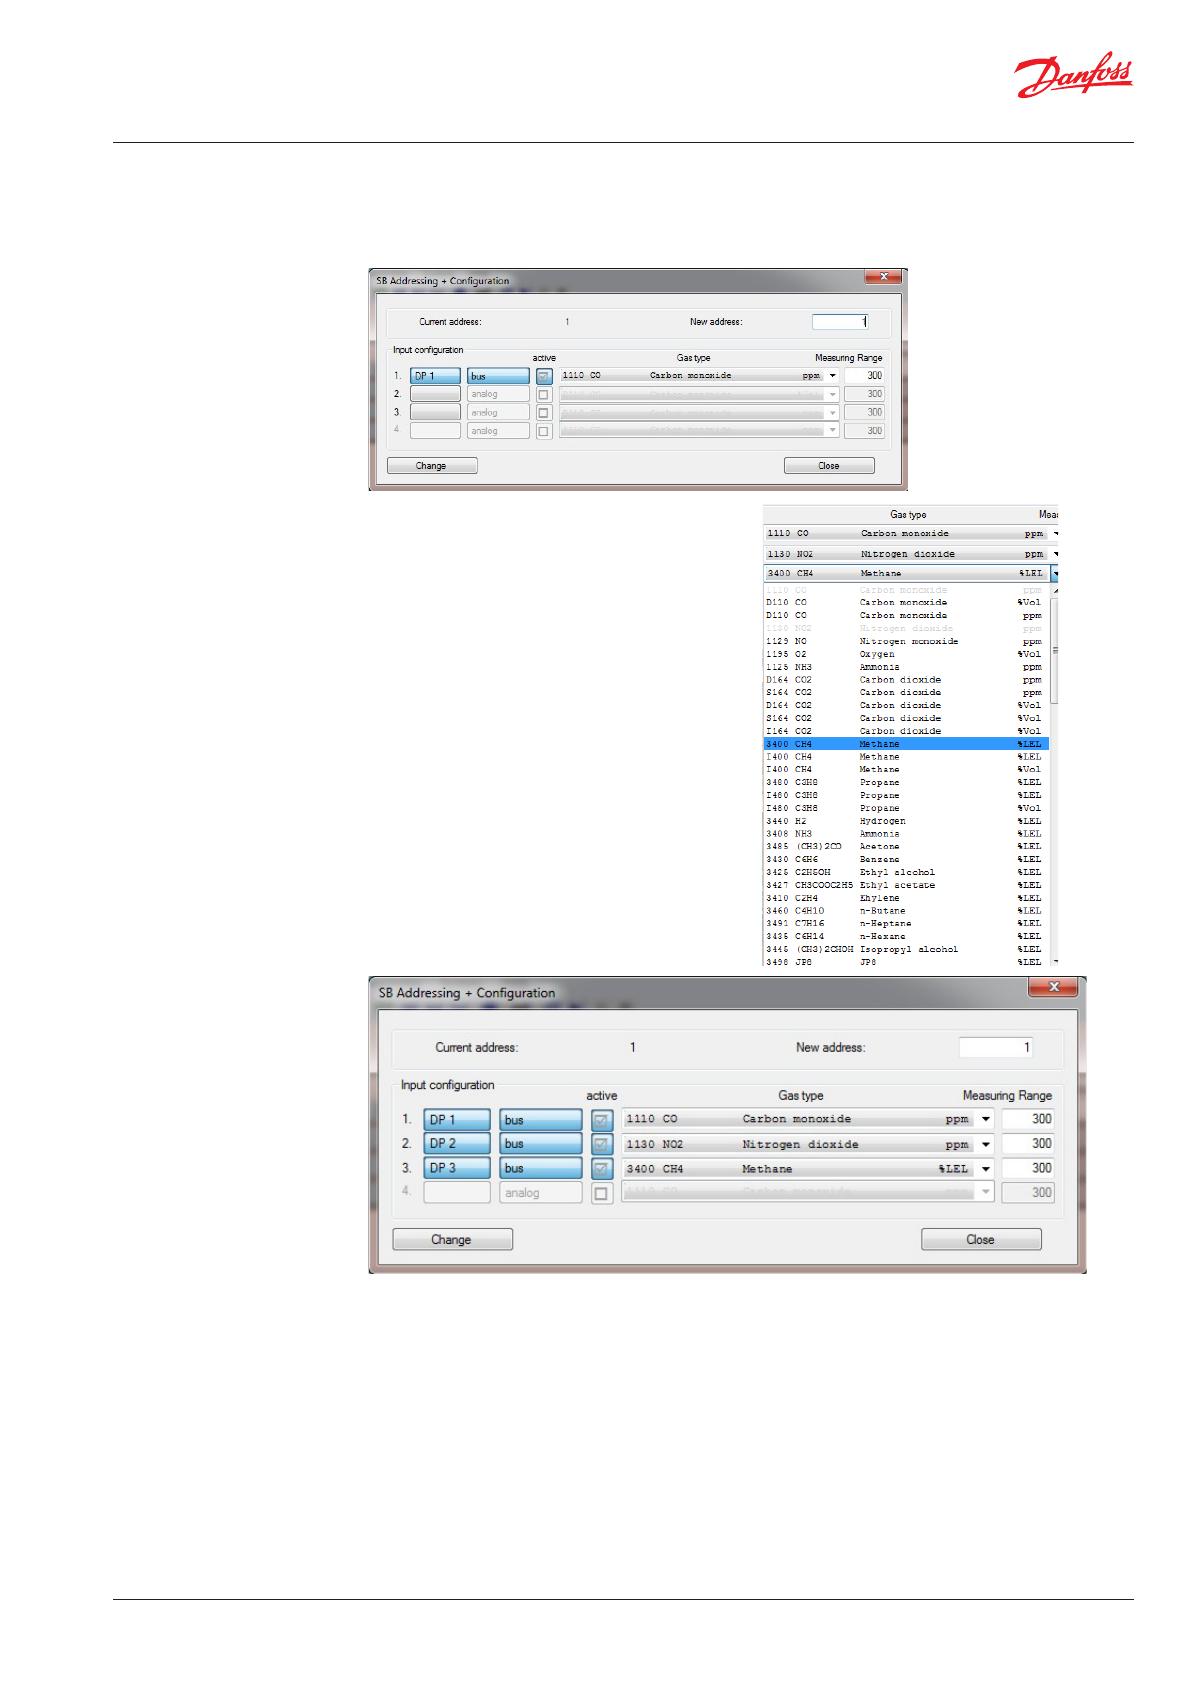
Addressing opens the dialog for setting the
address of the connected device.
The
icon on the toolbar stands for this menu
item.
MP Parameters opens the dialog where you can
manage the settings for the single measuring
points in the gas detection system.
The
icon on the toolbar stands for this menu
item.
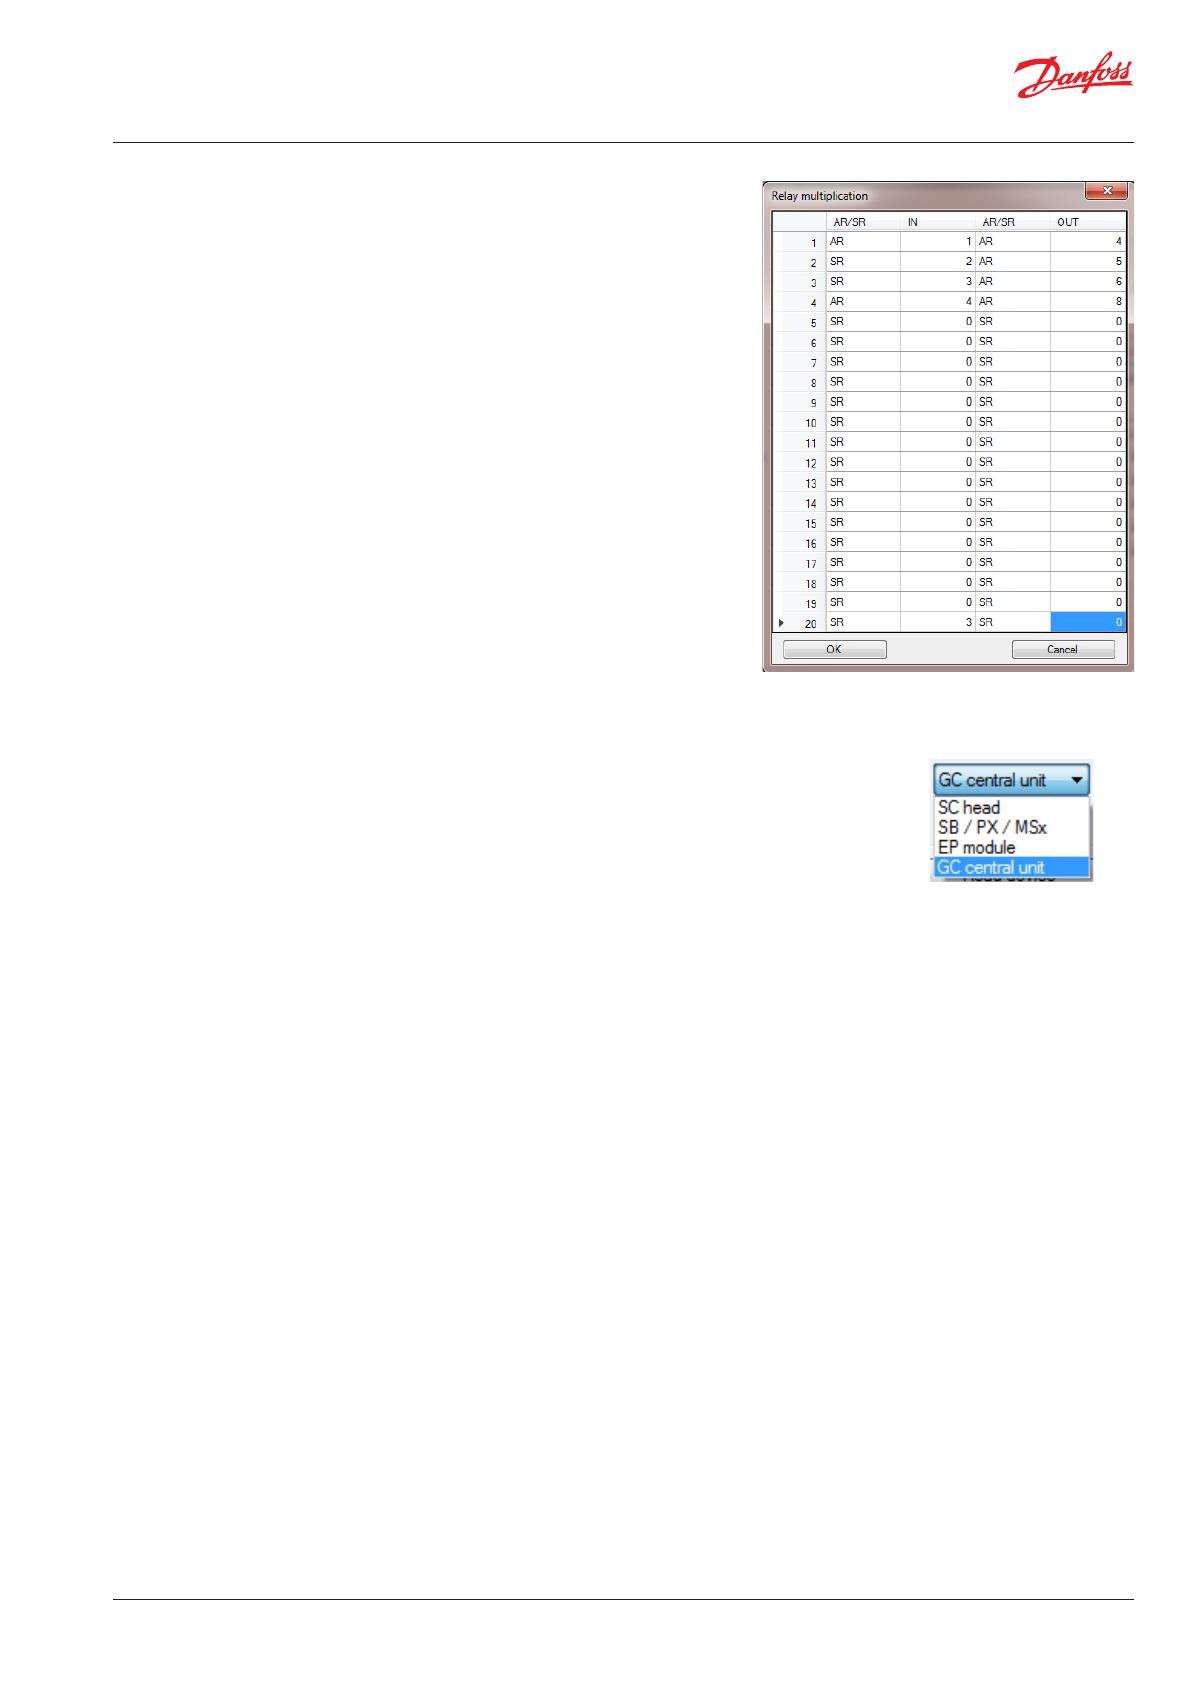
Relay Parameters opens the dialog where you can
manage the settings for the single relay outputs
in the gas detection system.
The
icon on the toolbar stands for this menu
item.
System Parameters opens the dialog where you
can manage the system parameters of the gas
detection system.
The icon on the toolbar stands for this menu
item.
The menu items are only active if the connection
to the gas detection controller or gas detection
unit is established. The functions are specified in
the following chapters.
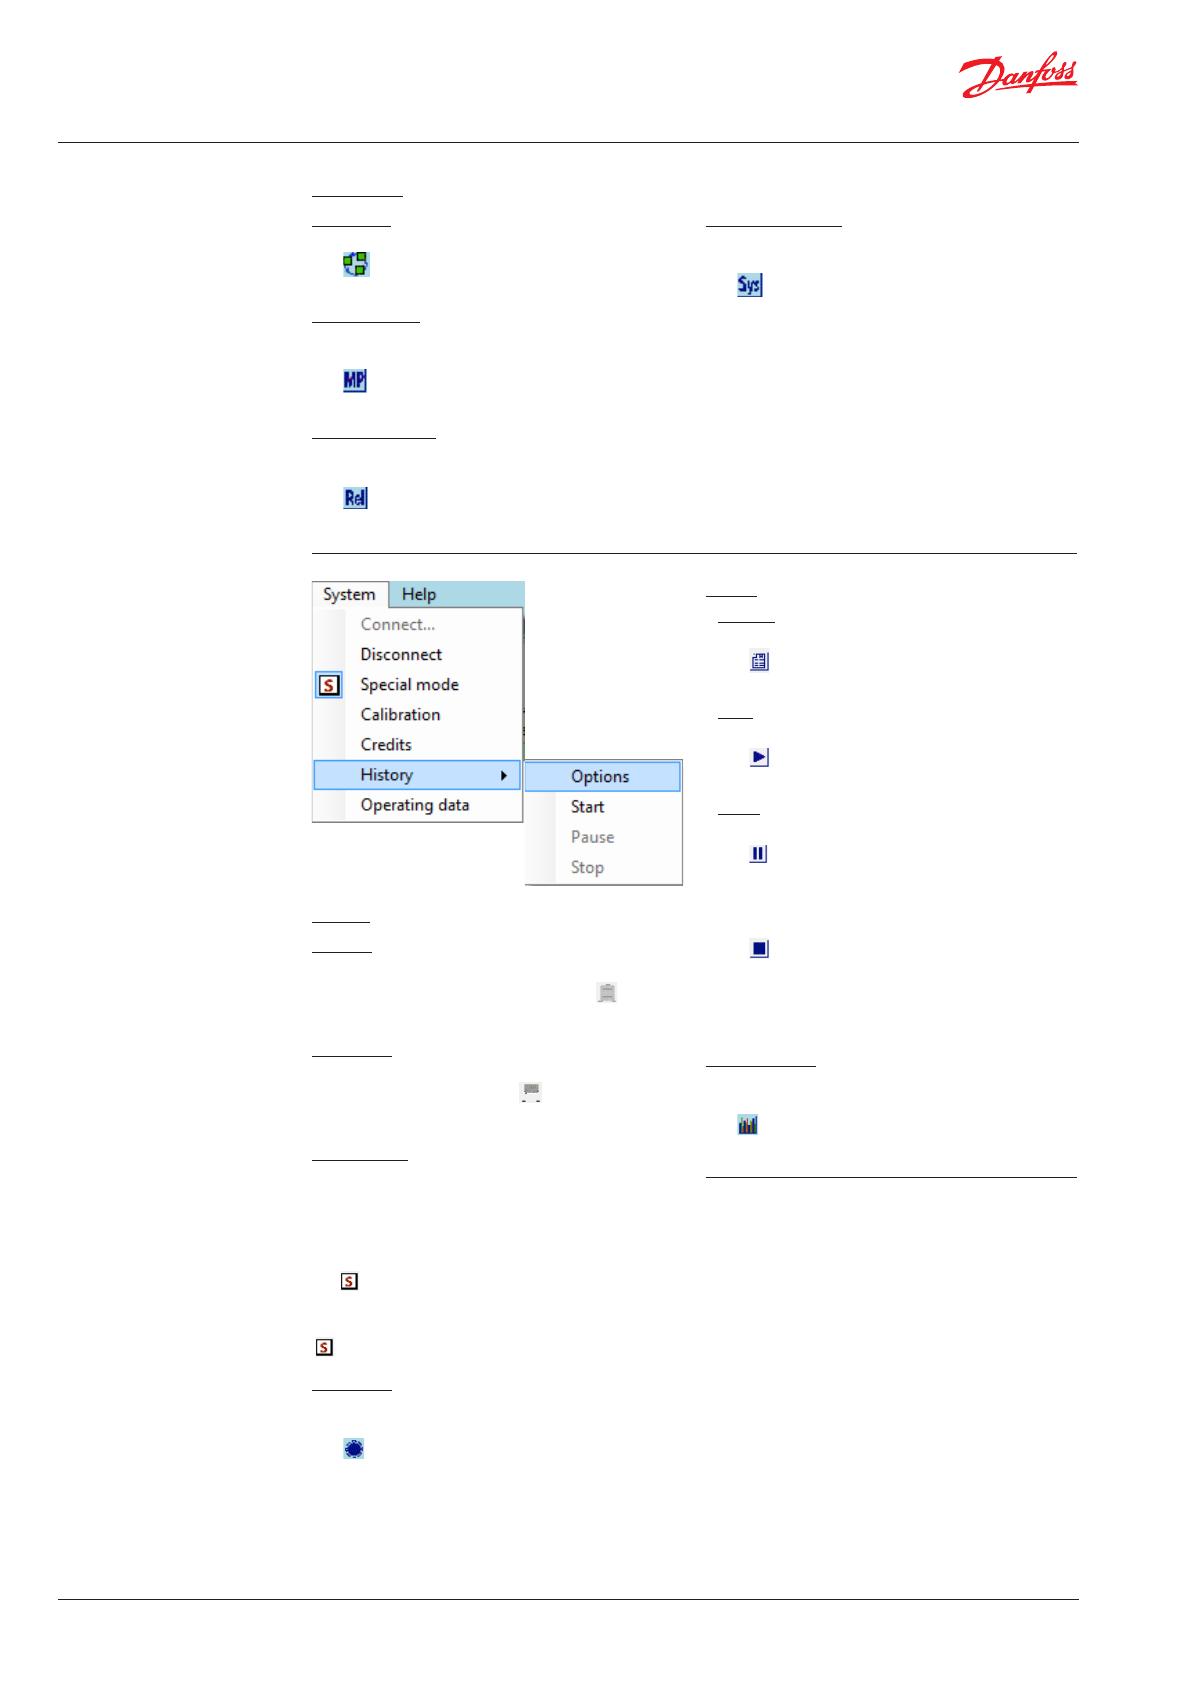
System has seven submenus:
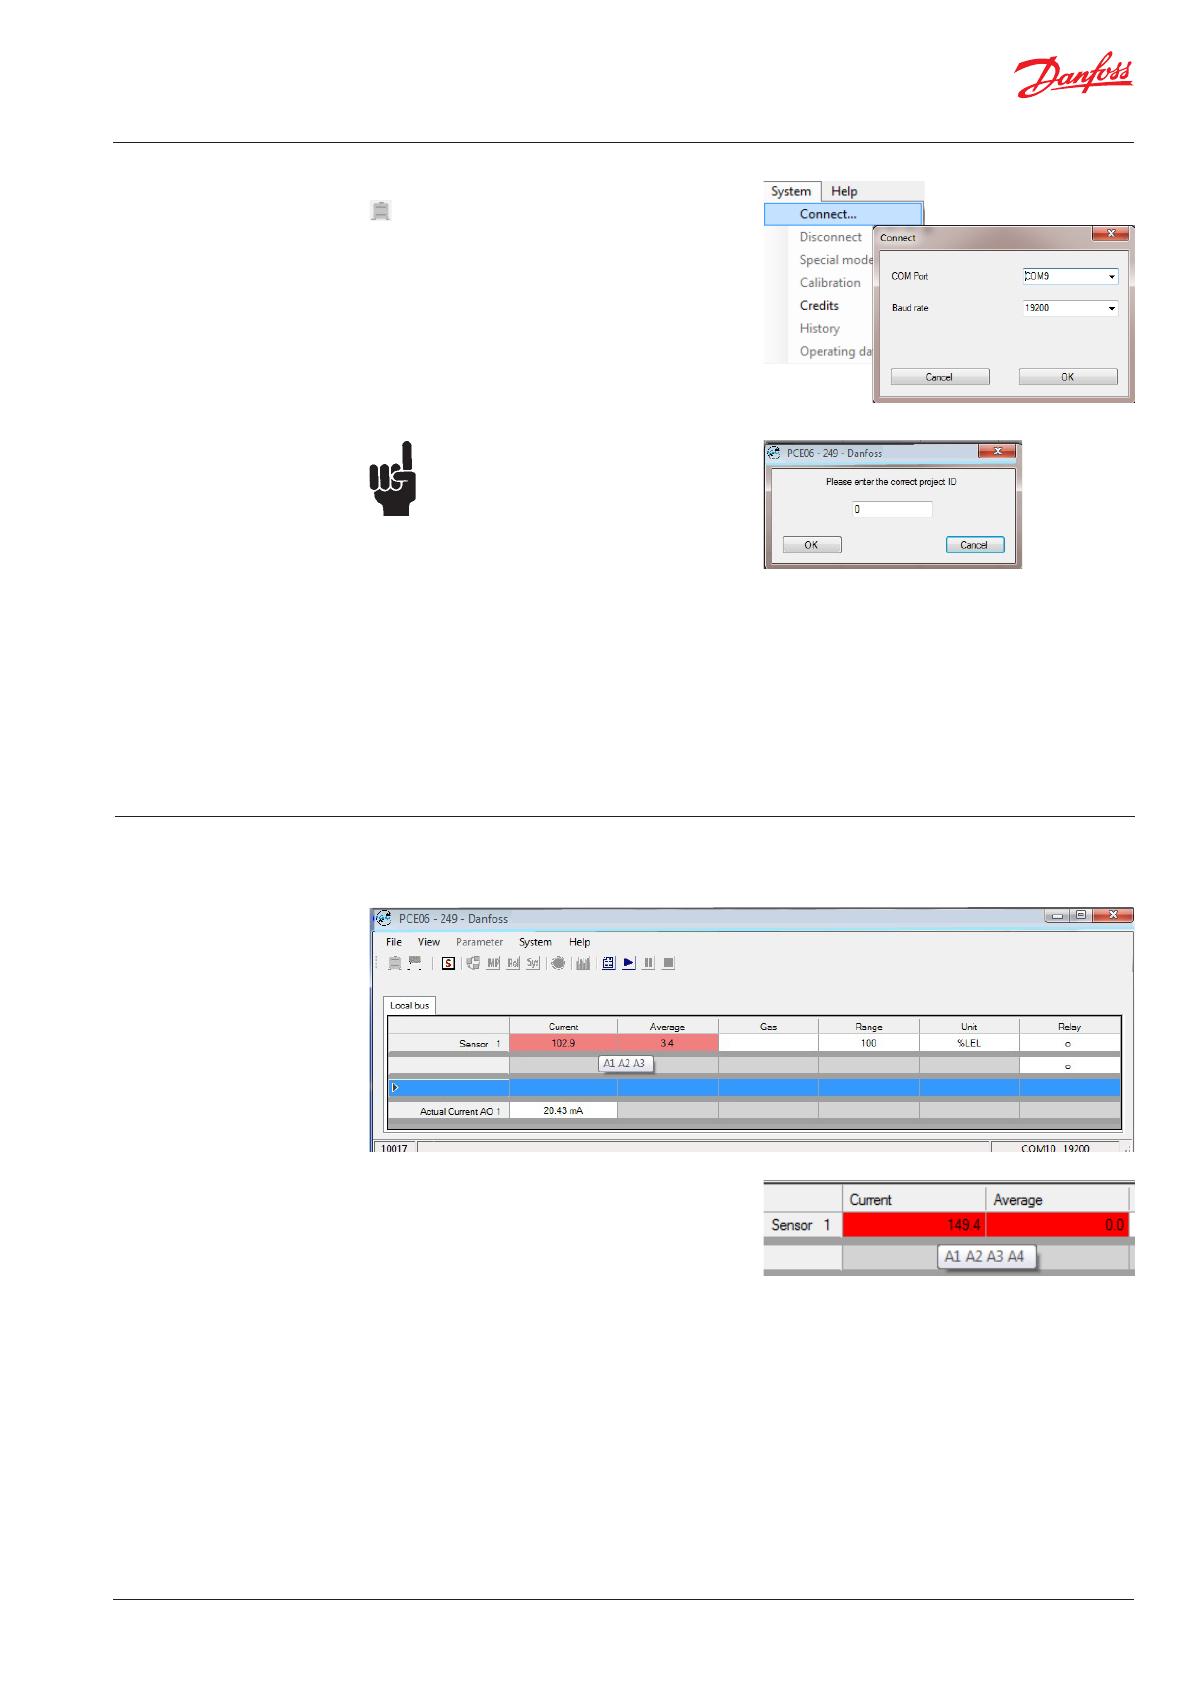
Connect opens the dialog where you can set the
serial COM port.
You can also access this dialog via the
icon on
the toolbar.
Disconnect does not open a new dialog window,
but interrupts the connection to the COM port.
It is also possible to use the
icon on the
toolbar to cut the connection.
Special mode does not open a dialog window
either, but sets the connected device into special
mode. If activated again, the special mode
is cancelled and the device will return to the
measurement mode.
The special mode can be switched on or off with
the icon on the toolbar.
If the device is in special mode, the colour of the
menu bar and toolbar changes to blue and the
icon will be displayed in the system menu.
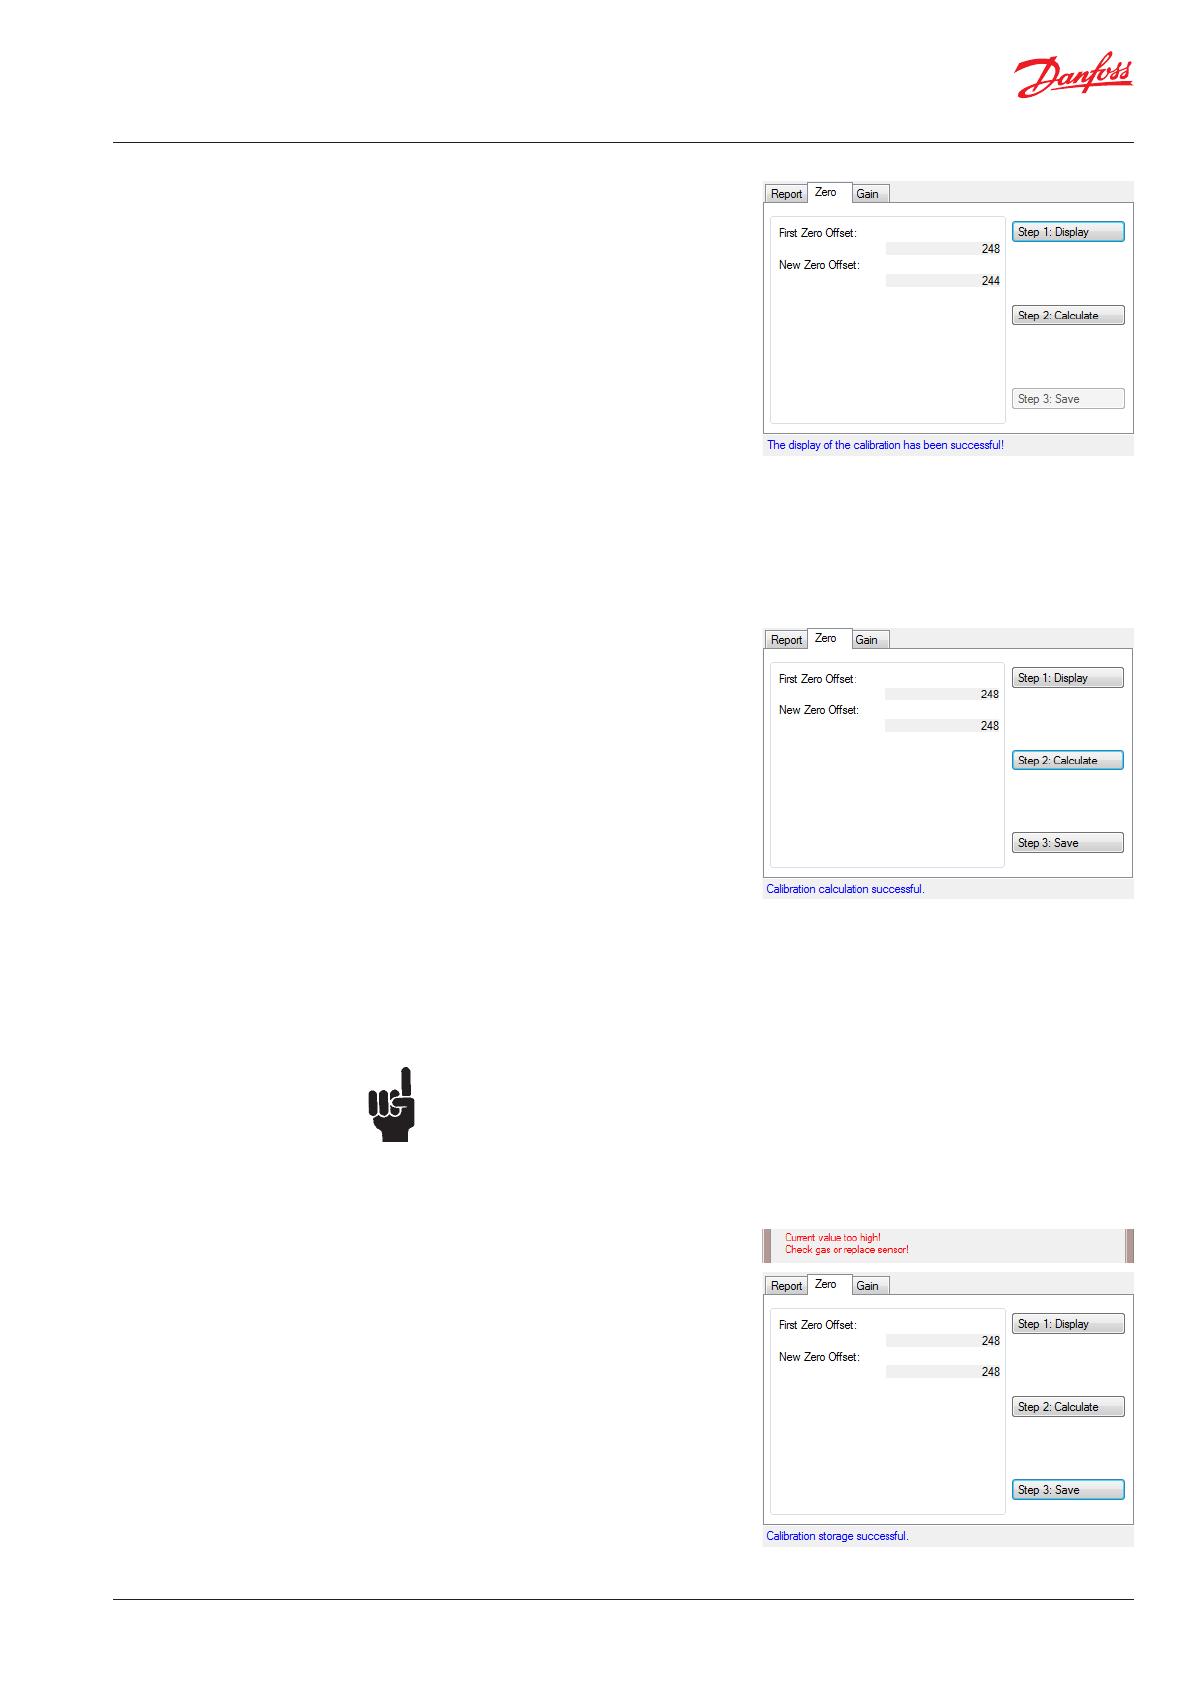
Calibration opens the calibration dialog. The
functions of this window are specified in detail
later.
The
icon on the toolbar stands for this menu
item.
History contains four submenus:
Options starts the history dialog where you can
change all settings for data recording.
The icon on the toolbar stands for this menu
item.
Start - with a click on the start button the
recording is started.
The icon on the toolbar stands for this menu
item.
Pause - with a click on the pause button the
recording is interrupted.
The icon on the toolbar stands for this menu
item.
Stop - with a click on the stop button the
recording is stopped.
The icon on the toolbar stands for this menu
item.
The functions of the history window are
described in detail later.
Operating data opens the operating data dialog.
The functions of this window are described in
detail later.
The icon on the toolbar stands for this menu
item.
Under the toolbar, there is a system tray
displaying error messages concerning the
communication with the connected device.
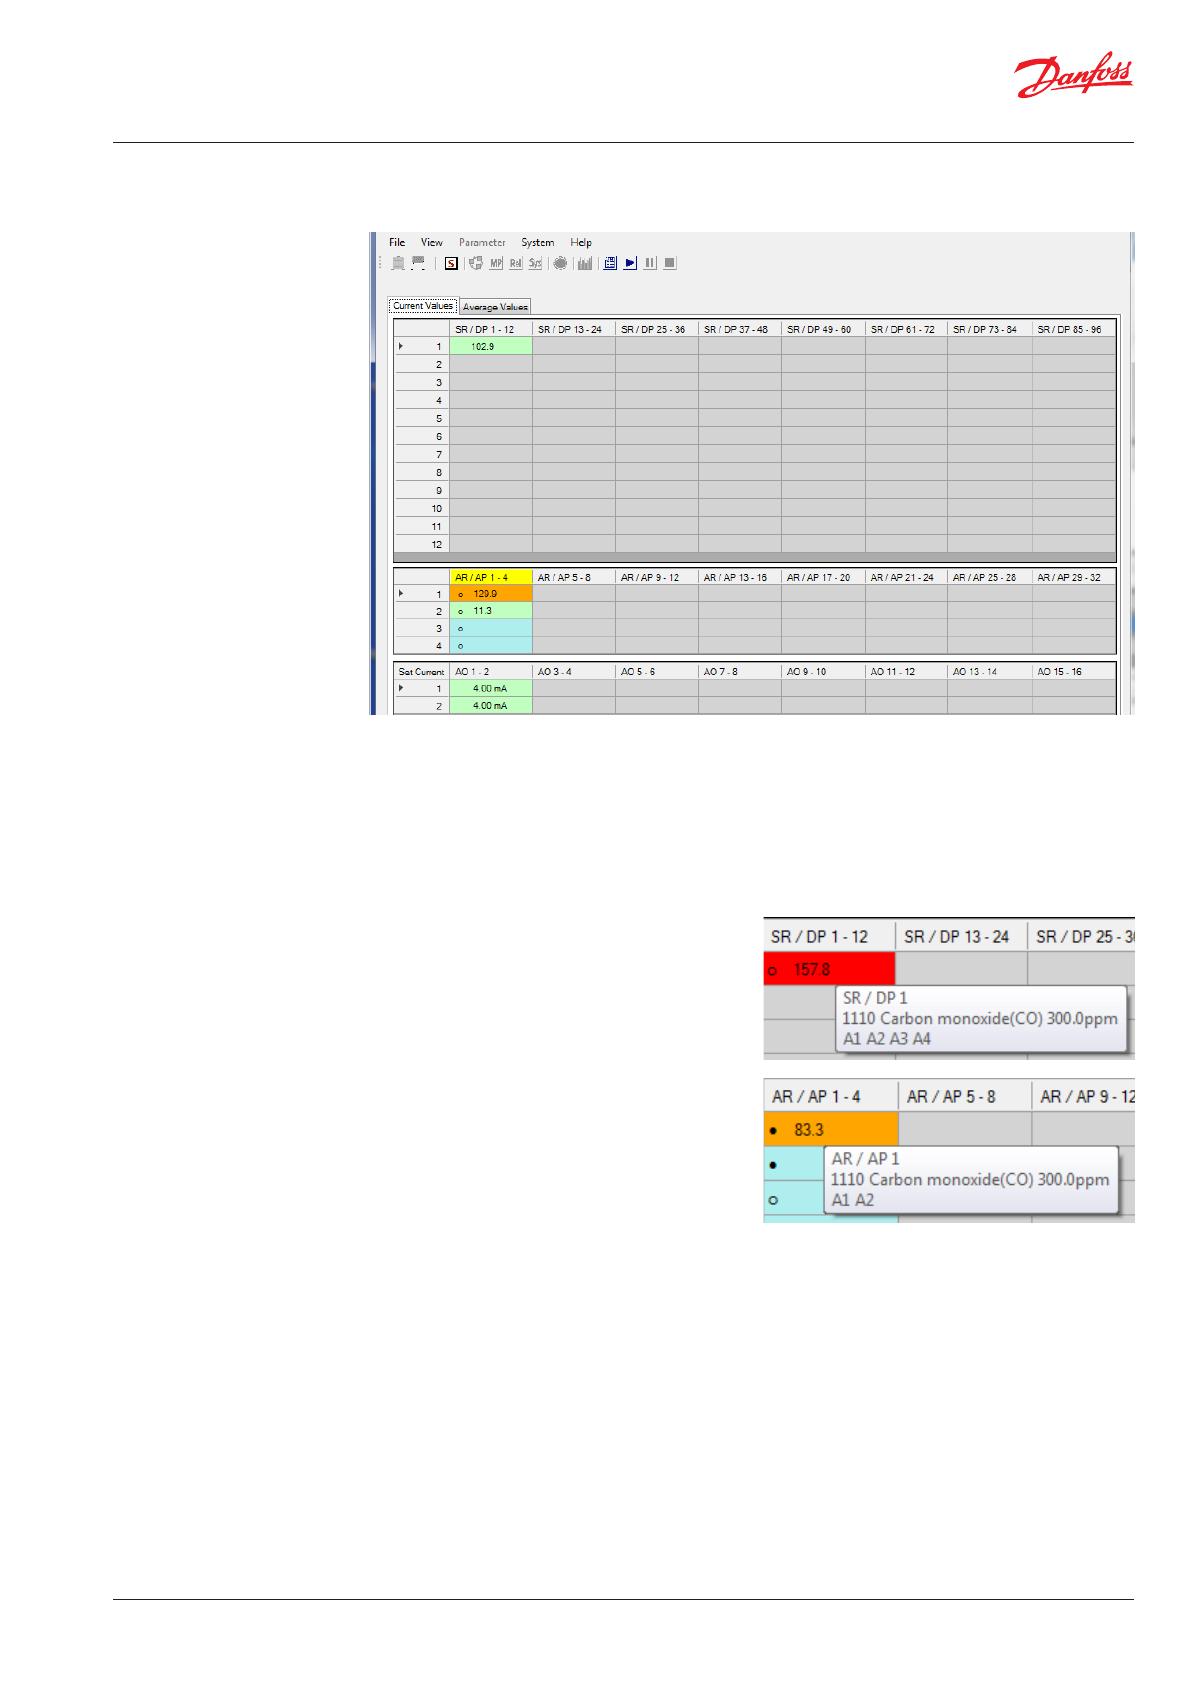
The middle section of the main window varies
according to the connected device. This is
described in detail later.
At the very bottom of the status bar the following
information is displayed:
Software version of the master
The system tray where currently only the
information on the history is displayed.
Connected COM port with baud rate.


