Page is loading ...

www.sensirion.com - Sensirion AG, Laubisrütistr. 50, 8712 Stäfa/ZH, Switzerland
Operating Guidelines
for Liquid Flow Meter Kits
For SF06 based Liquid Flow Meters
Version 1

Operating Guidelines for Liquid Flow Meter Kits
www.sensirion.com Version 1 – D1 – June 2019 page 2/18
Table of Contents
1 Introduction ............................................................................................................................................3
2 Getting Started .......................................................................................................................................4
2.1 PC Requirements ..............................................................................................................................4
2.2 Software Installation ..........................................................................................................................4
2.3 Connecting the Liquid Flow Meter to the PC .....................................................................................4
2.4 Connecting the Fluidic System to the Liquid Flow Meter ..................................................................5
3 Sensirion Viewer Software .....................................................................................................................6
4 Understanding Your Measurements .................................................................................................. 11
5.1 Liquid Flow Meter Operating Principle ............................................................................................. 11
5.2 Sensor Linearization ........................................................................................................................ 12
5.4 Monitoring Different Fluids ............................................................................................................... 12
5.5 Dispense Volume Measurement Correction .................................................................................... 12
5.6 Verify Sensor Performance .............................................................................................................. 13
5.7 Air-in-line Detection ......................................................................................................................... 14
5.8 Cleaning, Preventive Maintenance, and Storage Instructions .......................................................... 15
5 Frequently Asked Questions ............................................................................................................... 17

Operating Guidelines for Liquid Flow Meter Kits
www.sensirion.com Version 1 – D1 – June 2019 page 3/18
1 Introduction
The Sensirion liquid flow meters allow (ultra-)low liquid mass flows to be measured at low power consump-
tion and with a very fast response. The inert and biocompatible flow meters feature outstanding sensitivity
and a unique dynamic range. Moreover, they are fully calibrated, temperature compensated, and provide a
digital output signal. This can be accessed via Sensirion’s smart SCC1-USB Sensor Cable (included in all
kits) with serial communication. The liquid flow meter can be controlled from your PC with the supplied
Windows Sensirion Viewer Software.
2 Getting Started
Sensirion`s Liquid Flow Meter Kits contain the following components:
Evaluation Kit for SLF3x Series:
SLF3S-1300F liquid flow sensor
SLF3x mounting clamp to enable mechanical fixation of the sensor
SCC1-USB Sensor Cable with USB connector for plug-and-play to a PC
Adapter cable from 6-pin connector to 4-pin M8, 15 cm
Ribbon cable from 6-pin connector to pigtail, 30 cm
A set of fluidic connectors
Quick Start Guide
Evaluation Kit for the LD20 Series:
LD20-xxxx liquid flow sensors
Prototype connector block with 4-pin M8 connector for electrical connection
SCC1-USB Sensor Cable with USB connector for plug-and-play to a PC
Quick Start Guide
The kits offer an easy-to-use environment to implement high-end sensing technology in your laboratory
setup with data visualization and data collection that can be set up within a couple of minutes.
For detailed technical specifications of your liquid flow meter please see its specific datasheet.

Operating Guidelines for Liquid Flow Meter Kits
www.sensirion.com Version 1 – D1 – June 2019 page 4/18
2.1 PC Requirements
Windows 7, 8, or 10. Older Windows versions may not be compatible and are not recom-
mended.
One available USB port for communication
2.2 Software Installation
To install the Sensirion Viewer Software, please download the latest version from our website (www.sensi-
rion.com/file/usb-viewer).
After opening the installer file, select Run to begin the Installation Wizard and follow the instructions to allow
the viewer to install software on your PC
Please note: This software is copyrighted and intended exclusively for laboratory and demonstration purposes. It may not be
used or multiplied commercially. SENSIRION does not offer any warranty on Windows software features.
2.3 Connecting the Liquid Flow Meter to the PC
Connect the SCC1-USB Sensor Cable to a USB port of the PC
When plugging in the USB cable, the necessary Virtual Com-Port (VCP) driver should be in-
stalled automatically. After the driver has been successfully installed, the device appears in the
windows device manager as USB Serial Port. If this does not happen, please install the neces-
sary VCP driver manually from the original driver manufacturer: www.ftdichip.com/Driv-
ers/VCP.htm
Connect the SCC1-USB Sensor Cable to the sensor. Depending on the sensor type you may
have to use the adapter cable.
Your liquid flow meter is now connected with your PC and ready to use.

Operating Guidelines for Liquid Flow Meter Kits
www.sensirion.com Version 1 – D1 – June 2019 page 5/18
2.4 Connecting the Fluidic System to the Liquid Flow Meter
Depending on the selected liquid flow meter type, a basic set of fluidic connectors may be included in your
Liquid Flow Meter Kit. If other connectors are needed, we recommend purchasing them through fluidic
connector manufacturers such as Idex (www.idex-hs.com), Vici (www.vici.com), or Nordson Value plastics
(www.valueplastics.com). For details, consult the Application Note Sensor Ports and Tubing Connections
at www.sensirion.com/download-center.
Use caution to avoid overtightening of the fluidic fittings that could create a leak path. Finger tight is gener-
ally acceptable if not otherwise specified in the sensor’s datasheet. Follow the recommendations of the
fluidic connector manufacturer for the given fittings you work with.
We highly recommend using inlet tubing equal to or larger than sensor’s flow channel inner diameter (ID),
otherwise turbulences may affect the sensor performance at higher flow rates (the sensor datasheet con-
tains flow channel ID information for your reference).
The sensor should be installed in a fixed horizontal position for best performance. However, if the sensor
is mounted vertically it will also perform very well but may present an offset (for details see the mounting
orientation sensitivity specification in the sensor’s datasheet). Keep fluid temperatures within 3 degrees of
the sensor temperature for best performance and preferably use dispense durations of at least 500 ms for
best accuracy.
Finally, please note that many pumps deliver pulsatile flow where peak values may significantly exceed
average flow values. Your flow meter may crop data prematurely if the peak flow rate is too high and satu-
rates the sensor. Verify peak flows against maximum rated flow of the sensor. You can also try dampening
the flow to reduce peak rates. Sometimes an additional length of flexible tubing along with a restriction will
suffice.

Operating Guidelines for Liquid Flow Meter Kits
www.sensirion.com Version 1 – D1 – June 2019 page 6/18
3 Sensirion Viewer Software
To start the USB/RS485 Sensor Viewer, double click its icon. When the “Product Selection” pop-up window
appears, first select “RS485 Sensor Cable” under “COM Hardware” followed by the “Sensor Product” with
the selection “Liquid Flow Sensor (SF06 Chip)”.
Default “COM Port Settings” and “RS485 Device Settings” are
generally recommended for liquid flow meters. If you cannot
communicate with the sensor, try selecting a different COM
port so that “USB Serial Port” appears next to your COM port
setting as shown in the screenshot to the right.

Operating Guidelines for Liquid Flow Meter Kits
www.sensirion.com Version 1 – D1 – June 2019 page 7/18
Once the connection has been set up, the USB/RS485 Sensor Viewer main window will appear:
From the main window a wide variety of functions can be accessed. The main window functions are de-
scribed below:
1) Measurement Control:
Run: Starts the measurement. In the default setting you will see the sensor’s response graphically dis-
played as a running green line that rises and falls with the flow rate.
Stop: Stops the measurement. For many functions on the main screen you will need to stop the current
measurement before making changes. Also stop the measurement before disconnecting the sensor or the
SCC1-USB Sensor Cable.
Type of Measurement: Choose from:
Flow [Linearized]: This is the most common setting. It accesses the active calibration field stored
on the sensor chip to provide a linear response to changes in flow.
Temperature [Linearized °C]: You may access the temperature reading on board of the sensor
chip. This is neither a direct measurement of the fluid nor a measurement of ambient conditions. It is
a combination of the two (and on-chip electronics) that provides a coarse temperature reading near
the flow measurement location.

Operating Guidelines for Liquid Flow Meter Kits
www.sensirion.com Version 1 – D1 – June 2019 page 8/18
Signaling Flags: There are two signaling flags for failure mode detection which can be displayed
using the USB/RS485 Sensor Viewer. The Air-in-Line and the High Flow flag, report if an air-in-line
or high flow event occurred at least once since the last readout took place. An air-in-line condition is
displayed as a “1” and a high flow condition is displayed as a “2”. If both conditions occur simultane-
ously this is hence displayed as “3”. Whereas steady flow is displayed as “0”. For more detailed
information please refer to the respective sensor datasheet.
Note that it is not possible to view the data of multiple measurement types in the graph at the same
time. However, for sensors based on the SF06 chip, when logging the measurement to a file, the
flow measurement, the temperature measurement and all available signaling flags are saved to the
file.
Sampling Interval [ms]: The sampling interval setting determines how often the viewer will read the data
from the sensor. When it is set to 0 the data is captured at the fastest speed possible (2 kHz). This can
exceed the capability of the PC and cause gaps in the captured data which will be visible as interruptions
in the graph. Typically, 5 ms is a good starting point for tests. The measurement is internally averaged by
the sensor until read out. For details, refer to the datasheet of the specific sensor.
Timing Information: Default setting of “Relative” is generally preferred. This means data files saved will
show initial reading taking place at time zero and every reading thereafter incrementally increasing by sam-
pling time (or averaging time determined by bit resolution, whatever is larger). When “Absolute” is selected
the actual time at measurement (according to the PC clock) is inserted instead. Either setting has no effect
on real time graphical representation of the flow rate in the Viewer main window.
2) Product Setting Options:
Product ID: Displays the Sensirion sensor model name. Not user adjustable.
Serial Number: Displays Sensirion serial number which is unique to each flow meter. Not user adjustable.
Interface: Displays existing communication link (typically RS485 for liquid flow meters).
FW Version: Displays current RS485 cable firmware version for reference.
I2C Address: Displays flow meter I2C address for reference. Not user adjustable. When integrating flow
sensors in custom software, customer will set RS485 cable addresses not the flow sensor I2C address.
Supply Voltage: Displays the flow sensor’s supply voltage. Not user adjustable.
Unit: Displays the flow sensor’s physical unit of measurement. Not user adjustable.
Scale Factor: The scale factor is a number used by the viewer software to convert linearized flow data into
units of flow (such as mL/min or mL/h). Flow in physical units is equal to linearized flow data (2 byte integers)
divided by the scale factor. The scale factor is accessed from flow meter memory and is generally the same
within a sensor model for a given fluid. However, Sensirion may modify this value in production to meet

Operating Guidelines for Liquid Flow Meter Kits
www.sensirion.com Version 1 – D1 – June 2019 page 9/18
product specifications. The viewer software automatically displays the physical flow units if “Flow [linear-
ized]” is chosen as measurement mode. The scale factor is not user adjustable.
Command (HEX): Sensirion’s liquid flow sensors contain multiple calibration fields for different types of
liquid (such as water or IPA on the SLF3x Series) or allow for different measurement modes to be executed.
This field allows to enter specific I2C commands as specified in the sensor’s datasheet. The standard setting
0x3608 will start the continuous measurement mode for water.
3) Data Logging:
Select File: By default, the Viewer Software will save to a “DataLog.csv” file in your Temp folder. This
button allows you to select a different folder location or edit the file name. You may also type this information
directly into the field next to the “Select File” button.
Start Logging: Select this button to save data on your computer. Once you have started logging, you must
also press “Run” to start measurements otherwise the data file will be empty. You have the option to pause
data collection and resume saving to the same data file. Or you can stop logging as described below.
Stop: Stops logging of data on to data file. You may resume data collection by either writing to a new file
or overwriting the existing file.
4) Measurement Graph:
Flow Rate: The display shows the real time flow rate measurement of the flow meter, averaged over and
updated every 500 ms.
Measurement Filter: Select the filter type (‘No Filter’ or ‘Average’) as well as the number of samples to be
used for the filter. The ‘Average’ filter is a simple moving average over the number of samples selected.
The averaged flow signal is displayed as a blue line in the graph.

Operating Guidelines for Liquid Flow Meter Kits
www.sensirion.com Version 1 – D1 – June 2019 page 10/18
Totalizer: Use this tool for a simple volume measurement by integrating the flow rate over time.
‘Start’ starts the volume integration, ‘Stop’ stops the volume integration and ‘Reset’ resets the volume to
zero.
Hold Display Graph: Selecting this checkbox turns off the real time display of flow events on the graph
window.
Show X-Axis: Selecting this shows values for time on the X-Axis of the graph. If timing was previously set
to “Relative”, scale will start at zero with first data measurement. If set to “Absolute”, scale will show real
time in the format [hh:mm:ss:ms].
Show Data Points: Selecting this check box displays the individual data points.
Autoscale: Automatically scales the display graph to current measurement values.
Effective Sampling Time: Shows sampling rate currently used by flow meter.
Flow Graph and Zoom Level: Place your pointer over the graph and use your mouse scroll wheel to zoom
in or out. You can also click and hold a region of interest to zoom into when you release. Right-click of the
mouse will allow you to reset the zoom level.

Operating Guidelines for Liquid Flow Meter Kits
www.sensirion.com Version 1 – D1 – June 2019 page 11/18
4 Understand your Measurement
4.1 Liquid Flow Meter Operating Principle
Sensirion’s highly advanced CMOSens® technology combines all associated electronics from signal con-
ditioning circuitry to calibration memory and MEMS micro heater structure on a single integrated CMOS
chip. The extremely compact chip creates a small thermal mass for very fast responses and consumes
very little power. The chip is bonded to the outside of the flow channel and due to its media isolated sens-
ing principle, there is no direct contact between the digital microchip and the fluid. Measurements are
taken through the flow channel wall.
Your Sensirion liquid flow meter operates on a microthermal sensing principle. A negligible amount of heat
is introduced to the fluid and monitored to correlate temperature differentials to actual flow. Temperature
sensors before and after the heater detect temperature changes as flow transfers heat from one side to
another. The illustration below highlights the temperature profile during flow:
Fluid thermodynamic properties (i.e., heat capacity, thermal conductivity) will directly affect sensor re-
sponse. The standard sensor calibrations for H2O and IPA cover most commonly used fluids.
It is important to maintain laminar flow within the capillary during measurements. The flow meter maximum
flow ranges have been specified having this in mind. Use inlet tubing with the same inner diameter or larger
than the sensor’s capillary inner diameter. More viscous fluids reduce turbulence although one must use
caution to avoid exceeding the recommended pressure limits of the flow meter (see the datasheet for spec-
ifications of recommended maximum operating pressure and burst pressure).

Operating Guidelines for Liquid Flow Meter Kits
www.sensirion.com Version 1 – D1 – June 2019 page 12/18
4.2 Sensor Linearization
Sensirion liquid flow meters are 100% factory calibrated for at least one standard fluid (typically H2O or
IPA). Most sensors are also bidirectional allowing for flow measurements in both directions of flow.
Exceeding the flow range will not damage the sensor or stress components that will affect calibration. Flow
meters typically respond linearly up to about 10% beyond the specified maximum flow range before satu-
rating. Reference your specific sensor datasheet for more information.
4.3 Monitoring Different Fluids
Your Sensirion flow meter can be used to monitor fluids not originally calibrated at the factory. Select a
standard calibration field that most closely matches your fluid. For example, water calibration for saline
solution or hydrocarbon calibration for lubricant oil (a matching calibration field increases the possibility of
a linear response from the sensor).
Regardless of the fluid, your flow meter is capable of very high repeatability. Typical error range is 0.8% to
1.5% for all media. This allows you to use the sensor as a very precise relative gauge when flow is required
to stay within an acceptable range. In such a case, sensor response can be recorded at maximum and
minimum flow rates and used as upper and lower guard bands for reference. The flow meter can then
monitor process repeatability within verified acceptable limits. Since absolute values may vary from sensor
to sensor, this guard band must be set for each individual flow meter.
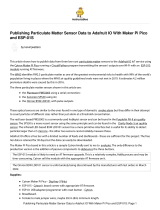
4.4 Dispense Volume Measurement Correction
Some applications require not only great repeatability but also high accuracy that tightly correlates sensor
readings to actual flows. This is particularly true for dispense applications. The following procedure can
significantly improve accuracy when monitoring liquids which have not been originally calibrated at the
factory.
Please note the volume correction steps below require fixed flow rates during the dispense event. If the
dispense flow rate is changed then the process below should be repeated with the new dispense flow rate
to ensure accuracy. The intention below is to compare actual vs. dispensed volumes calculated from sensor
readings and to apply a simple correction factor to adjust for accuracy.
Program your pump to the flow rate you intend to use during your actual dispense process. In
the example below, 1000 µL/s was the fixed flow rate chosen.
-2
-1
0
1
2
-2 -1 0 1 2
Sensor Output [µl/min]
Mass Flow [µl/min] (water)

Operating Guidelines for Liquid Flow Meter Kits
www.sensirion.com Version 1 – D1 – June 2019 page 13/18
Use the flow meter to measure several dispenses with varying dispense times. The range of
dispense times should be limited to the expected dispense times in your application.
For each dispense, also use a secondary measurement (such as measuring weight) to verify
actual dispense volume.
Plot the measured volume from sensor output vs. actual dispensed volume as in the example
below:
The data points should fit a straight line through the measured points allowing you to determine
the variables a and b from the formula below:
Implement the correction factors above in your software and repeat several dispense events
using dispense times within the range you tested to confirm accuracy against a secondary
measurement. If the readings match then you are ready to use the flow sensor.
If the collected data points show a non-linear behavior, you will likely need to reduce the dis-
pense flow rate. The next section will explain how to determine whether your preferred dispense
flow rate is a good match for the flow sensor you are testing.
4.5 Verify Sensor Performance
The steps below will help you evaluate whether a specific dispense flow rate is a good match for your
sensor when using a fluid not originally calibrated by the factory. Start by selecting a calibration (water vs.
IPA for example) that most closely matches your fluid. If you are unsure, try both calibration fields (if avail-
able): the data will show you what is best.
The intent is to compare several calculated vs. actually dispensed volumes using fixed dispense times and
varying flow rates.
Set a fixed dispense time (in the example below, 1 second was chosen). We recommend a
dispense time of at least one second for this exercise. Three seconds is usually a good choice.
It is not necessary to use dispense times that match your expected application dispense times.
Set your pump to the first of three dispense flow rates. We recommend starting with your ex-
pected dispense flow rate.
Using the fixed dispense time from above, collect dispense data and calculate volume. Also
verify actual dispensed volume through a secondary measurement such as weighing sample.
Repeat dispense and data collection (calculated & actual volumes) two more times with different
flow rates (try 50% higher flow and 50% lower flow).
Plot measured volume vs. actual dispensed volumes of all three dispenses:

Operating Guidelines for Liquid Flow Meter Kits
www.sensirion.com Version 1 – D1 – June 2019 page 14/18
If all three flow rates are a good match for the sensor the dispense data will lie on a straight line as shown
above.
Sometimes the higher flows will fall noticeably off the linear path. The maximum flow range of the sensor
has likely been exceeded for the particular liquid being evaluated. Reduce maximum flow rates and collect
data again. The maximum measurable flow for the unknown fluid being tested will correspond to the highest
linear data point on your plot. For example, in the plot below the top two dispense volumes are not linear
so their corresponding flow rates would not be recommended for the sensor tested.
If your plot is strongly non-linear, try a different calibration field and repeat the experiment. In rare cases, a
linear relationship is not possible and a higher-order interpolation must be used. Please contact Sensirion
for additional support.
4.6 Air-in-line Detection
Bubbles cause the flow rate measurement to drop to near zero flow rates when they pass through the flow
sensor. Since the measurement is made at a distinct location along the sensor’s flow channel, ideally one
should mount the sensor such that the sensor chip is positioned on top where a bubble is most likely to
travel and most likely to be detected.
Sensors based on the SF06 chip, provide a signaling flag that indicates when air is passing though the
sensor. This Air-in-Line flag can be viewed (alongside the High Flow flag) by choosing signaling flags as
the Type of Measurement (see chapter 3). For further detailed information on signalling flags please refer
to the datasheet.
Dispensed Volume
Measured Volume
Measured Volume
Dispensed Volume

Operating Guidelines for Liquid Flow Meter Kits
www.sensirion.com Version 1 – D1 – June 2019 page 15/18
The figure below shows the response of the flow rate measurement and the two signaling flags to a bubble
passing through the sensor. An air-in-line condition is displayed as a “1” and a high flow condition is dis-
played as a “2” in the Sensirion Viewer Software’s measurement graph. If both conditions occur simultane-
ously this is hence displayed as “3”. Whereas steady flow within the sensor’s measurement range is dis-
played as “0”. These are the decimal representations of the binary signalling flags: b001, b010, b011 and
b000.
4.7 Cleaning, Preventive Maintenance, and Storage Instructions
Your flow meter has been robustly designed for its intended application, however, it is also a sensitive
instrument that must be well cared for to maintain a high level of performance.
The basic rules are simple:
avoid letting fluid dry in the liquid flow meter
avoid strong mechanical shocks that could dislodge internal components or compromise the
fluidic seals.

Operating Guidelines for Liquid Flow Meter Kits
www.sensirion.com Version 1 – D1 – June 2019 page 16/18
Since the sensor relies on a thermal measurement principle through the wall of the capillary tube, one must
take precautions to avoid any build-up or deposits that could alter the thermal properties of the capillary
and thus influence the sensor’s reading.
Before storing the sensor, always drain the fluid, flush with cleaning agent. In most cases flushing with
distilled water, then acetone, and finally IPA will suffice. Then blow the senor dry with pressurized air. Sen-
sor plugs should be installed for storage. The cleaning agent (detergent, solvent, etc) should be chosen for
its effectiveness in removing the liquid media and compatibility with wetted materials.
Flow meters do not need periodic cleaning unless the medium has a tendency to leave deposits, or flow
meters have been disconnected from the fluidic path and not properly flushed. The residue left by the drying
fluids can alter sensor performance or even plug the capillary. You may try cleaning it by flushing with
acetone and IPA.
Never attempt to mechanically clean the sensor’s flow channel.
For details, consult the Application Note Cleaning and Clean Handling at www.sensirion.com/download-
center.

Operating Guidelines for Liquid Flow Meter Kits
www.sensirion.com Version 1 – D1 – June 2019 page 17/18
5 Frequently Asked Questions
Problem
Possible Cause
Possible Solution
No function at all,
software cannot find sensor
1. COM port not available
2. Windows operating system too
old
3. USB cable driver (Virtual COM
port) not installed correctly
1. Check if USB driver is provid-
ing a virtual COM port and use its
number.
Make sure all other programs us-
ing COM ports are closed.
Maybe it is necessary to reboot
the computer. Stop all programs
working with COM-ports.
2. Verify recent version of Win-
dows software is installed on
your PC.
3. Install virtual com port driver.
Flow signal of sensor is different
compared to reference
1. Sensor is saturated high
2. Fluid does not match reference
fluid of calibration; or wrong cali-
bration field is chosen
3. Reference not accurate.
4. Flow is pulsating with high fre-
quency
5. Little air bubble is caught in
sensor or at inlet of sensor
1. Reduce flow rates
2. When using media other than
the one the sensor is calibrated
for, the sensor output may signifi-
cantly change. Try a different cal-
ibration field. When using the
SCC1-Analog sensor cable, set a
different default calibration field
(“Edit default”, page 9).
3. Please check if reference is
working properly.
4. If the flow rate is pulsating
(e.g. due to pumping mecha-
nism) try to eliminate this, e.g. by
fluidic damping.
5. Flush the sensor.
Sensor output is inaccurate com-
pared to reference at higher
flows
1. Turbulence caused by small in-
let tubing relative to sensor capil-
lary inner diameter (ID)
2. Flow deviations by strong tub-
ing bends on inlet side
1. Use inlet tubing with inner di-
ameter at least as big as the sen-
sor’s capillary inner diameter.
2. Keep connection tubing on in-
let side straight.
Sensor output appears to have
drifted compared to readings
taken in the past
Deposits in capillary inner diame-
ter affecting performance.
Follow cleaning procedures pro-
vided in this document.
Flow signal out of range
Flow higher than calibrated flow
range or different medium than
the one the sensor is calibrated
for. For selecting the right flow
meter look at the peak flow rates
in your application, not at the av-
erage flow rates.
Check if type of medium and cali-
bration match. Try to work with
smaller maximum flows.
Signal not 0 at zero flow in cali-
brated mode.
1. Offset changed or differs be-
cause type of medium used and
calibration medium mismatch.
2. Depositions inside the sensor.
Offsets within the specifications
are normal (see datasheet). For
larger offsets please refer to

Operating Guidelines for Liquid Flow Meter Kits
www.sensirion.com Version 1 – D1 – June 2019 page 18/18
3. Mounting position not horizon-
tal. See datasheet.
cleaning procedures in this docu-
ment. Ensure zero-flow condition
in your fluidic system. Contact
Sensirion if the problem remains.
Flow signal shows unexpected
behaviour (e.g. fluctuations, in-
creasing/decreasing flow alt-
hough pump is working steadily)
Note: Sensor is highly sensitive
and fast. It may show effects
which have not previously been
observable.
Analyze the fluidic system in or-
der to understand the effects
monitored. In most cases the
sensor is just representing the re-
ality. Contact Sensirion for addi-
tional support. Please provide
flow data, graphs, and descrip-
tion of fluidic system set-up.
Flow signal changes although
static conditions apply.
There may be several causes,
such as change of physical prop-
erties of the medium or strong
temperature change, increasing
blockage of fluidic path, fluid sup-
ply, e.g. pump, not properly work-
ing, system leaking.
Make sure environmental condi-
tions and physical properties of
the medium don’t change. Check
fluidic path and fluid supply for
possible errors.
Strong signal noise
Vibrations in the fluidic system.
Make sure the fluidic system is
not influenced by mechanical dis-
turbances. Vibrations make the
fluid in the system move which is
obviously visible on the sensor
signal.
Headquarter and Subsidiaries
Sensirion AG
Laubisruetistr. 50
CH-8712 Staefa ZH
Switzerland
phone: +41 44 306 40 00
fax: +41 44 306 40 30
www.sensirion.com
Sensirion Korea Co. Ltd.
phone: +82 31 337 7700~3
info-kr@sensirion.com
www.sensirion.co.kr
Sensirion Japan Co. Ltd.
phone: +81 3 3444 4940
info-jp@sensirion.com
www.sensirion.co.jp
Sensirion China Co. Ltd.
phone: +86 755 8252 1501
info-cn@sensirion.com
www.sensirion.com.cn
To find your local representative, please visit www.sensirion.com/distributors
/