Page is loading ...

HDAQ2USB User Guide Version 1.3.docx 1/22 Baumer Hübner GmbH
29.07.2015/GP Berlin, Germany
HDAQ2USB User Guide Version 1.3

HDAQ2USB User Guide Version 1.3.docx 2/22 Baumer Hübner GmbH
29.07.2015/GP Berlin, Germany
Table of Contents
Page
1
Introduction ................................................................................................................................... 3
2
System Requirements .................................................................................................................. 3
3
Hardware ....................................................................................................................................... 3
3.1
Encoder Inputs................................................................................................................................ 4
3.2
Terminating Resistors ..................................................................................................................... 5
3.3
Power Supply .................................................................................................................................. 5
3.4
Pin Assignment ............................................................................................................................... 6
4
Signal Processing ........................................................................................................................ 7
4.1
Sine-wave Inputs ............................................................................................................................ 7
4.2
Square-wave Inputs ........................................................................................................................ 7
4.3
Digital Filtering ................................................................................................................................ 7
4.4
SSI Input ......................................................................................................................................... 7
5
PC Software ................................................................................................................................... 8
5.1
Graph Settings ................................................................................................................................ 8
5.1.1
Graph Settings Dialog .................................................................................................................... 9
5.2
Channel Settings ............................................................................................................................ 9
5.2.1
Channel Settings Dialog ............................................................................................................... 10
5.3
Zooming, Panning and Auto-scale................................................................................................ 11
5.3.1
Zooming ........................................................................................................................................ 11
5.3.2
Panning ......................................................................................................................................... 11
5.3.3
Auto-scale ..................................................................................................................................... 11
5.4
Frequency Domain Analysis ......................................................................................................... 12
5.4.1
FFT Settings Dialog ...................................................................................................................... 12
5.4.2
Panning in the time domain .......................................................................................................... 12
5.4.3
Zooming in the time domain ......................................................................................................... 13
5.5
Main Menu .................................................................................................................................... 13
5.5.1
File Menu ...................................................................................................................................... 13
5.5.2
Edit Menu ...................................................................................................................................... 13
5.5.3
Options Menu ............................................................................................................................... 14
5.6
Control Block ................................................................................................................................ 16
5.6.1
Zeroing .......................................................................................................................................... 16
5.7
Example Configuration ................................................................................................................. 17
Appendix A – Version History ....................................................................................................................... 18
Appendix B – SSI Data Block Configuration Examples ............................................................................. 19

HDAQ2USB User Guide Version 1.3.docx 3/22 Baumer Hübner GmbH
29.07.2015/GP Berlin, Germany
1 Introduction
What is the purpose of the HDAQ2USB?
What kinds of problems can be solved with it?
What capabilities does it have?
What are the prerequisites for using it?
The HDAQ2USB is a measurement and analysis device for industrial rotary encoders. It has a USB 2.0 PC
interface and can capture analog sine/cosine, square-wave and SSI encoder signals. It features integrated
digital signal processing hardware to calculate the encoder’s position and velocity information. The data is
displayed on the PC with a program that supports both 32 and 64-bit platforms. It can also be used to save
the data, and analyze it in the frequency domain.
2 System Requirements
A PC with following requirements is needed:
• Microsoft Windows XP or Windows 7
• USB 2.0 interface
• Minimum 512 MB of RAM (1GB recommended)
• Minimum 100 MB of free hard disk space
3 Hardware
The HDAQ2USB is an FPGA based measuring system, operating with an internal clock frequency of
64 MHz. There are 5 physical inputs, which have the following numbering order from left to right:
Input
4
:
HTL/TTL
Input
5
:
HTL/TTL
Input
1
:
Sine/Cosine & SSI
Input
2
:
Sine/Cosine
Input
3
:
Sine/Cosine
N.B. Input 1 can be used to connect to either a sine/cosine or an SSI encoder
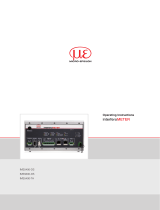
Figure 1: a) Encoder inputs b) USB interface and power supply
For each sine/cosine input, the analog A and B signals are sampled using separate 12-bit Analog-to-Digital
converters (ADCs) that are triggered using the same sample clock. This allows the signals to be sampled at
exactly the same time. The sample rate for input 1 is 20 MSPS (million samples per second). The sample
rate for the input 2 and 3 is 1 MSPS. Inputs 4 and 5 are evaluated by an RS422 receiver with a 10ns
switching time.

HDAQ2USB User Guide Version 1.3.docx 4/22 Baumer Hübner GmbH
29.07.2015/GP Berlin, Germany
3.1 Encoder Inputs
The input parameters for each of the inputs are as follows:
Input 4:
• Square-wave input (TTL/HTL, A+, A-, B+, B-, R+, R-)
• Maximum input frequency: 500 kHz
• Output supply voltage: 5 V or V
B
• Connection: D SUB 15
Input 5:
• Square-wave input (TTL/HTL, A+, A-, B+, B-, R+, R-)
• Maximum input frequency: 500 kHz
• Output supply voltage: 5 V or V
B
• Connection: D SUB 15
Input 1:
• Sine/cosine input (1 V
SS
, A+, A-, B+, B-, R+, R-)
• Maximum input frequency: 500 kHz
• SSI interface
• Output supply voltage: 5 V or V
B
• Connection: D SUB 15
Input 2:
• Sine/cosine input (1 V
SS
, A+, A-, B+, B-, R+, R-)
• Maximum input frequency: 200 kHz
• Output supply voltage: 5 V or V
B
• Connection: D SUB 15
Input 3:
• Sine/cosine input (1 V
SS
, A+, A-, B+, B-, R+, R-)
• Maximum input frequency: 200 kHz
• Output supply voltage: 5 V or V
B
• Connection: D SUB 15
!
Attention: HTL encoders must only be connected to inputs 4 and 5. Inputs 1, 2 and 3
will be damaged if HTL signals are connected.
!

HDAQ2USB User Guide Version 1.3.docx 5/22 Baumer Hübner GmbH
29.07.2015/GP Berlin, Germany
3.2 Terminating Resistors
The sine/cosine and square-wave inputs are not terminated by default. In the case that an encoder is
connected directly to the HDAQ2USB as shown in Figure 2 a), a terminating resistor adapter is needed as
shown in Figure 3. Measuring an un-terminated encoder will not damage the hardware, but can cause some
signal distortion. If the HDAQ2USB is used to observe encoder signals, e.g. between an encoder and drive
inverter, no terminating resistor should be required as one should already be present in the circuit, as shown
in Figure 2 b).
Figure 2: a) Encoder connected directly to HDAQ2USB b) HDAQ2USB observing encoder signals
Figure 3: Terminating resistor adapter
3.3 Power Supply
The HDAQ2USB requires a supply voltage in the range of 10 - 30 V, hereon named V
B
. The unloaded
current consumption at 12 V is typically 150 mA. The HDAQ2USB provides an output supply voltage to each
encoder connection. Each output supply voltage is switchable between 5 V, V
B
and open circuit (no output
voltage). An LED above the switch next to the input indicates the provided voltage level.
Switch position LED Color Output Supply Voltage to Encoder
Up Green 5 V
Center Off Open Circuit (No supply voltage)
Down Orange V
B
(10 – 30 V)
!
Attention: An output supply voltage above the specified rating can damage the
encoder!
!

HDAQ2USB User Guide Version 1.3.docx 6/22 Baumer Hübner GmbH
29.07.2015/GP Berlin, Germany
3.4 Pin Assignment
Sin/Cos, HTL/TTL and SSI Inputs:
D-SUB 15 Pin Assignment
1 A+
2 A-
3 B+
4 B-
5 R+
6 R-
7 CLK+ (SSI, only at input 1)
8 CLK- (SSI, only at input 1)
9 DAT+ (SSI, only at input 1)
10 DAT- (SSI, only at input 1)
11, 12 Output Supply Voltage: 5 V / - / V
B
13, 14 0 V
15 Shield
Power Supply:
M8 Pin Assignment
1 V
B
(10 – 30 V)
3 0 V
4 Shield
Figure 4: Power supply mating connector - Phoenix Contact SACC-M8FS-3CON-M-SW
1
4
3

HDAQ2USB User Guide Version 1.3.docx 7/22 Baumer Hübner GmbH
29.07.2015/GP Berlin, Germany
4 Signal Processing
4.1 Sine-wave Inputs
In order to calculate the position and velocity of a sine/cosine encoder, the A and B signals are firstly
normalized using offset and amplitude correction. Then the position is calculated using the arctangent
method, and the resulting signals for position and velocity are then smoothed using an adjustable low-pass
digital filter. The raw A and B signals can also be measured directly through an adjustable low-pass digital
filter. Therefore other analog signal sources such acceleration sensors can also be evaluated.
4.2 Square-wave Inputs
The position information for square-wave signals is derived using a ‘four edge evaluation’ method at a cycle
rate of 64 MHz. The velocity evaluation is performed with a gate time of 1 ms by means of a combined edge
count and cycle duration method. Glitches with duration less than 1.5 µs (frequencies above 650 kHz) are
ignored. The position and velocity signals are then smoothed using an adjustable low-pass digital filter.
4.3 Digital Filtering
Each digitized sine/cosine A and B signal, and each calculated position and velocity signal for sine/cosine
and square-wave encoders is passed through a configurable 64 value over-sampling low-pass digital filter
before being transferred to the PC. The cut-off frequency for each filter can be set as one of the following
values:
• 194 Hz
• 389 Hz
• 777 Hz
• 1,554 Hz
• 3,108 Hz
• 6,217 Hz
• 12,434 Hz
• 24,868 Hz
4.4 SSI Input
Input 1 also supports receiving SSI signal data. N.B. this is listed as input 6 in the PC software. The
HDAQ2USB acts as an SSI master with configurable SSI clock frequency, cable length and the monoflop
time used by the SSI slave. The interpretation of the received SSI data is configurable. Up to 8 different data
values or ‘Words’ can be extracted from the received data and plotted separately. For each Word it is
possible to configure the bit-length (1 – 32 bits), the type of data (position / velocity / raw) and whether the
data is signed or unsigned, see 5.5.3.2.3. No oversampling is implemented for the SSI input. The input is
triggered by the sample clock within the device. See Appendix B – SSI Data Block Configuration Examples.

HDAQ2USB User Guide Version 1.3.docx 8/22 Baumer Hübner GmbH
29.07.2015/GP Berlin, Germany
5 PC Software
The HDAQ2USB PC software is used to configure the device and to display the captured data. Additionally it
is possible to save measured data in order to load it later for further evaluation. The configuration of the
hardware device and the graphical display can be saved to and loaded from a file, and the current
configuration is automatically saved on exit and restored when the program is next run.
The user interface can be divided into three main areas as shown in Figure 5. Area ‘1’ is the toolbar, area ‘2’
is the control block, and area ‘3’ contains the currently configured graphs.
Figure 5: Main areas of the HDAQ2USB user interface.
Within each graph area there are several clickable zones that are highlighted with a black surrounding box
when the mouse is moved over them. The clickable zones are:
• The title of the graph and the area below the channel names: Used to configure the graph settings,
see 5.1.
• Each channel name: Used configure the channel settings, see 5.2.
• Within the grid of each graph: Used to for panning and zooming, see 5.3.
• The x and y-axis of each graph: Used for auto-scaling the axes according to the sampled data, see
5.3.
5.1 Graph Settings
Performing a left or right click on the graph title or below the channel names displays a context menu as
shown in Figure 6. It contains the following items:
2 3
1

HDAQ2USB User Guide Version 1.3.docx 9/22 Baumer Hübner GmbH
29.07.2015/GP Berlin, Germany
• Add graph: A new graph is added below the existing graphs.
• Insert graph: A new graph is added below the selected graph.
• Edit graph: The Graph Settings dialog is opened for the selected graph, see 5.1.1.
• Remove graph: The selected graph is deleted.
• Add FFT graph: A frequency domain view of the selected graph as added, see 5.4.
There is no in-built limit for the total number of graphs, or the total number of channels per graph.
Figure 6: Context menu of a graph
5.1.1 Graph Settings Dialog
Opening the Graph Menu provides the following options:
• Caption: Sets the title of the graph
• MaxValue: Sets the maximum value for the ‘stop on out of range’ function
• MinValue: Sets the minimum value for the ‘stop on out of range’ function
• Stop on out of range: When enabled and the program is capturing data in continuous mode, the
measurement will be stopped after the current measurement if any data lies outside the range
defined by MaxValue and MinValue. The out-of range area is displayed on the graph as a dark grey
background.
Figure 7: Graph Settings Dialog
5.2 Channel Settings
Each graph can have several channels. Clicking on the name of a channel opens a context menu with the
following options:
• Add channel: Adds a channel to the graph.
• Insert channel: Adds a channel to the graph below the selected channel.

HDAQ2USB User Guide Version 1.3.docx 10/22 Baumer Hübner GmbH
29.07.2015/GP Berlin, Germany
• Edit channel: Opens the channel setting dialog, see section 5.2.1.
• Remove channel: Deletes the selected channel.
Figure 8: Context menu of a channel
5.2.1 Channel Settings Dialog
The Channel Settings dialog provides the following options for the selected channel:
Caption Sets a name for channel
Input Selects the hardware input 1 to 6 (input 6 being SSI)
Channel Depending on the input type:
• Sine/cosine & HTL/TTL: position, velocity, A, B, R (zero-pulse)
• SSI: SSI Words, as configured in the SSI section of the Settings dialog, see
5.5.3.2.3.
Operation none, add, subtract
When add or subtract is selected the Input2 and Channel2 fields are enabled, allowing a
second data source to be selected. The plotted data is the result of the mathematical
operation between the two data sets.
Unit Depending on the input channel, a list of suitable units is given. (The plotted data is
scaled appropriately.)
Invert Inverts the data
Offset Applies a fixed offset to the data
Color Sets the color used to plot the channel
Display Value Displays a data value below the channel name showing the last value for the current
measurement

HDAQ2USB User Guide Version 1.3.docx 11/22 Baumer Hübner GmbH
29.07.2015/GP Berlin, Germany
Figure 9: Channel Settings Dialog
5.3 Zooming, Panning and Auto-scale
5.3.1 Zooming
In order to zoom in or out within a graph, firstly click on the respective magnifying glass icon in the toolbar.
Then click and drag within a graph area to select the desired viewable range. The zoom out function
operates in an inverse manner – the smaller the selected range, the further the graph will zoom out.
The mouse wheel can also be used to zoom in and out.
5.3.2 Panning
Once a graph has been zoomed in, click on the crossed arrow icon in the toolbar to switch to panning mode.
Click and drag within the graph to pan it in either direction.
5.3.3 Auto-scale
• Click on the x or y axis of a graph to auto-scale it according to the range of the data in that
dimension.
• Click on the horizontal arrow icon in the toolbar to auto-scale the x-axis of all of the graphs.
• Click on the vertical arrow icon in the toolbar to toggle the periodic auto-scale function, which auto-
scales the y-axis for all of the graphs every second.

HDAQ2USB User Guide Version 1.3.docx 12/22 Baumer Hübner GmbH
29.07.2015/GP Berlin, Germany
5.4 Frequency Domain Analysis
It is possible to view captured data in the frequency domain. To do this, open the context menu for an
existing graph by clicking on the title or below the channel names, and select ‘Add FFT graph’. In continuous
capture mode the FFT is continually updated. Data saved in a MATLAB file can also be loaded and analyzed
in the frequency domain. The FFT graph is essentially another view of the same underlying data. Therefore
the channels shown and their configuration are exactly the same as the time domain graph to which it
belongs. Removing the time domain graph will also remove the FFT graph. The displayed frequency range is
half of the global sampling frequency which is set in the Settings menu, as per the Nyquist Theory.
5.4.1 FFT Settings Dialog
Opening the graph context menu for an FFT graph and selecting Edit Graph, will open the FFT Settings
dialog. The options are:
• FFT dB Scale: Uses a logarithmic decibel scale for the y-axis.
• FFT Window: Selects the windowing function used on the data before the FFT is performed.
• FFT Number of Averages: Enables the display averaging function which can be useful for smoothing
out the spectral noise floor. It performs the required number of FFTs and averages the results. This
is performed after converting to a logarithmic scale (when enabled). The total FFT range is the FFT
Size multiplied by the Number of Averages. For example, when the FFT Size is 8,192 and the
Number of Averages is 10, then the FFT range is 81,920 samples. A value of zero is the same as a
value of one, i.e. no averaging is performed.
• FFT Size: Limits the number of samples used to perform the FFT. A value of zero performs the FFT
on the entire data set.
Figure 10: FFT Settings Dialog
5.4.2 Panning in the time domain
When the FFT range (FFT Size x Number of Averages) is smaller than the viewable data in the time domain,
then the FFT is not performed on all of the viewable data. The FFT range is therefore highlighted in the time
domain with a white background, and the rest of the data is highlighted with a grey background, see Figure
11. The FFT range always starts from the left hand side of the graph. Therefore panning the time domain will
change the data shown within FFT range, and therefore the data on which the FFT is performed. The FFT
graph is continually updated as the time domain graph is panned. N.B. if the FFT range is large, panning in
the time domain will consume significant CPU time.

HDAQ2USB User Guide Version 1.3.docx 13/22 Baumer Hübner GmbH
29.07.2015/GP Berlin, Germany
Figure 11: Example FFT graph showing the FFT range highlighted with a white background
5.4.3 Zooming in the time domain
If the time domain graph is zoomed in so that the viewable range is smaller than normal FFT range (FFT
Size x Number of Averages), then the FFT Size is limited to the viewable range divided by the number of
averages, so that the FFT range is always less-than-or-equal to the viewable range. In other words, zooming
in to a small area of the time domain graph limits the FFT range to the visible data. This can be useful for
analyzing dynamic data with fundamental frequencies that change considerably w.r.t. the total measurement
time, but have localized periods of consistency that can be easily be identified and selected for frequency
analysis.
5.5 Main Menu
5.5.1 File Menu
• Load Configuration: Load an existing configuration file. All current settings will be replaced with those
loaded.
• Save Configuration: All current settings, including the HDAQ2USB device settings, are stored to a
file.
• Load Data: Data is loaded from MATLAB (.mat).
• Save Data: The currently sampled data is stored to a MATLAB (.mat) or CSV file.
5.5.2 Edit Menu
• Add Graph: An additional graph is added below the last graph.

HDAQ2USB User Guide Version 1.3.docx 14/22 Baumer Hübner GmbH
29.07.2015/GP Berlin, Germany
5.5.3 Options Menu
Settings regarding the HDAQ2USB and the PC program can be found here.
5.5.3.1 Connect
All of the PC’s USB connections are analyzed in order to establish whether a HDAQ2USB device is
connected. If only one device is connected, the program connects automatically to it. Otherwise a dialog is
shown to select the device with which the program should connect.
5.5.3.2 Settings Dialog
The Settings dialog box (see Figure 12) is used to change the general program settings and the
configuration for each encoder input.
The general program settings are:
• Sample Rate: Number of data samples per second
• Display Time: Time period of the data displayed for each graph
• Log Time: Time period of the sampled data when the Log function is used.
• Graph Line Width: Sets the width of the line displayed in the graphs.
• Value on package loss: When data loss during measurement occurs, this value is plotted instead of
the measured data.
The lower part of the dialog consists of 6 tabs to configure the settings for each input of the HDAQ2USB.
Note that the sixth channel (SSI) is physically connected at input 1. All specific settings of an encoder must
be set here to ensure proper operation and signal evaluation.
Figure 12: General settings and input configuration settings
5.5.3.2.1 SinCos 1, SinCos 2, SinCos 3
Inputs 1 to 3 are intended for use with sine-wave encoders - see Figure 12 for the available settings. The
‘Periods’ option configures the number of sine-wave cycles per turn or per meter. The ‘R Threshold’ option
determines the switching point of the zero-pulse. The ‘Filter Position/Velocity’ option selects a low-pass filter
with which the signals are filtered. Channels A and B also have configurable low-pass filters.

HDAQ2USB User Guide Version 1.3.docx 15/22 Baumer Hübner GmbH
29.07.2015/GP Berlin, Germany
5.5.3.2.2 HTL/TTL 4, HTL/TTL 5
The inputs 4 and 5 are designed to capture TTL and HTL signals. The ‘Periods’ option sets the number of
square-wave cycles per turn or per meter. The ‘Filter Position/Velocity’ option selects a low-pass filter with
which the signals are filtered.
Figure 13: Square-wave signal settings
5.5.3.2.3 SSI 6
The SSI 6 input is physically identical to input 1. The clock frequency and the monoflop time must be
specified for the SSI master (HDAQ2USB). To compensate for the propagation delay present in long cables,
the cable length in meters can be adjusted. For sources using gray coding the checkbox can be enabled.
Only Gray code decoding of the whole SSI data block is supported.
The SSI data block can be interpreted as up to 8 separate data ‘Words’. Each Word can be up to 32 bits long
and can contain position, velocity or any other kind of (raw) data. The configuration for each Word is set in
the ‘Data Block Composition’ area. The ‘Number of Words’ specifies the number of enabled Words. A
maximum of 8 times 32 bits of data, or 256 bits, can be evaluated. The following settings for each Word (see
Figure 14) are available:
• bits total: Number of bits for this data field including an optional sign bit
• sign: Indicates that the data has a sign bit (MSB of the data field)
• type: Type of data for this data field, either:
o position: comprising of a single-turn, or combined single-turn and multi-turn value
o velocity
o raw: unit-less data
• bits single: Number of bits for a single-turn or position value
• bits multi: Number of bits for a multi-turn or position value
• scale: Data scaling factor (1.00 by default)
• mzero: Enables the manual zero function, see 5.6.1.

HDAQ2USB User Guide Version 1.3.docx 16/22 Baumer Hübner GmbH
29.07.2015/GP Berlin, Germany
Figure 14: General and data block SSI settings
Examples on how to configure the SSI data block can be found in Appendix B – SSI Data Block
Configuration Examples.
5.5.3.3 Synchronize X Axis
It is possible to synchronize the x-axes of all of the graphs, meaning that panning or zooming within one
graph automatically adjusts the x-axis of all of the other graphs accordingly. Note that this feature operates
independently in the time and frequency domains. To activate this feature, enable the Sync X Axis option in
the Options menu.
Figure 15: Sync X Axis
5.6 Control Block
The control block (see area 2 in Figure 5 on the left side of the window) is used to start repetitive
measurement, perform a single measurement, stop the current measurement or perform a logging
measurement. A logging measurement captures data for the time specified in the global settings and then
saves the data to a file.
5.6.1 Zeroing
Whilst measurement is in progress, it is possible to adjust the vertical offset of the plotted data using the
zeroing functions. Zeroing can be useful for comparing two or more signals against each other.
• Manual Zero: The selected inputs are each offset by the signal value received at the time the button
is clicked.

HDAQ2USB User Guide Version 1.3.docx 17/22 Baumer Hübner GmbH
29.07.2015/GP Berlin, Germany
• Ref Zero: The selected inputs are each offset by the signal value received when the next zero-pulse
is received. N.B. this does not apply to the SSI input.
Checkboxes for enabling the zero function for each input are found in the Control Block. In order to use the
manual zero function for SSI Words, the ‘Input 6(SSI)’ checkbox must checked as well as the respective
Words in the SSI section of the Settings dialog, see 5.5.3.2.3.
5.7 Example Configuration
Figure 16 shows an example configuration with five signals in four graphs.
Figure 16: Example data captured from a sine/cosine encoder and a Ferraris sensor

HDAQ2USB User Guide Version 1.3.docx 18/22 Baumer Hübner GmbH
29.07.2015/GP Berlin, Germany
Appendix A – Version History
Version v1.2.1 (11/2013)
• Supported SSI Words increased from 4 to 8
• FFT function added
• Hardware version 2 (unchanged)
• Firmware updated for 8 SSI Words
Version v1.2.0 (11/2010)
• SSI data can handle up to 4 configurable SSI Words. Each Word can be signed or unsigned and
displayed as position, velocity or as raw data, whereby the position value can be divided into single,
multi and single + multi turn value.
• Hardware is unchanged
• Firmware updated (Version 2.0)
• PC-Software v1.2.0 works starting from Firmware Version 2.0 (check at start of software)
Version v1.1.5
• A display of current values is added. Last display can be activated in the channel settings by
activating the checkbox Current Value.
• The auto-scale function is revised. In active mode each second the graphs will be scaled to the data
maximum.
• The Version of the PC-Software is shown in the title of the main window.
• Hardware is unchanged
• Firmware is unchanged (Version 1.0)
Version v1.1.4
• Aliasing in signal representation removed.
• Display-Settings are stored at normal program termination.
• Hardware is unchanged
• Firmware is unchanged (Version 1.0)
Version v1.1.3
• Overflow-Error for Math-Operation channel removed
• Hardware is unchanged
• Firmware is unchanged

HDAQ2USB User Guide Version 1.3.docx 19/22 Baumer Hübner GmbH
29.07.2015/GP Berlin, Germany
Appendix B – SSI Data Block Configuration Examples
Example 1:
18-bit single-turn Gray coded position
Figure 17: Example SSI configuration: 18-bit single-turn Gray coded position

HDAQ2USB User Guide Version 1.3.docx 20/22 Baumer Hübner GmbH
29.07.2015/GP Berlin, Germany
Example 2:
24-bit (12-bit single-turn + 12-bit multi-turn) position
Figure 18: Example SSI configuration: 24-bit (12-bit single-turn + 12-bit multi-turn) position
/