Page is loading ...

© 2010 Life Technologies Corporation
11-Apr-11
Title of the presentation, editable in the slide master
1
Development and Validation of the
3500 Series Genetic Analyzer for Human
Identification
Jeff Sailus
Forensic Science Applications Group

© 2010 Life Technologies Corporation
11-Apr-11
Title of the presentation, editable in the slide master
2
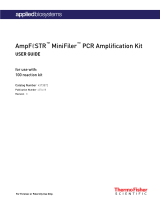
Development of a Next Generation Genetic Analyzer
A Whole System Approach
New Laser and
Polymer Pump
Block
Redesigned
Consumables
with Tracking
Real-time System
and Consumable
Information
Predefined
Protocols and HID
Templates
Improved
Temperature
Control Shorter
Run Times
Optional Signal
Normalization
Data Analysis
QC Tools and
Flags
Simplified
Reinjection
Scheme
Instrument
Hardware
Consumables
Data Collection
QC Analysis
GMID-X v1.2
ID-X 1.1.1 Upgrade
Supports Windows XP
and Vista
Analyzes .fsa
& New .hid
File Format
Consumable
Data Tracking

© 2010 Life Technologies Corporation
11-Apr-11
Title of the presentation, editable in the slide master
3
Improved Data Quality and Sample Throughput
Smaller
Oven
More Consistent
Migration for Better
Sizing Precision
Faster Run Time
Higher Throughput
Flat Oven Door Seal
and New Locking
Mechanism
Detection cell
heater

© 2010 Life Technologies Corporation
11-Apr-11
Title of the presentation, editable in the slide master
4
Instrument Setup and Performance
Elimination of Lower
Polymer Block and
Polymer Delivery
Tubing
Reduced Polymer
Waste
Direct Channels
Promote Efficient
Polymer Flow
Redesigned
Array Port
Minimized Potential
for Bubbles and Leaks

© 2010 Life Technologies Corporation
11-Apr-11
Title of the presentation, editable in the slide master
5
Instrument Setup and Performance
•Pre-Filled, Quality-Controlled Reagents
•Information Recorded via RFID
•Lot numbers
•Part Numbers
•Serial numbers
•Dates (expiration and installation)
•Capacity/Usage
•Per Sample Running Cost
Comparable to 31xx

© 2010 Life Technologies Corporation
11-Apr-11
Title of the presentation, editable in the slide master
6
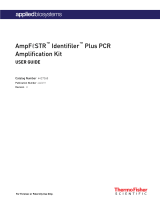
Data Collection:
QC Analysis Tools for Preliminary Data Analysis
Review data quality flags, electropherograms and sizing tables -Select samples for reinjection

© 2010 Life Technologies Corporation
11-Apr-11
Title of the presentation, editable in the slide master
7
3500 Developmental Validation Studies

© 2010 Life Technologies Corporation
11-Apr-11
Title of the presentation, editable in the slide master
8
Developmental Validation Scope
Hardware and Reagents
•Instruments
•(3) 8 Capillary Instruments (3500)
•(3) 24 Capillary Instruments (3500xL)
•Size Standard
•GeneScan™ 600 LIZ®Size Standard v2.0
•GeneScan™ 500 ROX™Size Standard
•4 Dye Amplification Kitsdo not use the normalization functionality
•Polymer and Array
•POP-4™and 36 cm Capillary Array

© 2010 Life Technologies Corporation
11-Apr-11
Title of the presentation, editable in the slide master
9
Developmental Validation Scope
Sample Summary
Test Name Samples Input Replicates
Genotype
Concordance and
Reproducibility
•40 male and 42 female gDNA samples
•4 racial groups
•Controls
1ng total DNA •1 replicate per sample
•2 injections
Sizing Precision
and Accuracy Allelic ladder 1 µL per well •See below
Sensitivity and
Normalization •007 control DNA
•3 gDNA samples Kit dependent 0.125ng,
0.25ng, 0.5ng, 0.75, 1ng,
6ng
•5 replicates for DNA
samples
•3 replicates for NTC
•4 injections
Mixture Analysis •4 pairs of male and female gDNA
•Mixture ratios
•1:0, 1:1, 1:3, 1:5, 1:9, and 0:1
•Recommended
concentrations per kit 1 replicate per sample
Resolution •Allelic Ladder
•Research material •1 µL per well 24 replicates

© 2010 Life Technologies Corporation
11-Apr-11
Title of the presentation, editable in the slide master
10
Validation Scope
AmpFℓSTR®Kits
•Identifiler®
•Minifiler™
•SGM Plus®
•Yfiler®
•Sinofiler™
•SEfiler Plus™
•Profiler Plus®
•Cofiler®
•Identifiler®Direct
•Identifiler®Plus
•NGM™

© 2010 Life Technologies Corporation
11-Apr-11
Title of the presentation, editable in the slide master
11
Precision and Accuracy Studies

© 2010 Life Technologies Corporation
11-Apr-11
Title of the presentation, editable in the slide master
12
3500 Sizing Precision Study:
Within an Injection of Identifiler Allelic Ladder

© 2010 Life Technologies Corporation
11-Apr-11
Title of the presentation, editable in the slide master
13
3500 Sizing Precision Study:
Across Multiple Injections of Identifiler Allelic Ladder Samples

© 2010 Life Technologies Corporation
11-Apr-11
Title of the presentation, editable in the slide master
14
Resolution and Baseline Evaluation

© 2010 Life Technologies Corporation
11-Apr-11
Title of the presentation, editable in the slide master
15
Resolution
•SEfiler Plus™(SE33 triplet) and
Identifiler®(TH01 9.3/10) Allelic
Ladders
•160 injections per instrument on 6
instruments
•Research STR markers greater than
300 base pairs were also developed
with single base pair differences
(data not shown)

© 2010 Life Technologies Corporation
11-Apr-11
Title of the presentation, editable in the slide master
16
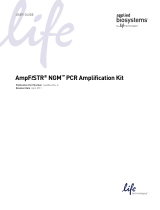
Baseline Noise -Developmental Evaluation
G5 Average Noise (PAT=Avg Noise+10x SD)
0
20
40
60
80
100
120
140
160
180
200
FAM VIC NED PET LIZ TOTAL
10x Average Std. Dev.
Data generated during the Sensitivity Studies were then used to confirm
the level of pull up and an optimal peak amplitude threshold setting.
175 RFU

© 2010 Life Technologies Corporation
11-Apr-11
Title of the presentation, editable in the slide master
17
Introduction to Normalization

© 2010 Life Technologies Corporation
11-Apr-11
Title of the presentation, editable in the slide master
18
Normalization: What is it?
A method to attenuate signal variations associated
with instrument, capillary array, sample salt load,
and injection variability
•Factory Standardization: Hardware-based
calibration to help enable more consistent
instrument to instrument performance
•(Optional) Internal Standard Normalization:
Chemistry and software based method to help
enable more consistent performance across
injections and instruments
•GeneScan™600 LIZ®Size Standard v2.0
•3500 Data Collection and GMID-X v1.2
Before
normalization After
normalization

© 2010 Life Technologies Corporation
11-Apr-11
Title of the presentation, editable in the slide master
19
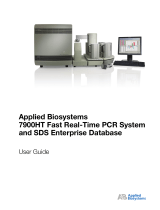
Sources of Variation by Normalization Method
No Norm Factory only Int Std only Factor+IntStd
Injection to Injection
Cap to Cap
Within
Instrument to Instrument
Total
39%
33%
25%
14%
31%
24%
24%
13%
20%
19%
5%
5%
12%
11%
4%
4%
3%
3%
0%
0%
0%
5%
10%
15%
20%
25%
30%
35%
40%
%CV
Levels of Normalization
Sources of Variation
Instrument to
Instrument largest
source of variation
Factory + Internal
Standard
Normalization
greatest reduction
in variation

© 2010 Life Technologies Corporation
11-Apr-11
Title of the presentation, editable in the slide master
20
Sensitivity and
Internal Standard Normalization Studies
/