Page is loading ...

TBR4100/1025
Free Radical Analyzer
Serial No._____________________
www.wpiinc.com
INSTRUCTION MANUAL
111723
WORLD
PRECISION
INSTRUMENTS

TBR4100/1025
II WORLD PRECISION INSTRUMENTS

TBR4100/1025
WORLD PRECISION INSTRUMENTS iii
CONTENTS
ABOUT THIS MANUAL .............................................................................................................................................................................. 1
INTRODUCTION ......................................................................................................................................................................................... 2
Features.................................................................................................................................................................................................. 2
Notes and Warnings ............................................................................................................................................................................ 2
Unpacking .............................................................................................................................................................................................. 3
INSTRUMENT DESCRIPTION ................................................................................................................................................................... 4
Instrument Controls ............................................................................................................................................................................ 4
Handling 2mm Sensors ...................................................................................................................................................................... 7
OPERATING INSTRUCTIONS ..................................................................................................................................................................10
Setup and Calibration of NO Sensors ........................................................................................................................................... 10
Setup and Calibration of HPO Sensors ........................................................................................................................................21
Setup and Calibration of Oxygen Sensors ................................................................................................................................... 23
Setup and Calibration of Glucose Sensors .................................................................................................................................. 26
Setup and Calibration of CO Sensor .............................................................................................................................................29
ACCESSORIES............................................................................................................................................................................................32
SPECIFICATIONS ....................................................................................................................................................................................... 33
APPENDIX A: REFERENCE TABLES .......................................................................................................................................................35
APPENDIX B: STANDARD SOLUTIONS ................................................................................................................................................39
Standard 1mM H2O2 Solution .........................................................................................................................................................39
200mL of 0.1M PBS Buer Solution .............................................................................................................................................. 39
100mM Standard SNAP Solution ....................................................................................................................................................39
APPENDIX C: USING TBR4100/1025 WITH LABSCRIBE ......................................................................................................................... 41
Install LabScribe Software................................................................................................................................................................41
Launch LabScribe .............................................................................................................................................................................45
Conguring LabScribe for the TBR4100/1025 ............................................................................................................................ 46
Installing the Drivers Manually........................................................................................................................................................55
INDEX ..........................................................................................................................................................................................................59
DECLARATION OF CONFORMITY .........................................................................................................................................................61
WARRANTY ................................................................................................................................................................................................62
Claims and Returns ...........................................................................................................................................................................62
Copyright © 2023 by World Precision Instruments. All rights reserved. No part of this publication may be reproduced or translated into any
language, in any form, without prior written permission of World Precision Instruments, Inc.

TBR4100/1025
IV WORLD PRECISION INSTRUMENTS

TBR4100/1025
WORLD PRECISION INSTRUMENTS 1
ABOUT THIS MANUAL
The following symbols are used in this guide:
This symbol indicates a CAUTION. Cautions warn against actions that can cause damage to equipment. Please
read these carefully.
This symbol indicates a WARNING. Warnings alert you to actions that can cause personal injury or pose a
physical threat. Please read these carefully.
NOTES and TIPS contain helpful information.
Fig. 1—TBR4100 front panel
Fig. 2—TBR1025

TBR4100/1025
2WORLD PRECISION INSTRUMENTS
INTRODUCTION
Free radical analyzers are available in two models:
• TBR4100 is the four-channel model.
• TBR1025 is the one-channel model.
The operation of the analyzers is exactly the same, so they are discussed together in this manual. Specications of
both models are identical. See “Specications” on page <?>.
TBR4100/1025 is an inherently analog device. In this conguration, the current signal from the sensor enters the
device and is converted to a voltage at a user-selectable gain. Thereafter it passes to the current output. WPI
recommends that the analog signal then be presented to a Lab-Trax digital recorder where, under user control,
software can be used to smooth, lter and calibrate the signal. Lab-Trax is provided with LabScribe software that runs
on your computer.
In addition, a pre-calibrated temperature input is also provided. Many sensors are aected by temperature.
Features
• Total galvanic isolation of channel inputs
• Pre-adjusted selectable Poise voltage values for each type of WPI free radical sensor, as well as an adjustable
voltage settings
• Front panel mounted digital panel meters to monitor poise voltage and sensor current output on each channel
simultaneously
• A temperature monitor input accepting signal from a Pt1000 RTD temperature sensor
• Four selectable sensitivity (input current) ranges
• Front panel BNC output connectors providing a low impedance voltage output signal, suitable for direct
connection to any standard data recording device
• Front panel input connectors designed to provide easy connection to the entire line of WPI free radical sensors
• Internal signal ltering to provide rapid signal response while attenuating noise components.
• Universal power supply
Notes and Warnings
NOTE: The TBR4100/1025 incorporates a universal power supply that is internally protected with a fusible link. In the
event of a power supply failure, the fusible link will open to disconnect power from the unit. The fusible link is not user
serviceable. If the TBR4100/1025 fails to power up, contact WPI Technical Support.
Parts List
After unpacking, verify that there is no visible damage to the sensor. Verify that all items are included:
TBR1025 TBR4100
(1) TBR1025 - Free Radical Analyzer (1) TBR4100 - Free Radical Analyzer
(1) Sensor of the buyer’s choice (2) Sensor of the buyer’s choice
(1) ISO-TEMP-2 - Temperature detector (1) ISO-TEMP-2 - Temperature detector
(2) 2851 - 6’ BNC cable (5) 2851 - 6’ BNC cable
(1) 91210 - Assembly test resistor 1G (1) 91210 - Assembly test resistor 1G
(1) 91580 - Microsensor cables (1) 91580 - Microsensor cables
(1) Potentiometer adjustment tool (1) Potentiometer adjustment tool
(1) Instruction Manual (1) Instruction Manual

TBR4100/1025
WORLD PRECISION INSTRUMENTS 3
Unpacking
Upon receipt of this instrument, make a thorough inspection of the contents and check for possible damage. Missing
cartons or obvious damage to cartons should be noted on the delivery receipt before signing. Concealed damage
should be reported at once to the carrier and an inspection requested. Please read the section entitled “Claims and
Returns” on "Claims and Returns" on page 63 of this manual. Please contact WPI Customer Service if any parts are
missing at (941) 371-1003 or [email protected].
Returns: Do not return any goods to WPI without obtaining prior approval (RMA # required) and instructions from
WPI’s Returns Department. Goods returned (unauthorized) by collect freight may be refused. If a return shipment is
necessary, use the original container, if possible. If the original container is not available, use a suitable substitute that
is rigid and of adequate size. Wrap the instrument in paper or plastic surrounded with at least 100mm (four inches)
of shock absorbing material. For further details, please read the section entitled “Claims and Returns” on "Claims and
Returns" on page 63 of this manual.

TBR4100/1025
4WORLD PRECISION INSTRUMENTS
INSTRUMENT DESCRIPTION
The TBR4100/1025 fulls two functions. Its LCD display gives you full status of the measurement in progress and the
analog output allows an outboard recorder to record the current or voltage with time
Instrument Controls
Channel Modules
The TBR4100 has four identical channel modules, each with three controls. The
TBR1025 has single channel with the same three controls.
Fig. 3—(Right) TBR4100 channel module
Range Control
The RANGE control is a four-position rotary switch controlling the gain of the
channel. Each current marking on the Range control represents the maximum
sensor current that can be detected for that setting. Additionally, the range
control setting also determines the proportional relationship between the sensor
current and the resulting output voltage. The maximum available output voltage
for the TBR is 10.0V. The table below provides an example of the sensor current
as represented by output voltages of 1, 5 and 10 volts for each of the four range
settings.
Output
Voltage
Range Settings
10nA 100nA 0.1µA 1µA
1.0V 1nA 10nA 0.1µA 1µA
5.0V 5nA 50nA 0.5µA 5µA
10.0V 10nA 100nA 1.0µA 10µA
Probe Select Control
The PROBE SELECT control is a six-position rotary switch. It sets the applied or “poise” voltage across the sensor. The
rst ve settings on the switch are preset for Nitric Oxide, Hydrogen Sulde, Hydrogen Peroxide, Glucose and Oxygen.
The sixth position is manually adjustable for other sensors whose poise voltage requirements are not met by the rst
ve switch settings. The manual adjustment is accomplished using a small screwdriver and adjusting the front panel
trim pot which is available through the access hole on the front panel to the lower right of the Probe Select switch.
Meter Select Control
The meter select control is a two-position toggle switch that changes the value displayed in the channel module’s
LCD from Applied Voltage to Output Current. The units for Applied Voltage are volts. The units for Output Current are
microamps (µA) when the RANGE control is set to 1µA or 10µA and nanoamps (nA) when the RANGE control is set to
10nA or 100nA
Input Connectors
Each channel module has a three-conductor LEMO connector mounted on the front panel near the bottom of each
channel module. This connector is compatible with all WPI free radical sensors listed in the table on the next page.

TBR4100/1025
WORLD PRECISION INSTRUMENTS 5
Macro Sensors
Species NO HPO O2CO
Order Number ISO-NOP ISO-HPO-2 ISO-OXY-2 ISO-COP-2
Available Diameters 2 mm 2 mm 2 mm 2 mm
Response Time < 5 sec < 5 sec < 10 sec < 10 sec
Detection Limit/Range 1 nM < 100nM–
100mM
0.1%-100% ~10nM*
Sensitivity 2 pA/nM 0.02 pA/nM N/A ~0.5pA/nM*
Drift None 0.1pA/min < 1%/min None
Temperature Dependent Yes Yes Yes Yes
Physiological Interference None None None Nitric Oxide
Replacement Sleeves(4 pk) #5436 #600012 #5378 #956620
Filling Solution #7325 #100042 #7326 #95611
Start-up Kit #5435 #600011 #5377 #95699
*Carbon monoxide sensors are not calibrated at the factory because of the toxic nature and inherit dangers of CO.
Mini Sensors
Species Nitric Oxide Hydrogen Peroxide Glucose
Order Number ISO-NOPF ISO-HPO-100 IGS100
Available Diameters 100 & 200 µm 100 µm 0.6mm coiled
Available Length 2 mm, 4 mm 2 mm, 4 mm 1.5mm
(Flex body:
35mm)
Response Time < 5 sec < 5 sec 100–300sec
Detection Limit/Range 0.2 nM < 1nM–1mM 2–25mM
Sensitivity 10pA/nM 1 pA/nM 0.5–10nA/mM
Drift none 1.0 pA/min none
Temperature Dependent slight slight slight
Physiological Interference None Yes Acetaminophen,
ascorbic acid,
uric acid
Microsensor Cable #91580 #91580 #91580
Available/w Hypodermic Sheath ISO-NOPFH ISO-HPO-100-H none
Available as “L”-shaped ISO-NOP70L ISO-HPO-100-L none
Micro Sensors for NO
Order Number ISO-NOP30 ISO-NOP007 ISO-NOPNM
Available Diameters 30 µm 7 µm 100 nm
Available Length 0.5 mm, 2 mm 0.1mm, 2 mm 0.2 mm
Response Time < 3 sec < 3 sec < 3 sec
Detection Limit/Range 1nM 0.5 nM 0.5 nM
Sensitivity 1~4pA/nM 1~4pA/nM 0.5 pA/nM
Drift none none none
Temperature Dependent yes yes some
Physiological Interference none none none

TBR4100/1025
6WORLD PRECISION INSTRUMENTS
Output Module
The output module of the TBR4100, to the right of the channel modules, has
four BNC connectors that carry the analog output from each of the four input
modules. In addition, input and output connections for the Pt1000 temperature
sensor are located here.
The TBR1025 temperature input and output are located on the left side of the
unit, and the sensor input and output are located on the right side of the unit.
Fig. 4—(Right) TBR4100 channel outputs
Rear Panel
The rear panel contains the power entry module and the power switch. The
TBR4100/1025 employs a universal switching supply. It may be connected to
any line voltage between 100V and 240V (50/60Hz) with no adjustment.
Grounding and Noise Concerns
While the current model of the TBR4100/1025 is protected against EMI, it may still be necessary to provide additional
shielding. Enclosing the system in a Faraday cage is the best way to shield against stray electric elds. Faraday cages
can be constructed of copper screening but must be soldered completely along any joining seams. Place all the
instruments and the sample into a grounded Faraday cage.
It may not always be possible to put the whole measurement system in a Faraday cage for shielding, as for example
with a ow-through system when the probe is immersed into the euent of a perfusion system or placed directly
into the vein or the heart of an animal. In this case, grounding the external bathing uid, vein, or tissue with a Ag/AgCl
reference electrode will often help signicantly. If pumps or other electrical instruments are to be used in a ow-
through system, the associated equipment or instruments should be grounded as well. Use a common ground for all
equipment in the experiment.
After careful grounding and shielding of the electronic equipment and the probe system, sometimes it is found that
movement of people in the immediate vicinity causes current uctuations. These are due to variations in the resulting
stray capacitance. There are several ways to minimize these eects. When the measurements are made in vivo, it is
good practice to ground the animals. In addition, the operator may need to be grounded because large static charges
can be generated by the operator’s body. Wrist straps connected to ground the operator may be helpful.
Set Up and Use for Current Sensors
In almost all cases, amperometric sensors must equilibrate in the measuring medium. Typically, on immersion, large
currents will be observed. These initial currents will move toward zero, rapidly at rst then eventually settling to a
smaller non-zero value. Expected nal currents and approximate settling times are shown in Appendix A, Table 6,
page 38. Note that sensors are NOT ready to use or calibrate until observed current values are stable.
Setting Range
In an analog device, gain can be a powerful tool. It literally amplies small signals up to the point where they can
be recorded by chart recorders or data acquisition systems. First stage gain improves signal-to-noise and generally
makes recording easier. There is a cost, however. The use of gain narrows the range of observable signal. For
example, suppose an amplier has a baseline noise of 1mV. If a perfectly noiseless sine wave signal with an amplitude
of 2mV is presented to the input and the amplier has a gain of x1, the signal-to-noise ratio will be 2:1. If, however the
gain is set to x10 the 2mV signal will be increased to 20mV but the amplier noise will remain the same. The signal to
noise will then improve to 20:1. Higher gains produce even better performance. If this is so, why don’t all ampliers
have high gains to get the best noise performance, particularly in the case of free radical sensors whose currents are
vanishingly small? The problem occurs with observable range. Ampliers cannot output a voltage greater than the
supply voltage used to power them. Most ampliers run on ±5V. In our example above, if we used a gain of x10,000
the output signal would be 20V (0.002Vx10,000). The amplier, powered by ±5V, would swing to its maximum voltage
of 5V and appear over ranged. The use of gain improves our resolution but narrows our range. In our example above,
a gain of 10,000 would limit our observable range to ±0.5mV.

TBR4100/1025
WORLD PRECISION INSTRUMENTS 7
In the context of recording the output from free radical sensors, a series of gains or ranges are provided. The
narrower the range, the higher the signal-to-noise and therefore the quieter the recording. Sensors of this type,
however, can produce standing or background current osets that make use of more sensitive ranges impossible
In most cases free radical sensors will require a period of time to “polarize” or equilibrate. During this settling time,
currents can be in the tens of nanoamps and will require a larger and therefore less sensitive range to see the
progress. Once the sensor is stable, however, use the most sensitive (smallest) range in which the signal can be seen.
Current ranges of 10 nA ,100 nA, 1 µA and 10 µA are provided by the TBR4100/1025.
Filters
The TBR4100/1025 is internally bandwidth limited at 3Hz. Additional ltration and/or smoothing is available in the
recommended LabScribe recording software.
Although Filters are generally thought of as devices to remove noise, in reality, they remove signal. Excessive ltration
or smoothing can greatly increase the time it takes for signals to reach nal value and can even distort faster
waveforms and prevent them from reaching their nal values.
If you use additional ltration remember that the lower your set lter, the longer your signal will take to reach nal
value. If you are measuring very small changes in current, you may want to use a lower lter setting to reduce noise.
Using a lower lter will make it dicult or impossible to see fast signals. Conversely, if you are trying to see fast
changes such as those associated with stop ow or fast kinetic studies, you should use a higher lter setting
Handling 2mm Sensors
The 2mm sensors are similar in construction. These sensors include the ISO-NOP, ISO-HPO-2, ISO-OXY-2, ISO-H2S-2
and ISO-COP-2.
Structure of the Sensor
The basic structure of the sensors is shown below (Fig. 5).
Fig. 5—2mm Sensor assembly
Gas permeable, polymeric membrane covering the end of the stainless sleeve to separate it from the external
environment
Disposable, protective stainless steel sleeve that houses the sensitive electrode pair. The sleeve is anged to
properly connect with the locking cap. It must contain fresh electrolyte.
Unique, internal species-specic sensing pair of working and counter (reference) electrodes
Probe handle
Locking cap attaches the sleeve to the probe handle
Sensor Species SS Sleeve
(4 pack)
Filling Solution Startup Kit
ISO-NOP Nitric Oxide 5436 7325 5435
ISO-HPO-2 Hydrogen Peroxide 600012 100042 600011
ISO-OXY-2 Oxygen 5378 5326 5377
ISO-COP-2 Carbon Monoxide 95620 95611 95699

TBR4100/1025
8WORLD PRECISION INSTRUMENTS
When the sensor is fully assembled (with locking cap and sleeve in place) the internal electrode should press gently
against the polymeric membrane, which will be slightly stretched. This ensures that the electrolyte diusion is as thin
as possible, minimizing sensor response time.
NOTE: Once a membrane is stretched it is permanently deformed and cannot be reused if the sleeve is removed
from the electrode.
The start-up kits include replacement membrane sleeves, along with all the accessories to ll them properly with
electrolyte solution.
Durability and Handling
The sensors are relatively durable, except for the membrane sleeve. Exercise caution when handling any sensor
to avoid actions that could damage the sensor tip. Pay particular attention to the sensor membrane, because the
membrane is extremely delicate and improper handling will lead to damage. With proper care and by following the
instructions, a membrane sleeve should last more than one month.
Refer to the Probe Unpacking Instructions that came with your sensor for handling instructions.
CAUTION: Do NOT scratch the sensor membrane sleeve. Do NOT wipe the sensor membrane with anything,
even Kimwipes. If necessary, squirt it with distilled water or compressed air.
CAUTION: The sensor membrane is easily punctured if it comes into contact with sharp objects. For example,
do NOT let the stir bar come into contact with the sensor membrane.
Tip Care
The surface of the sensor tip is very sensitive. The tip of the sensor should never be handled as this will damage
the membranes and compromise the electrode’s selectivity for a particular species. During use the electrode
should be held securely, preferably using a micromanipulator or other similar device that permits accurate
positioning, such as WPI’s ProGuide electrode holder/positioner (WPI Part #47520, 47510, 47530, 47540).
The electrode should be cleaned periodically in distilled water and dried using soft tissue paper. Organic
contamination can be removed using a mild enzymatic detergent such as ENZOL (WPI #7363).
Cleaning the Membrane
The membrane sleeve itself requires very little maintenance. The primary concern is to avoid damage to the
membrane and to keep it as clean as possible. After each use the membrane should be cleaned by suspending the
tip in distilled water for 20-30 minutes to dissolve salts and remove particles which may have accumulated on it. If the
probe was used in a protein-rich solution, the tip should rst be soaked in a protease solution for several minutes to
remove protein build-up, and then in distilled water. Enzymatic detergent (for example, Enzol, WPI#7363) can also be
used.
Accumulated organic matter can be removed by briey immersing the tip in a 0.1M HCl or 0.1M NaOH (at times both
may be necessary) for 10 seconds.
A good indication of a dirty membrane sleeve is a sluggish response or an unusually low sensitivity. If these problems
are not rectied by cleaning, then the membrane sleeve should be replaced.
The sensors cannot be used in organic solvents.
Sterilizing the Membrane
The membrane sleeves can be sterilized chemically using an appropriate disinfectant (for example, Cidex, WPI#7364).
CAUTION: Do not use alcohol on the sensor.

TBR4100/1025
WORLD PRECISION INSTRUMENTS 9
Replacing the Membrane Sleeve
Even with the best of care and proper maintenance, the membrane sleeve will eventually need to be replaced.
1. Unscrew the locking cap from the handle.
2. Hold the stainless steel sleeve and remove it and the locking cap from the internal electrode assembly, being
careful not to bend the internal electrode assembly when doing so.
3. Rinse the internal electrode with distilled water (particularly the tip) and let it soak for at least 15 minutes. Be
careful not to let water get up into the handle.
4. Gently dry the electrode with a soft tissue (Kimwipes). Be sure to dry thoroughly the at surface at the tip of
the electrode. After drying the current should stabilize fairly quickly to a low value (for example, 0 - 20pA). If this
occurs, it is a good indication that the electrode is functioning properly.
5. If the electrode is not clean, repeat steps 3 and 4.
6. Remove the locking cap from the old used sleeve, and gently slide it onto the new replacement sleeve. Filling a
single 2mm sensor sleeve requires about 1mL of electrolyte.
7. Dip the internal electrode 1-2cm into the electrolyte. The current will rise rapidly oscale. Using the MicroFil™
nonmetallic syringe needle (WPI #MF28G67-5) and 1mL plastic syringe (included in the Startup kit) inject
approximately 100µL of electrolyte lling solution directly into the new sleeve, starting about half way down the
sleeve and drawing the MicroFil out of the sleeve as it lls. The lling process should be performed slowly enough
so as not to create turbulence, which could introduce air bubbles into the electrolyte. The MicroFil (#MF28G67)
supplied in the startup kit is less than the length of the sleeve, so that it will not puncture the delicate membrane
at the tip of the sleeve during injection.
TIP: If air bubbles form in the electrolyte, gently ick or tap the side of the sleeve to remove the bubbles.
8. Slowly and smoothly insert the electrode into the sleeve, and screw the locking cap into the handle. The
electrode should be observed to press gently against the membrane (Fig. 6).
The internal electrode tip
should protrude slightly
out into the membrane.
Fig. 6—Membrane placement. The internal electrode tip should protrude slightly out into the membrane.
9. The current displayed on the meter at this time will be high or oscale.
10. Suspend the tip of the newly assembled probe in the calibration solution.
11. After 10-15 minutes the current should no longer be oscale and will gradually decrease with time. It may take
several (up to 12) hours for the sensor current to reach a low stable value, at which time it will be ready for use.
TIP: The integrity of the new membrane can be determined by immersing the probe tip into a strong saline
solution (1M). If the current increases dramatically or is oscale then the membrane integrity is not good and a
new membrane will have to be tted.

TBR4100/1025
10 WORLD PRECISION INSTRUMENTS
OPERATING INSTRUCTIONS
Setup and Calibration of NO Sensors
Initial Setup
Plug the nitric oxide (NO) sensor into the input connector on the bottom of the required input channel on the
TBR4100/1025. Set the correct poise voltage for nitric oxide by selecting “NO” on the Applied Voltage Control for the
channel you are using. Set appropriate gain. For most sensors or applications, the 10nA range is appropriate. Be sure
to give the sensor enough time to polarize before beginning the calibration.
Calibration of the NO Sensor
Accurate measurements of NO require an accurate calibration. Three calibration methods are described in this
section.
• The rst and most convenient method is based on a simple chemical reaction which generates known amounts
of NO (from NO-2 ). This method can only be used with the 2.0mm sensor (WPI #ISO-NOP).
CAUTION: This method uses H2SO4 (sulfuric acid) and can only be used with the 2mm sensor. Use of this
method with solid state (dry) NO sensors will cause irreparable damage.
• The second method is based on the decomposition of the S-nitrosothiol NO-donor (SNAP) using either CuCl
as described in Method 1 or CuCl2 as outlined in Method 2, as a catalyst. The NO liberated from SNAP is used to
calibrate the sensor.
• The third method involves preparing aqueous solutions of NO from saturated NO solutions prepared with NO
gas.
WARNING: THIS METHOD USES NO GAS WHICH CAN BE FATAL IF IT IS MISHANDLED.
Calibration Kit
Perform the calibration using the NO calibration kit (WPI catalog #5435) which consists of the following items:
Plastic stand with two holes, two glass vials, two silicon septums without holes, two silicon septums with holes and
radial slit, one short needle, one long needle.
The chemicals required for the calibration are not provided.
NOTE: The NO chamber (WPI#NOCHM) can be used as an alternative to the use of the calibration kit. Designed
specically for use with 2.0mm electrodes, the chamber can be adapted to other probes. Calibration temperatures
from 4 - 40°C can be controlled using an external circulating bath.
Calibration by Chemical Generation of NO
Type of NO sensor that can be calibrated with this method: ISO-NOP
This method is recommended for use ONLY with the 2.0mm sensor (WPI #ISO-NOP).
The rst step is to prepare the following two solutions:
Solution #1: 0.1M H2SO4 + 0.1 M KI
To make 500mL of solution requires:
4.9g of H2SO4 (2.7mL of concentrated H2SO4 {18.4 M})
8.3g of KI

TBR4100/1025
WORLD PRECISION INSTRUMENTS 11
Slowly add the sulfuric acid to about 400mL of distilled water while stirring. Then add the KI and mix; nally add
distilled water to a nal volume of 500mL.
Solution #2: 50µM KNO2 (or NaNO2)
The recommended method for preparing this solution is to purchase an ion chromatography liquid nitrite standard
(NaNO2 or KNO2) which may be diluted as appropriate. Standard Nitrite is available from WPI (#7357).
Alternatively, crystalline reagent KNO2 may be used, but you should note that KNO2 is extremely hygroscopic and
degrades once exposed to atmospheric moisture. It is therefore recommended that if the crystalline reagent is to
be used that the reagent packaged under argon be purchased (available from Eastman Kodak Chem #105 7462),
and that it be stored in a desiccator. While this will extend the life of the reagent, it will need to be replaced more
frequently than will the liquid standard. The standard nitrite solution prepared from this compound should be stored
in a gas-tight bottle and refrigerated.
This method of calibration is based on the following reaction:
2KNO2 + 2KI+ 2H2SO4 --> 2NO+ I2 + 2H2O+ 2K2SO4
where a known amount of KNO2 is added to produce a known amount of NO. The quantity (and so the concentration)
of NO generated can be calculated directly from the stoichiometry if the concentrations of the reactants are known.
Since KI and H2SO4 are present in great excess the limiting reagent is KNO2. Experiments have demonstrated that
the nitric oxide generated from this reaction will persist suciently long to calibrate the NO sensor easily and
accurately Since the reaction goes to completion, the equation above states that the ratio between KNO2 and NO
is 1:1. Therefore the amount of NO generated in the solution will be equal to the amount of KNO2 added. The nal
concentration of NO will be equal to the diluted concentration of KNO2 in the solution.
Calibration Procedure
1. Allow the sensor to polarize according to the times shown in Appendix A, Table 6, page 38.
2. Record the value of the sensor current before removing it from the distilled water in which the tip has been
immersed during storage.
3. Immerse the ISO-NOP sensor tip in a strong saline solution (1M), and after waiting a few minutes for the current
to stabilize record its value. If the current is oscale or unstable after several minutes in solution, it is likely that
the membrane has been damaged and the sleeve needs to be changed (refer to the section on "Replacing the
Membrane Sleeve" on page 9“).
4. Place a magnetic stirring bar into one of the glass vials included in the calibration kit. Pipette an appropriate
volume (for example,10mL) of solution #1 into the vial. This volume will be used later in the calculation of the nal
concentration of NO in solution.
5. Allow the sensor to polarize until the current reaches a steady baseline value. This may take up to 12 hours. The
baseline current should settle somewhere between 1000-8000 pA on average. If the value exceeds 8000pA, see
“Replacing a Membrane Sleeve,” page 28.
Note: The calibration should be carried out at the same temperature at which the experimental measurements
of NO are to be made. This can be accomplished by placing the vial and stand in a water bath at the appropriate
temperature, and allowing the temperature of the solution in the bottle to equilibrate with the water bath.
6. Place the stand (and water bath, if appropriate) on the magnetic stirrer, and turn on the stirrer so that the bar is
stirring at a moderate rate. This rate should not be modied once it is set.
7. Secure the ISO-NOP sensor in an electrode holder such as WPI’s Pro-Guide or a micromanipulator (or use one
of the septa included with the start-up kit). Do not push the sensor tip through the hole — slide the electrode
laterally through the sliced side of the septum. Carefully lower the sensor into the vial sealing the opening with
the septum. The sensor tip should be immersed about 2-3 mm into the solution, and should not be in contact
with stir bar. Be very careful when inserting the sensor not to make contact between the cap and/or bottom of
the jar with the tip of the sensor, because this could damage the membrane.

TBR4100/1025
12 WORLD PRECISION INSTRUMENTS
8. Wait until the current on the display becomes stable again before continuing. This may take several minutes if the
sensor has undergone a large temperature change.
9. If you feel it necessary to de-gas Solution #1 prior to calibration, this can be done by inserting one of the long
stainless steel needles included with the calibration kit through the septum so that the tip is in the solution.
Attach the needle through appropriate tubing to a source of pure argon gas (nitrogen may also be used). Insert
one of the short needles included with the kit through the septum such that the needle tip is clearly exposed
(not in the solution) inside the vial. The small needle allows gas to escape, thereby avoiding a buildup of pressure.
Purge the solution at low pressure (5PSI or less) for 15 minutes.
10. Once purging is complete and the gas source is turned o, remove the purging and pressure relief needles.
11. Allow a few minutes for the temperature to equilibrate with the water bath again since purging with the gas may
have changed the temperature.
12. Once a stable baseline is re-established, record the value. The quiescent baseline current is an indicator of the
health of the sensor.
13. Generally, it is not necessary to pre-purge the calibration solution, since the NO decays only very slowly in this
solution.
Creating a Calibration Curve
To create a calibration curve, measure the dierence in current (pA) generated by the addition of known quantities of
KNO2 to the calibration solution. Typically, quantities are added in succession, and each quantity is twice the amount
of the previous addition. A standard protocol might include four successive additions of KNO2. For example, 5nM,
10nM, 20nM, 40nM.
Once the baseline has been set to zero, generate a known concentration of NO in the solution by adding a known
volume of a the NO standard (solution #2). For example:
Addition 1:
Add 50µL of solution #2 to 10mL of solution #1. Then the amount of NO produced can be calculated by simple
dilution factors, as follows:
50µL of 50µM KNO2 (solution #2) into 10mL solution #1 = 1:201 dilution. Hence, amount of NO produced = 50 (µM) ÷
201 = 0.2487µM= 249nM.
Addition 2:
• 100µL of solution #2 added to the above solution will produce 493nM NO (for example, dilution factor = 1:101.5).
• The output from the TBR4100/1025 will look similar to the example shown in Fig. 5. Here three sequential
additions of KNO2 have been made to solution #1.
• From this output a calibration curve can then be created by plotting the changes in current (pA) against the
changes in concentration (nM). The slope of this curve indicates the sensitivity of the probe.
• Once the sensitivity of the probe has been ascertained (in the above example the sensitivity was 1.557pA/nM) the
sensor is ready to use experimentally.

TBR4100/1025
WORLD PRECISION INSTRUMENTS 13
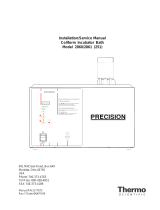
Fig. 7—Calibration Curve
Fig. 8—Calibration Output
[NO] nM Response (pA)
0 0
249 332
493 746
966 1486
Calibration of NO Sensor by Decomposition of SNAP
This method can be used to calibrate all NO sensors (see Zhang, et al., “Novel Calibration Method for Nitric Oxide
Microsensors by Stoichiometrical Generation of Nitric Oxide from SNAP” Electroanalysis, 2000, 12: 6).
S-nitroso-N-acetyl –D,L-penicillamine (SNAP) is a stable NO-containing compound that can be used for quantitative
generation of NO in solution. SNAP decomposes to NO and a disulde byproduct when dissolved in water. However,
the rate of decomposition of SNAP is very slow. The kinetics controlling the decomposition of SNAP depend on
several parameters including pH, presence of catalyst, temperature and light.
In the procedure described here, SNAP is used in combination with a catalyst to generate known amounts NO in
solution which can then be used to accurately calibrate various NO sensors. The protocol does not investigate all
parameters involved in SNAP decomposition, nor is it intended to propose a model by which SNAP is decomposed.

TBR4100/1025
14 WORLD PRECISION INSTRUMENTS
Two methods are described here for the calibration of NO sensors based on decomposition of SNAP. The rst
method relies on the use of CuCl (cuprous chloride) as a catalyst for the 100% conversion of SNAP into NO. This
method is extremely accurate but technically more demanding than the second method, which relies on the use of
CuCl2 (cupric chloride) for the partial but quantiable conversion of SNAP to NO.
Method 1: Calibration by Decomposition of a S-nitrosothiol Compound Using CuCl as a
Catalyst
This method of calibration results in the 100% conversion of SNAP to NO. The amount of NO produced, therefore, is
based on the nal concentration of SNAP.
CAUTION: The described calibration procedure requires the use of cuprous (I) chloride, CuCl, where CuCl is the
active catalyst for the conversion of SNAP to NO. The calibration curve assumes only the presence of CuCl and
hence a 100% conversion eciency of SNAP to NO (see “A novel method to calibrate nitric oxide microsensors
by stoichiometrical generation of nitric oxide from SNAP”, X. Zhang, et. al., Electroanalysis, 2000, 12(6),425-428).
However, in the presence of oxygen CuCl is readily oxidized to CuCl2. This will happen naturally if the compound is
exposed to air and/or there is inadequate storage of CuCl. The oxidation product CuCl2 is much less ecient at
catalyzing the conversion of SNAP to NO, and this would appear during calibration as an apparent low sensitivity of
the electrode to NO.
Since CuCl is readily oxidized to CuCl2 special precautions must be taken to keep it in its reduced state prior to any
calibration. It is recommended that CuCl be stored under inert conditions and if used in solution then the solution
must be degassed with inert gas and absent of all oxygen.
NOTE: If your laboratory is not adequately equipped to satisfy the conditions for storage and use of CuCl please refer
to the Method 2, page 18, which describes a similar calibration procedure based on the use of cupric (II) chloride
CuCl2, in which CuCl2 is the active catalyst for the conversion of SNAP to NO.
Getting Started
Prepare the following solutions:
#1—Saturated solution of cuprous chloride: This should be prepared by adding 150mg CuCl to 500mL distilled
deoxygenated water. The distilled water can be deoxygenated by purging with pure nitrogen or argon gas for 15 min.
The saturated CuCl solution will have a concentration of approximately 2.4mM at room temperature and should be
kept in the dark prior to use.
#2—Standard SNAP solution: To prepare the standard solution of SNAP, weigh approximately 5.0mg +/- 2.0mg of
SNAP and add it to solution #1. Calculate the molarity of SNAP solution.Decomposition of SNAP in the stock solution
proceeds very slowly due to the presence of chelating reagent, EDTA. Thus the rate of decomposition is negligible and
the stock solution of SNAP remains relatively stable for at least 5 hours if kept in refrigerator.
NOTE: The purity of standard reagent, SNAP, is very important for the reported data. Use high grade SNAP with purity
of 95% or better. SNAP can be purchased from WPI (#SNAP25, SNAP50, SNAP100).
Quantity WPI Part #
25 mg vial SNAP25
50 mg vial SNAP50
100 mg vial SNAP100
TIP: For complete instructions on making standard 100mM SNAP and calculating the molarity of SNAP solution, see
Appendix B, page 39.
Calibration Procedure
Within a nitrogen or argon environment, place 10.0mL of solution #1 (CuCl) in a 20mL vial (supplied in the ISO-NOP
calibration kit). Drop a small stirring bar into the solution, and place the vial on a magnetic stirring plate. Immerse a
NO probe into this solution and, while stirring, allow the sensor to polarize until the background current stabilizes.
Minimal drift is normally in 3-5 minutes, although expected baseline current values are dierent for each sensor. See
the (Appendix A, Table 6, page 38.) As soon as the background current as observed on the TBR4100/1025 meter
becomes stable you can begin to record the current output on the Lab-Trax or other data system.

TBR4100/1025
WORLD PRECISION INSTRUMENTS 15
Next, inject 3 aliquots containing 5µL, 10µL and 20µL sequentially of the SNAP stock solution (solution #2) into the vial
containing cuprous chloride solution. Depending on the required calibration range (for example, the nal amount of
NO produced) desired, the volumes of SNAP stock solution could be increased to produce a greater concentration of
NO. It is recommended that calibration range be kept close to the anticipated experimental concentration of NO.
Immediately following the rst addition of SNAP into Solution#1 the current (pA) output from the ISO-NO will be seen
to increase rapidly. Within a few seconds the response will reach a plateau and the second aliquot of SNAP can then
be added. Successive additions of the remaining aliquots of SNAP can be made in a similar way.
A calibration curve can be constructed by plotting the signal output (pA) vs. concentration (nM) of SNAP. Each addition
of SNAP corresponds to equivalent NO concentration. The response should be very linear from 10 to 1000nM. The
sensitivity of the NO probe can be established from the gradient or slope of the response curve. The sensitivity of the
ISO-NOP sensor is about 1pA/nM. After the sensitivity of the NO probe is established, the LabScribe software can be
programmed to display data in either concentration directly (for example, nM, mM) or redox current (for example,
pA, nA).
NOTE: Remember that most NO probes are sensitive to temperature changes. It is therefore recommended that the
calibration of a NO sensor is performed at the experimental temperature.
Method 2: Calibration by Decomposition of SNAP Using CuCl2 as a Catalyst
This method of calibration relies on the use of CuCl2 for the partial but quantiable conversion of SNAP to NO.
This procedure can be used as an alternative to the previous method in which CuCl is the active catalyst for the
conversion of SNAP to NO. In this procedure CuCl2 (natural form–copper (II) chloride dihydrate) is substituted as a
catalyst for ease-of-handling (Sigma Aldrich part number: 307483-500G).
NOTE: Experimentally it has been shown that CuCl2 is less ecient as a catalyst in the conversion of SNAP to NO (for
example, conversion ratio is reduced to approximately 60%). The accuracy of the calibration may also be reduced.
S-Nitriso-N-acetyl-D,L-penicillamine (SNAP) is a stable NO-containing compound that can be used for quantitative
generation of NO in solution. SNAP decomposes to NO and a disulde byproduct when dissolved in water. However,
the rate of decomposition is very slow. The kinetics of decomposition for this reagent is a function of several
parameters including pH, presence of a catalyst, temperature and light.
In the procedure described here, SNAP is used in combination with a catalyst, cupric (II) chloride (CuCl2), to generate
a known quantity of NO in solution. Note that this protocol does not investigate the eects of all parameters involved
in SNAP decomposition nor does it propose a model by which NO is decomposed. The presented procedure provides
an empirical estimation of the amount of generated NO based on the molarity of a standard stock solution of SNAP
under a controlled set of parameters.
Getting Started
Prepare the following solutions:
Solution #1: Dissolve 5mg EDTA in 250mL of water (HPLC grade).
Solution #2: Prepare 250mL 0.1M cupric (II) chloride in distilled water.
Preparing Standard SNAP Solution
To prepare the standard solution of SNAP, weigh approximately 5.0mg +/- 2.0mg of SNAP and add it to solution #1.
Calculate the molarity of SNAP solution. Decomposition of SNAP in the stock solution proceeds very slowly due to
the presence of chelating reagent, EDTA. Thus the rate of decomposition is negligible and the stock solution of SNAP
remains relatively stable for at least 5 hours if kept in refrigerator.
NOTE: The purity of standard reagent, SNAP, is very important for the reported data. Use high grade SNAP with purity
of 95% or better. SNAP can be purchased from WPI (#SNAP25, SNAP50, SNAP100).
TIP: For complete instructions on making standard 100mM SNAP and calculating the molarity of SNAP solution, see
Appendix B, page 39.

TBR4100/1025
16 WORLD PRECISION INSTRUMENTS
Calibration Procedure
Place 10.0mL of solution #2 in a 20mL vial (supplied in the calibration kit). Drop a small stirring bar into the solution,
and place the vial on a magnetic stirring plate. Immerse a NO probe into this solution, and while stirring, allow the
background current to stabilize. The appropriate time for stabilization depends on the model of the sensor. Refer to
the Appendix A, Table 6, page 35 for suggested times. As soon as the background current becomes stable start the
recording.
Next, sequentially inject three aliquots of SNAP solution, 5µL, 10µL, and 20µL, into the vial containing copper chloride
solution. The current output will rapidly increase upon addition of rst aliquot and will reach a plateau within a few
seconds. Inject the second aliquot, 10µL, as soon as the rst signal reaches a plateau. Finally add the third aliquot
as the second signal reaches its plateau. If aliquots are not added promptly when reaching the previous plateau, the
signal will slowly decline because generated NO is quickly oxidized to nitrite and nitrate which will not be detected by
the probe.
NOTE: You can adjust the volume of injected aliquots according to the concentration of SNAP stock solution.
Decrease the volume of aliquot if electrode is very sensitive or increase the volume of aliquot if the electrode is less
sensitive.
Because NO sensors can be calibrated in a linear fashion, the magnitude of every signal should almost double as
the volume of SNAP solution added is doubled in the course of the calibration. Use the recorded data to construct a
calibration curve. The calibration curve can be simply constructed by plotting the signal output (for example, in pA) vs.
the concentration of SNAP added at that time. Note that every addition of SNAP solution corresponds to a particular
NO concentration. This will be discussed below. After the sensitivity of the NO probe is established, the LabScribe
software can be programmed to display data in either concentration directly (for example, nM, mM) or redox current
(for example, pA, nA).
The standard SNAP solution can be used for the calibration of NO probes throughout the day. Store the solution
in the dark and refrigerate when not in use. Prepare a fresh stock solution of SNAP in the beginning of every day
to ensure minimal decomposition of SNAP in the stock solution. Concentration of SNAP decreases to 5-10% of its
nominal value after approximately 4-5 hours.
NOTE: Remember that most NO probes are sensitive to changes in temperature. It is therefore recommended that
the calibration of your sensor is performed at a constant experimental temperature.
Predicting the Level of Detectable NO According to the Molar Ratio of SNAP in the
Presence of Catalyst (Method II)
Experiments have shown that SNAP is decomposed instantaneously under the following set of experimental
conditions:
Temperature 25°C
Catalyst solution 0.1M copper chloride
SNAP WPI, 98% purity. Fresh stock solution with 5 mg/250 mL solution EDTA added.
Copper chloride is at equilibrium with ambient air (aerobic conditions).
SNAP (RSNO) decomposes to NO and a disulde byproduct according to the following equation:
2 RSNO=>2NO + RS –SR
Theoretically, the concentration of generated NO should be equal to the nal concentration of SNAP in the copper
chloride solution in the calibration vial if the decomposition goes to completion and if the generated NO is detected
quickly before it is oxidized to nitrite and nitrate.
However, it is expected that the level of detectable NO will be below the theoretical value because the copper
chloride solution is at equilibrium with ambient air, and consequently a portion of the generated NO would have
been immediately oxidized to nitrite and nitrate before it was measured by the NO sensor. In addition, it is possible
that decomposition of SNAP does not go to completion even in the presence of a catalyst. Results on the kinetics of
SNAP decomposition in the presence of a catalyst in an anaerobic environment are published elsewhere (Zhang et
al., “Novel Calibration Method for Nitric Oxide Microsensors by Stoichiometrical Generation of Nitric Oxide from SNAP”,
Electroanalysis, 2000, 12: 6).
/