Page is loading ...

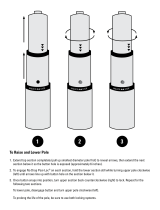
Figure 5 – Folding Antenna Mast and Release Button
NaviTrack II Modes
The NaviTrack II operates in three distinct modes. They
are:
1. Sonde Mode, used for locating Sondes in pipes,
conduits, or tunnels that are non-conductive or cannot
otherwise be traced.
2. Active Line Trace Mode, used when a chosen fre-
quency can be put onto a long conductor using a line
transmitter, for locating conductive pipes, lines or
cables.
3. Passive Trace Mode, used for tracing electrical lines
that are already carrying 60 Hz current (U.S.) or 50 Hz
current (Europe).
Note that the two Tracing modes, Active and Passive,
are identical except for the frequencies used. No trans-
mitter is used in Passive Trace mode.
Display Elements
Beginning operators or experienced operators can use
the NaviTrack II with equal ease. While the NaviTrack II
offers advanced features that make the most complex lo-
cate easier, many of its features can be turned off or hid-
den to make the display simpler when doing basic
locating in uncomplicated situations.
The “basic features” of the NaviTrack II are on by default.
They can be customized easily to suit the user’s re-
quirements. The use of the various elements displayed
is covered in separate later sections of the manual.
Ridge Tool Company
7
NaviTrack
®
II
Introduction to the NaviTrack II
Installing/Changing Batteries
To install batteries into the NaviTrack II turn the unit over
to access the battery compartment. Turn the knob on
the battery cover counter-clockwise. Pull straight up on the
knob to remove the door. Insert the batteries as shown on
the inside decal and make sure they drop to full contact.
Fit the door into the case and turn the knob clockwise
while lightly pressing down to close. The battery cover
can be installed in either orientation.
Figure 4 – Battery Case
When the NaviTrack II is powered on, it takes a few sec-
onds to check the batteries. Until then the battery level will
show as “empty”.
Do not allow debris or moisture into bat-
tery compartment. Debris or moisture may short the
battery contacts, leading to rapid discharge of the bat-
teries, which could result in electrolyte leakage or
risk of fire.
Folding Mast
To begin operation, unfold the antenna mast and lock the
folding joint into place. When locating is complete, press
the red release lever to fold the antenna mast for storage.
NOTE! Avoid dragging the lower antenna node on the
ground while locating with the NaviTrack II. It
may cause signal noise which will interfere with
results, and may eventually damage the an-
tenna.
CAUTION
Release Button
IMPORTANT! Do not snap or whip the NaviTrack II
mast to open or close it. Open it and
close it by hand only.

Ridge Tool Company
8
NaviTrack
®
II
Common Display Elements
Figure 6 – Common Display Elements
The display screen in Sonde, Active Line Trace or Passive
Line Trace mode will show the following features:
Signal Angle Indicator – Angle toward the
field’s center graphically displayed; numeric value dis-
played below the graphic.
Battery Level – Indicates level of battery power.
Measured Depth/Distance – Displays the mea-
sured depth when receiver is touching the ground directly
over signal source. Displays computed distance when
the antenna mast is pointed at signal source in some
other manner. Displays feet/inches (U.S.A. default) or
meters (European default).
NOTE! Measured Depth is a
computed
number which
may vary from the physical depth or distance
depending on field strength and distortion.
Frequency – Shows current frequency setting in hertz or
kilohertz.
Mode – Icon for Sonde , Line Trace , or Passive
Line Trace mode.
+ Crosshair (Map Center) – shows your position rela-
tive to the target center.
Active View Area – The area within the circle in the cen-
ter of the operating screen, in which Sonde and Pole
icons, Tracing and Distortion lines appear.
Display Elements: Sonde Mode
Figure 7 – Display Elements: Sonde Mode
Signal Strength – Strength of signal as sensed by
the lower Omnidirectional antenna.
| | Pipe Direction – Represents the approximate di-
rection of the pipe in which the sonde is lying.
Sonde Icon – Appears when approaching the loca-
tion of a Sonde.
Equator – Represents the mid-line of the
Sonde’s field perpendicular to the axis of the Poles.
(See on page 14.)
Pole Icon – Represents the location of either of the
two Poles of the Sonde’s dipole field.
(See on page 12.)
Display Elements: Active Line Trace Mode
Figure 8 – Display Elements (Line Trace Mode)
In Active Line Trace Mode the following features will
also be displayed:
Proximity Signal – A numerical indication showing
how close the signal source is to the locator. Displays
from 1 to 999 (Line Trace modes only).
Signal Strength – Strength of signal as sensed by
the lower Omnidirectional antenna.
Distortion Line (Upper Antenna Signal) – shows
the apparent direction of the field as detected at the
upper antenna. If out of alignment with the Tracing line,
indicates a distorted field.
Signal Angle
Indicator
Active
View Area
Crosshair
(Map
Center)
Measured
Depth/Distance
Battery
Level
Numeric
Horizontal
Angle
Indicator
Mode
Frequency
,
Pole Icon
Pipe
Direction
Sonde Icon
Equator
Signal Angle
Indicator
Proximity
Signal
Signal
Strength
Distortion
Line
(Dashed)
Tracing Line
(Solid)

Ridge Tool Company
9
NaviTrack
®
II
Tracing line (Lower Antenna Signal) – shows the
apparent direction of the field as detected at the lower
antenna.
Display Elements: Passive Trace Mode
The screen elements in Passive Trace Mode are the
same as those seen in Active Line Trace mode.
NOTE! Mode is determined by the type of target source
(Sonde or Line). For example, selecting the
512 Hz frequency from the Sonde mode section
of the frequency menu puts the SR-20 into
Sonde mode. (A frequency must be selected
from the correct category if it appears in more
than one category, such as 33 kHz).
Default Frequencies
The Master Frequency Menu contains a large set of fre-
quencies, but only some of these are made currently
available. They are made “Currently Available” by check-
ing them in the Master Frequency Menu,
as described on
page 23
. The frequencies which are currently available ap-
pear on the Main Menu when the Menu Key is pressed.
“Currently Available” frequencies can be checked in the
Main Menu, in which case they will appear when using the
Frequency Key. If they are unchecked in the Main Menu,
they will not appear when using the Frequency Key to
cycle through frequencies. Frequencies which appear in
the Main Menu and are checked for activation are called
“Checked-Active”.
Frequencies that are “Checked-Active” can be cycled
through simply by pressing the Frequency Key
(See Fi-
gure 9)
. A frequency chosen by pressing the Frequency
Key becomes the “In Use” frequency.
Currently available frequencies in default setting include:
Sonde Mode
• 512 Hz
Active Line Trace Mode
• 128 Hz
• 33 kHz
• 1 kHz
• 8 kHz
• 262 kHz
Passive Line Trace Mode
• 60 Hz (Power)
The use of these features is described in the Sonde
Locating, Active Line Tracing, and Passive Line Tracing
sections.
Keypad
Figure 9 – Keypad
Power ON/OFF – Powers NaviTrack II ON. Powers
the NaviTrack II down after a 3-second countdown. The
countdown can be interrupted before shutdown by press-
ing any key.
Up and Down Arrows – Used for locating choices
during menu selection; used for setting the Volume
Control when the Sound Key has been pressed.
Select Key – Used to make a choice during Menu
selection; in normal operation, used to force a Measured
Depth reading and re-center audio tone. Can be used to
force a depth display. Sets volume level in Sound menu.
Menu Key – Used to display a “tree” of choices in-
cluding frequency selections, display element choices,
brightness and contrast, and restoring default settings.
Within a menu, press to move up one level.
Volume Key – Used to raise or lower the volume
setting; will cycle the volume from current setting by
steps, increasing to maximum and then off. Pressing the
volume key opens the volume control panel if it is closed,
and closes it if it is open. Volume can also be raised and
lowered using the Up and Down Keys when in the
Volume control panel.
Frequency Key – Used to set the “In-Use” frequency
of the NaviTrack II from the set of checked-active fre-
quencies. The list of frequencies that have been set to
Checked-Active status can be modified via the Menu
Key. Frequencies are grouped into three sets: Sonde
Frequencies ( ), Line Trace Frequencies ( ) and
Power Frequencies ( ). Each press of the Frequency
Key cycles to the next Checked-Active frequency.
Light Sensor – Detects light levels and controls the
LCD backlight, which is set to come on under fairly
dark conditions. The backlight can be forced on by cov-
ering the sensor with your thumb.
Volume Control
Key
Down Key
Menu Navigation
Menu
Key
Select Key
Menu Item Select
Up Key Menu Navigation
Frequency Key
Light
Sensor
Power
ON/OFF
Key

Operation Time
Using alkaline cells, typical operation time is from about 12
to 24 hours depending on sound volume and how often
the backlight is on. Other factors that affect the operation
time will include chemistry of the battery (many of the new
high performance batteries, such as the “Duracell
®
ULTRA”
last 10% - 20% longer than conventional alkaline cells
under high demand applications). Operation at lower tem-
peratures will also reduce battery life.
The NaviTrack II display can also show random symbols
when the battery power is too low to drive the internal
logic circuits correctly. This is remedied by simply putting
fresh batteries into the unit.
To preserve battery life the NaviTrack II will automatically
shut down after one hour of no key presses. Simply turn
the unit on to resume use.
Low Battery Warning
When the battery gets low, a battery icon will appear
in the map area on the screen. This indicates that the bat-
teries need to be changed and that the unit will soon
shut down.
Figure 10 – Display Low-Battery Warning
Just before complete shut down, there will be a non-in-
terruptible power down sequence.
NOTE! Voltage on rechargeable batteries may some-
times drop so quickly that the unit will just shut
down. The unit will turn off and restart. Just re-
place the batteries and turn the unit back ON.
Starting Up
After pressing the Power Key on the keypad, the
RIDGID
®
logo displays, and the software version number
will appear on the left of the screen.
Ridge Tool Company
10
Figure 11 – Start-up Screen
In the European version, the screen will include a “CE”
logo:
Figure 12 – European Start-up Screen
Make a note of the software version in the box on
page 1
.
If technical support from Ridge is needed it will be helpful
to have it available.
Set Up
Once the NaviTrack II is up and running, the next step is
to set up the frequencies that match the Sonde, trans-
mitter, or line to be located.
Each frequency is selected for use by choosing it from a
list in the Main Menu. If the box on the Main Menu for that
frequency is checked, the frequency is in Checked-Active
status.
Checked-Active frequencies are already selected for
use and appear in sequence by pressing the Frequency
Key . (For example, the Sonde frequency of 512 kHz
is available by pressing the Frequency Key.)
Figure 13 – Sonde Frequency Selected With Frequency
Key
NaviTrack
®
II

Ridge Tool Company
11
Activating Frequencies
Frequencies can be chosen for the set of Checked-Active
frequencies so they will be available using the Frequency
Key . Frequencies can also be deactivated to keep the
frequency set smaller.
Each frequency is activated by choosing it from a list in the
Main Menu
(See Figure 15)
. Frequencies are grouped by
category:
Sonde
Active Line Trace
Passive Line Trace (Power)
1. Push the Menu Key:
Figure 14 – Menu Key
The Main Menu is then activated:
Figure 15 – Main Menu
2. Using the up and down arrows, highlight the fre-
quency desired. In
Figure 16
, below, the operator is
activating a 128 Hz frequency.
Figure 16 – Highlighting a Desired Frequency (128 Hz)
3. Press the Select Key
(shown below)
to check the box
for each frequency intended for use.
Figure 17 – Select Key
Figure 18 – Desired Frequency Checked
4. Frequencies that have been selected for use will
show a check in the box next to them. These are
“Checked-Active” frequencies.
5. Press the Menu Key again to accept the choices
and exit. The last selected Checked-Active frequency
will now be the “In-Use” frequency.
Figure 19 – Menu Key
The Main Menu lists all frequencies currently available for
activation. For information on adding additional frequen-
cies to the Main Menu so they can be chosen for activa-
tion,
see “Frequencies Selection Control” on page 23.
(European versions of the NaviTrack II include a 93 kHz
Line Tracing frequency.
See the note on page 17
on
using this frequency.)
NaviTrack
®
II

Ridge Tool Company
12
Sounds of the NaviTrack II
The sound level is driven by the proximity to the target.
The closer to the target, the higher the sound pitch will be.
A rising tone indicates increasing signal.
In Sonde Mode, if the sound level reaches its highest
point, it will “re-scale” to a medium level and continue sig-
naling from the new starting point.
In Sonde Mode the pitch will “ratchet” upward. That is, it
will rise and fall in pitch while approaching the Sonde.
Moving away from the Sonde, it will drop to a lower pitch
and remain there as long as one moves away from the
Sonde. Moving back toward the Sonde again it will re-
sume rising and falling starting from the level it had
reached previously. This serves as a guide to when you
are getting closer or further away from the Sonde.
In Line Trace or Passive Line Trace mode, sound is on
one continuous curve and does not re-scale.
If desired, force the sound to re-center at a medium
level (in any mode) by pressing the Select Key during
operation.
Sonde Locating
The NaviTrack II can be used to locate the signal of a
Sonde (transmitter) in a pipe, so that its location can be
identified above ground. Sondes can be placed at a
problem point in the pipe using a camera push rod or
cable. They can also be flushed down the pipe. A Sonde
is often used for locating non-conductive pipe and conduit.
The field of a Sonde is different in form than the circular
field around a long conductor such as a pipe or cable. It is
more like the field around the Earth, with a North Pole and
a South Pole.
NaviTrack
®
II
Figure 20 – Earth's Dipole Field
In the Sonde’s field, the NaviTrack II will detect the points
at either end where the field lines curve down toward
the vertical, and it will mark these points on the map dis-
play with a “pole” icon ( ). The NaviTrack II will also
show a line at 90 degrees to the Sonde, centered between
the Poles, known as the “equator”, much like the Equator
on a map of the Earth if the planet were viewed sideways.
Note that because of the NaviTrack’s Omnidirectional
antennas, the signal stays stable regardless of orientation.
This means the signal will increase smoothly approaching
the Sonde, and decrease smoothly moving away.
Figure 21 – Earth's Dipole Field Sideways
When locating a Sonde set up the locate in the fol-
lowing manner:
Activate the Sonde before putting it in the line. Select the
same frequency on the NaviTrack II and make sure it is
receiving the signal.
After the Sonde has been sent into the pipe, go to the
suspected Sonde location. If the direction of the pipe is
unknown, push the Sonde a shorter distance into the line
(~15 feet from the access is a good starting point).
Pole
Pole
Equator
Ground
IMPORTANT! Signal strength is the key factor in
determining the Sonde’s location. To
ensure an accurate locate take care
to maximize the Signal Strength prior
to marking an area for excavation.
The following assumes that the Sonde is in a hori-
zontal pipe, the ground is approximately level and the
NaviTrack II is held with the antenna mast vertical.
N
S

Ridge Tool Company
13
NaviTrack
®
II
Location Methods
There are three major parts to locating a Sonde. The
first step is to localize the sonde. The second part is
pinpointing. The third is verifying its location.
Step 1: Localize the sonde
• Hold the NaviTrack II so the antenna mast is pointing
outward. Sweep the antenna mast in the suspected di-
rection of the Sonde while observing the Signal
Strength and listening to the sound. The signal will be
highest when the antenna mast is pointing in the di-
rection of the Sonde.
• Lower NaviTrack II to its normal operating position
(antenna mast vertical) and walk in the direction of the
Sonde. Approaching the Sonde, the Signal Strength will
increase and the audio tone will rise in pitch. Use the
Signal Strength and the sound to maximize the signal.
• Maximize the Signal Strength. When it appears to be
at its highest point, place the NaviTrack II close to the
ground over the high-signal point. Be careful to hold the
receiver at a constant height above the ground, as dis-
tance affects Signal Strength.
• Note the Signal Strength and move away from the high
point in all directions. Move the NaviTrack II far enough
in all directions to verify that the Signal Strength drops
significantly on all sides. Mark the point of highest
Signal Strength with a yellow Sonde Marker (clipped to
antenna mast for convenience). This is the suspected
Sonde location.
Figure 22 – Poles and Equator of a Sonde
If while “getting closer” the Equator appears on the screen
follow it in the direction of an increasing Signal Strength to
localize the Sonde.
If a Pole appears before the Equator appears, localize the
Sonde by centering the Pole in the cross-hairs.
Step 2: Pinpoint the Sonde
The Poles should appear on either side of the max-
imum signal point, an equal distance on either side if the
Sonde is level. If they are not visible on the screen at the
point of maximum Signal Strength, move from the max-
imum point perpendicular to the dotted line (Equator)
until one appears. Center the locator over the Pole.
Where the Poles occur depends on the Sonde’s depth.
The deeper the Sonde, the further away from it the Poles
will be.
The dotted line represents the Equator of the Sonde. If the
Sonde is not tilted, the Equator will intersect the Sonde at
maximum Signal Strength and minimum Measured Depth.
NOTE! Being on the Equator does not mean that the
locator is over the Sonde. Always verify the
locate by maximizing Signal Strength and
marking both Poles.
• Mark the first Pole location found with a red triangular
Pole marker. After centering on the Pole, a double-line
indicator will appear. This line represents how the
Sonde is lying underground, and in most cases also
represents the pipe’s approximate direction.
• When the locator gets close to a Pole, a zoom ring will
appear centered on the Pole, allowing precision cen-
tering.
• The second Pole will be a similar distance from the
Sonde location in the opposite direction. Locate it in the
same manner and mark it with a red triangular marker.
• If the Sonde is level, the three markers should be
aligned and the red Pole markers should be similar dis-
tances from the yellow Sonde marker. If they are not,
a tilted Sonde may be indicated.
(See “Tilted Sonde”
on page 14)
. It is generally true that the Sonde will be
on the line between the two Poles, unless there is
extreme distortion present.
Step 3: Verify the locate
• It is important to verify the Sonde’s location by cross-
checking the receiver’s information and maximizing
Signal Strength. Move the NaviTrack II away from
the maximum Signal Strength, to make sure that the
signal drops off on all sides. Make sure to move the
unit far enough to see a significant signal drop in each
direction.

Figure 23 – Sonde Locate: Equator
• Double-check the two Pole locations.
• Notice that the Measured Depth reading at the maxi-
mum Signal Strength location is reasonable and con-
sistent. If it seems far too deep or too shallow, recheck
that there is an actual maximum Signal Strength at that
location.
• Notice that the poles and the point of highest Signal
Strength lie on a straight line.
It doesn’t matter whether you locate the Poles first, and
then the Equator, or the Equator first, and then the Poles,
or one Pole, then the Equator, and then the other Pole.
You can even locate the Sonde using just the Signal
Strength, and then verify your result with the Poles and
Equator. What is important is that you verify all the data
points, and mark the Sonde’s position where the signal is
highest.
Tilted Sondes
If the Sonde is tilted, one Pole will move closer to the
Sonde and the other farther away so that the Sonde lo-
cation no longer lies midway between the two Poles. The
Signal Strength of the nearer Pole becomes much
higher than that of the more distant Pole if the Sonde is
vertical (as it could be if it fell into a break in the line);
however, it can still be located.
If the Sonde is
vertical
what is seen on the screen is a
single Pole at the point of maximum Signal Strength.
(The RIDGID Floating Sonde is designed to have a
Ridge Tool Company
14
NaviTrack
®
II
single Pole “visible” and is weighted to maintain the
Sonde on a vertical axis.
See Note below
.)
It is important to realize that a severely tilted Sonde
can cause the Pole locations and the Equator to appear
offset because of the angle of the Sonde; but maximiz-
ing the Signal Strength will still guide to the best location
for the Sonde.
Floating Sondes
Some Sondes are designed to be flushed or to drift down
a pipe pushed by water flow. Because these Sondes
swing much more freely than a torpedo-shaped Sonde in
a pipe, they can be oriented any which way. This means
the Equator may be distorted by tilting, and the location of
the Poles may vary. The only guarantee of having located
a floating Sonde is maximizing the Signal Strength and
double-checking that the signal falls away on every side
of the maximum signal location.
NOTE! If a Sonde is moving, it may be easier to “chase”
a pole and then pinpoint the actual position of
the Sonde after the Sonde has stopped moving.
Measuring Depth (Sonde Mode)
The NaviTrack II calculates Measured Depth by com-
paring the strength of the signal at the lower antenna to
the upper antenna. Measured Depth is approximate; it will
usually reflect the physical depth when the mast is held
vertical and the bottom antenna is touching the ground di-
rectly above the signal source,
assuming no distortion is
present.
1. To measure depth, place the locator on the ground,
directly above the Sonde.
2. Measured Depth will be shown in the lower left hand
corner of the NaviTrack II’s display screen.
3. A Measured Depth reading can be forced by pressing
the Select Key during a locate.
4. Measured Depth will be accurate only if the signal is
undistorted.
Clipping (Sonde Mode)
Occasionally the Signal Strength will be strong enough
that the receiver will be unable to process the entire sig-
nal, a condition known as “clipping”. When this occurs a
warning symbol will appear on the screen. It means
that the signal is particularly strong.
NOTE! Measured Depth Display is disabled under
clipping conditions.
IMPORTANT! Remember that being on the Equator
does not mean one is over the Sonde.
Seeing two Poles aligned on the dis-
play is not a substitute for centering
over each Pole separately and mark-
ing their locations as described
above.
If the Poles are not visible, extend the search.
For best accuracy use the bubble level. The mast
MUST be vertical when marking the Poles and
Equator, or their locations will be less accurate!

Ridge Tool Company
15
NaviTrack
®
II
Figure 24 – Screen Display in Different Locations (Sonde)
On the 1" Pole On the Equator Approaching the 2nd Pole

Ridge Tool Company
16
Line Tracing
Active Line Tracing
In active line tracing, underground lines are energized
with a line transmitter. This active signal is then traced
using the NaviTrack II. A line transmitter is different
from a Sonde in that it is used for tracing an energized
line, rather than acting as a target for a locate the way a
Sonde does. Line transmitters energize lines by direct
connection with clips, by directly inducing a signal using
a clamp, or by inducing the signal using inductive coils
built in to the transmitter.
1. Energize the line according to the manufacturer’s
instructions. Select the transmitter frequency.
DANGER
Connect both ends of the transmitter leads before
turning the transmitter on, to avoid electric shock.
Set the frequency used on the NaviTrack II to the same
frequency used on the transmitter. Be sure it has a line
trace icon.
Push the Menu button to return to the operating screen.
Figure 26 – Line Trace Frequency Chosen with the
Frequency Key
(This screen will flash briefly when a new frequency is
chosen)
2. Observe the Proximity Signal and Signal Strength to
ensure the NaviTrack II is picking up the transmitted
NaviTrack
®
II
Normal
Tilted
Maximum Signal Strength
Figure 25 – Tilted Sonde, Poles and Equator
Note the Pole on the right is closer to the Equator, due to tilt.

Ridge Tool Company
17
signal.
(See Figure 27 below)
. The signal should
peak over the line and drop off on either side. The
Signal Angle indicator will be near zero when the
NaviTrack II is directly above the line.
Figure 27 – High Probability Locate
3. When tracing, the direction the pipe or cable is run-
ning will be shown on the screen with 2 lines, one
solid and one dashed. The solid line (the Tracing
line) is the signal as seen by the lower antenna node
and the dashed line (the Distortion Line) is the signal
as seen by the upper one.
(See Figure 27.)
4. The Tracing line has three important functions. It
represents the location, and the direction, of the sig-
nal being traced. It reflects changes in direction of the
target utility — when the utility makes a turn, for ex-
ample. And it helps recognize signal distortion, when
compared to the dashed line — if something is inter-
fering with the signal and distorting its shape, the
dashed line could be significantly offset or skewed.
5. Use the Proximity Number, Signal Strength, and
Tracing and Distortion lines to guide the line trace.
These three pieces of information are generated
from discrete signal characteristics to help the oper-
ator discern the quality of the locate. An undistorted
signal emitted from a line is strongest directly over that
line. By maximizing the Proximity Signal, and cen-
tering the Tracing and Distortion lines on the screen
the confidence in a “good” locate is high. Confirm a lo-
cate by testing whether the Measured Depth reading
is stable and reasonable.
Testing for the consistency of the Measured Depth read-
ing can be done by raising the NaviTrack II a known dis-
tance (say, 12" exactly) and observing whether the
Measured Depth indicator increases by the same amount.
Small variation is acceptable, but if the Measured Depth
does not change, or changes drastically, it is an indication
of a “distorted” field, or a very low level signal on the
line. As always, the only way to be completely certain of
the location of a utility is through visual inspection by ex-
posing the utility.
NOTE! The accuracy of position and Measured Depth
measurements improves as the NaviTrack’s low-
er antenna node is placed closer and closer to
the target utility. Rechecking the Measured Depth
and position periodically during the excavation
process can help avoid damage to a target utility
and may identify additional utility signals that
were not noticed prior to excavation.
WARNING
Care should be taken to watch for signal interfer-
ence that may give inaccurate readings. The
Tracing line is only representative of the position of
the buried utility if the field is UNDISTORTED. Do
NOT base your locate solely on the Tracing Line.
Always cross check your locate by ensuring that:
• The Tracing Line and the Distortion Line are
substantially aligned.
• The Proximity Signal and the Signal Strength
maximize when the Tracing Line crosses the
map center.
• The Measured Depth increases appropriately as
you raise the unit vertically and the Tracing Line
and the Distortion Line remain aligned.
Measured Depth readings should be taken as esti-
mates and actual depths should be independently
verified by potholing or other means prior to digging.
Note on 93 kHz Frequency Use
NOTE! European versions of the NaviTrack II offer an
additional 93 kHz frequency for Line Tracing.
The default 93 kHz frequency has an actual cycle count
of 93,696 cycles per second.
Some older transmitters use a different value for the
nominal 93 kHz frequency, 93,622.9 cycles per sec-
ond.
If you find that your transmitter signal at 93 kHz cannot
be detected by the NaviTrack II, set the locator’s fre-
quency to 93-B kHz, which is set to the older value. Both
93 and 93-B frequencies can be found under the Line
Trace category of the Frequency Selection sub-menu.
NaviTrack
®
II
Distortion
Line (Dashed)
Trace
Line
(Solid)

Ridge Tool Company
18
Passive Line Tracing
In passive mode the NaviTrack II senses fields gener-
ated by wires carrying alternating current (AC), without
a transmitter being attached. Buried power lines typically
do not emit any traceable signal unless power is flowing
in the wires. For example streetlights that are turned off
can be hard to trace passively. Due to coupling (either
through induction or through capacitance), all metallic
lines in an area can be energized passively. Because of
this, it is possible to locate lines passively but it can be
difficult to identify which line the operator is tracing.
1. Select a Passive AC Trace Frequency with the pas-
sive line trace icon.
Figure 29 – 60 Hz Passive Trace Frequency
2. The NaviTrack II has two passive AC tracing fre-
quency settings. They are 50 Hz, and 60Hz. The
50Hz and 60Hz frequencies are set to respond to
the 9th harmonic of the commonly used AC frequen-
cies. U.S. installations are typically 60 Hz, while
European installations are typically 50 Hz.
NaviTrack
®
II
Figure 28 – Screen Display in Different Locations (Active Line Tracing)
Trace Line
(Solid)
Distortion
Line
(Dashed)

Ridge Tool Company
19
When line tracing, it is important to remember that Tees,
curves, other conductors in the vicinity, and nearby
masses of metal can add distortion to the field requiring
closer scrutiny of the data to determine the path of the
target. These distortions are likely to be worse when trac-
ing passively.
For best accuracy, use directly connected Active Line
Tracing whenever possible.
WARNING
In Passive Line tracing, or when signals are ex-
tremely weak, the Measured Depth will generally
read too DEEP and the actual buried depth may be
MUCH shallower.
Operating Tips for Active Line and
Passive Line Tracing
• The NaviTrack II quickly identifies distorted fields. If the
lines are not centered on the map, when the Proximity
Signal or Signal Strength is maximized, distortion is
creating a complex non-circular field. To improve the
tracing circuit:
1. Try changing the frequency used to a lower one.
2. Move the ground stake position away from the line
being traced.
3. Make sure that the line is not commonly bonded to
another utility. Undo common bonds only if safe to
do so.
4. Move the transmitter to a different point on the line,
if possible.
• If the tracing lines will not center or if they move
across the screen erratically, then the NaviTrack II
may not be receiving a clear signal. The Measured
Depth and the Proximity Signal may also be unstable
under these circumstances.
1. Check the transmitter to be sure that it is operating
and well grounded.
2. Test the circuit by pointing the lower antenna at ei-
ther transmitter lead.
3. Check that the NaviTrack II and transmitter are op-
erating on the same frequency.
4. Try different frequencies, starting with the lowest,
until the line can be picked up dependably.
5. Re-locate the ground connection for a better cir-
cuit. Ensure there is enough contact (ground stake
is sufficiently deep) especially in dryer soils. When
soil is dry, soak the earth around the ground stake to
improve signal.
• Using the Signal Angle Indicator is another way to
check for distorted signals. Move the NaviTrack II
perpendicularly to both sides of the traced line until the
Signal Angle Indicator reads 45 degrees. Be sure to
keep the lower Omnidirectional antenna node at the
same height and the locator level. If there is little or no
distortion the traced line should be in the middle and
the distance to each 45 degree point should be ap-
proximately the same on either side.
Another variation of this technique is to move the same
distance to the right and left of the traced line, say 24
inches (60 cm) and check that the Signal Strength read-
ings are similar.
Figure 30 – Checking for Distortion
• While tracing, the Proximity Signal and Signal Strength
should maximize, and the Measured Depth should
minimize at the same place where the lines center
on the display. If this is not the case, the utility may be
changing direction or other coupled signals may be pre-
sent.
• Higher frequencies bleed over to adjacent utilities more
readily, but may be needed to jump breaks in tracer
wires or go over insulating couplers. If the line is un-
grounded at the far end, higher frequencies may be the
only means to make the line visible
(See on page 28).
• When using the transmitter inductively, be sure to
begin the locate about 30 feet (10m) away to avoid “di-
rect coupling”, also known as air coupling. This occurs
when the NaviTrack II picks up the signal from the
NaviTrack
®
II
Same Distance
45° Point
45° Point
Energized Pipe

Ridge Tool Company
20
transmitter directly through the air and not from the line
to be traced. To test for air coupling, point the NaviTrack
II directly at the transmitter; if Signal Strength increases,
then the transmitter may be too close to the receiver to
trace accurately.
NOTE! The weaker the inductively coupled signal pro-
duced on the conductor, the greater the air-
coupling distance.
While tracing, the mapping display operates best under
the following conditions:
• The line is level.
• The NaviTrack II Locator is above the target utility
elevation.
• The NaviTrack II antenna mast is held approxi-
mately vertical.
If these conditions are not met, pay close attention to
maximizing Proximity Signal and Signal Strength.
In general, if the NaviTrack II is used in a zone over the
target line within a sweep area of about two “depths” of
the line, the map will be useful and accurate. Be aware
of this when using the map if the target or line is very
shallow. The width of the useful search area for the
map can be small if the line is extremely shallow.
Measuring Depth (Tracing Modes)
The NaviTrack II calculates Measured Depth by com-
paring the signal level at the lower antenna to that at the
upper antenna.
Measured Depth is approximate; it will reflect the phys-
ical depth when the mast is held vertical and the bottom
antenna is touching the ground directly above the signal
source, assuming no distortion is present.
1. To measure depth, place the locator on the ground,
directly above the Sonde or the line.
2. Measured Depth will be shown in the lower left hand
corner of the NaviTrack II’s display screen.
3. A Measured Depth reading can be forced by pressing
the Select Key during a locate.
4. Measured Depth will be accurate only if the signal is
undistorted.
NOTE! In Active Line Trace or Passive Line Trace modes,
pressing the Select Key will force a Measured
Depth reading. If sound is on, it will also re-center
the audio tone.
Clipping (Tracing Modes)
Occasionally the Signal Strength will be strong enough
that the receiver will be unable to process the entire
signal, a condition known as “clipping”. When this occurs
a warning symbol will appear on the screen. It
means that the signal is particularly strong and accurate
Measured Depth measurements are not possible. If clip-
ping persists, remedy it by increasing the distance be-
tween the antennas and the target line you are tracing
OR by reducing the strength of the current from the
transmitter. Note that Measured Depth Display is dis-
abled under clipping conditions.
Menus and Settings
Pressing the Menu Key brings up a series of choices
which let the individual operator configure the NaviTrack
II
(See Figure 31).
The menu is a context-sensitive list of
options. The entry point into the menu list is set to the
currently in-use frequency.
Figure 31 – Main Menu
In sequence from the top of the menu down, the Main
Menu presents the following items:
1. Selected Sonde frequencies (activated or not)
2. Selected Active Line Trace frequencies (acti-
vated or not)
3. Selected Passive Line Trace frequencies (acti-
vated or not)
4. Measured Depth Measurement Units Setting
Control
5. Backlight Control
6. LCD Contrast Control
7. Display Elements Control (sub-menus will
display when selected for Sonde or Line Tracing
modes)
8. Frequency Selection Control (sub-menus
will display for categories of frequencies that can be
selected)
NaviTrack
®
II
Auto Menu
Exit
Countdown
Timer

Ridge Tool Company
21
9. Information Menu including software version and
unit serial number (sub-menu for restoring factory
defaults will display on Information screen).
See page 25 for a complete Menu list.
Auto Menu Exit Count-down Timer
While traversing the menu tree you will see a counter at
the bottom of the screen counting down. When it reaches
zero it will automatically move back up one level of the
menu tree until it reaches the operating screen again. It
resets to nine each time you press a key and each
time it goes up one menu level until it reaches the main
operating screen.
Selected Sonde Frequencies
Sonde frequencies that have been selected from the cur-
rently available list appear with a check box next to
them. If the checkbox is checked, the frequency will be
activated (Checked-Active) and can then be accessed
using the Frequency Key. Frequencies are checked or
unchecked by highlighting them and pressing the Select
Key. To return to the operating screen, press the Menu
Key.
Possible inclusions are:
16 Hz 512 Hz* 640 Hz
850 Hz 8 kHz 16 kHz
33 kHz
(* = Factory-selected frequencies.)
(See “Frequencies Selection Control” on page 23, to add
any frequencies to the Main Menu that do not appear on
it because they have not been selected.)
Selected Active Line Trace
Frequencies
As with Sonde frequencies these items will be checked
or unchecked and activate accordingly.
Possible included frequencies are:
128 Hz* 1 kHz* 8 kHz*
33 kHz* 65 kHz 200 kHz
262 kHz*
(* = Factory-selected frequencies.)
Selected Passive Line Trace
Frequencies
As with other frequencies these items will be checked or
unchecked and activate accordingly.
Possible included frequencies are:
50 Hz 60 Hz*
(* = Factory-selected frequencies.)
Measured Depth Units
The NaviTrack II can display Measured Depth in either
feet or meters. Feet are shown in feet-and-inches format;
meters are in decimal format. To change these set-
tings highlight the Units selection in the menu and press
the Select Key to toggle between feet or meters
(Figure
32)
. Use the Menu Key to save the section and exit.
Figure 32 – Selecting Units (Feet/Meters)
Back Light Toggle Control
A light detector built into the upper left corner of the key-
pad senses low light levels
(See page 9)
. The backlight
can be forced on by blocking the light to this sensor.
The automatic LCD backlight is factory set to only turn on
under fairly dark conditions. This is to conserve bat-
tery power.
To set the backlight to be always off, highlight the light bulb
icon in the tools section of the menu and press the Select
Key to toggle it between Auto, always ON and always
OFF. Use the Menu Key to save the selection and exit.
Figure 33 – Setting Backlight Mode (On/Off/Auto)
NaviTrack
®
II

Ridge Tool Company
22
LCD Contrast
When this is selected by pressing the Select Key the
contrast can be adjusted
(Figure 34).
Use the up and
down arrows to make the screen lighter or darker
(Figure
35)
. Extreme temperature changes may make the LCD
appear dark (hot) or light (cold). Setting the contrast to ex-
treme dark or light may make the LCD difficult to read.
Figure 34 – Contrast Setting Option
Figure 35 – Increasing/Decreasing Contrast
Use the Menu Key to save the setting and exit. In this
menu you can also exit by pressing the Select Key to
save the setting and exit.
Display Elements Menu
Selecting the icon representing two small display screens
will bring up the Display Selection Menu for either Trace
or Sonde mode
(Figures 36 and 37)
. This control
is used to toggle screen elements on and off. The
NaviTrack II is shipped with some of the optional elements
set to OFF to make getting started easier. To switch an el-
ement ON or OFF, press the Up or Down Key to highlight
the selection. Then use the Select Key to check or
uncheck the box. Checked display elements are set to ON
for the selected mode. Personal preferences and the
type of locating being done will dictate which optional
elements the operator wants displayed.
Figure 36 – Screen Elements (Sonde Mode)
Figure 37 – Screen Elements (Line Trace Modes)
Optional Features within the Display
Elements Menu
Optional features of the NaviTrack II can be turned on by
using the Menu Key to show the menu tree. Select the
Display Elements selection menu. Then select the mode
to change (Trace or Sonde).
Figure 38 – Main Menu
Optional Features for the Sonde Mode include:
Race Track and Watermark
The “Race Track” is a circular track around the center of
the Active View Area on the screen. The Watermark is a
marker which appears in the outer ring of the display,
traveling along the Race Track. The Watermark is a
graphic representation of the highest Signal Strength
reached (in Sonde mode) or the highest Proximity Signal
level reached (in Line Tracing modes). It is “chased” by
a solid Level Pointer which shows the current Signal
Strength.
(See Figure 39 for example.)
If the Signal
Strength Level Pointer goes higher than the Watermark,
NaviTrack
®
II
Display
Elements
Option

Ridge Tool Company
23
the Watermark moves up accordingly to show the new
highest level graphically. The Watermark, like the high-
water ring in a bathtub, shows the highest level reached.
This provides an additional, visual way to track the max-
imum signal. The Watermark and Race Track are a single
option that is off by default but can be set on in the
Display Elements selection menu.
Figure 39 – Racetrack with Watermark and Pointer
No-Signal Icon
When the NaviTrack II is not receiving any meaningful sig-
nal on the selected frequency it will display the mode
sign with a line through it, indicating no signal is being de-
tected
(Figure 40)
. This reduces the confusion of trying to
interpret the random noise in the absence of a signal.
Figure 40 – "No-Signal" Display in Sonde Mode
Center Signal Strength Option
Turning the option on in the Menu Selection screen will
force the number representing Signal Strength to be dis-
played in the center of the display area anytime when no
Proximity Signal is available
(Figure 41)
. This may occur
when the signal is weak. When a Proximity Signal again
becomes available, the Signal Strength number returns to
the lower right corner of the screen as usual. (Line Trace
Mode only).
Figure 41 – Signal Strength Centered
Sound Muting
This option enables the automatic muting of the sound
when the Measured Depth is greater than 99 feet. If it is
unchecked, the sound will not mute automatically. (Sonde
Mode only)
Sound Switching
When checked this will tie sound to the Signal Strength
when no Proximity Signal is available. (Trace Modes
only)
Frequencies Selection Control
Additional available frequencies can be added to the list
of Main Menu currently available frequencies by going to
the Frequency Select Sub-menu and selecting the desired
mode
(Figure 43)
. Checked frequencies are already “cur-
rently available” – that is, selected to appear in the Main
Menu. From there, they can be set to “Checked-Active”
status to make them available by use of the Frequency
Key.
To select additional frequencies go down to the Frequency
Selection sub-menu, and highlight the category of
the desired frequency
(Figure 42).
Figure 42 – Selecting a Frequency Category
NaviTrack
®
II

Ridge Tool Company
24
Then use the Up and Down Keys to scroll through the
available frequencies. Highlight the desired frequency to
add it to the Activated Frequencies list
(Figure 43)
.
Figure 43 – Highlighting a Frequency to Activate
Checking a frequency (using the Select Key) will include
it in the selected frequencies on the Main Menu. Once on
the Main Menu it can be set to checked-active status, and
then be chosen using the Frequency Key.
Figure 44 – Selecting a Frequency to Activate
To switch to a “currently available” frequency that is not yet
“Checked-Active”, press the Menu Key and scroll
down to the desired frequency; if it is not checked, press
the Select Key to toggle the checkbox to “checked”. This
sets the status of that frequency to “Checked-Active”.
Press the Menu Key to return to the operating display,
which will now be set to the frequency just activated.
The NaviTrack II will show the chosen frequency and its
icon on the left of the screen as the current “in-use” fre-
quency.
“Checked-active” frequencies can be switched while the
NaviTrack II is in use, by pressing the Frequency Key.
When using the Frequency Key, the NaviTrack II will
cycle down through the set of active frequencies from low
to high, group by group, and repeat. Unchecking a fre-
quency in the Main Menu will de-activate it, and then it will
not appear when pressing the Frequency button.
NOTE! If a frequency appears missing, look to make
sure it is in the Main Menu frequencies list. If it
is present but unchecked, set it to “Checked-
Active” status by highlighting it and pressing
the Select Key. If it is not present, go to the
Frequency Selection menu and the appropri-
ate sub-category and select it there, checking
the box to make it currently available in the
Main Menu list. Make sure it is “checked” at
both menu levels for it to appear in the current
working set of frequencies.
Information Screen and Restoring
Defaults
Information Screen
The information screen appears at the bottom of the
Main Menu. Highlighting the Information icon and press-
ing the Select button displays information about the lo-
cator, including software version, serial number of the
receiver and its calibration date.
Figure 45 – NaviTrack II Information Screen
Restore Factory Defaults
Pressing the Select Key a second time will display the
Restore Factory Defaults option.
Figure 46 – Factory Defaults Selection
This option is turned on by selecting the checked box (√).
If the “X” option is chosen, no change from current set-
tings will be made.
NaviTrack
®
II

Ridge Tool Company
25
Figure 47 – Defaults Restored (Sonde Mode)
Pressing the Menu Key without changing either check-
box will exit the option and leave things as they were.
Menu Tree
The following graphic shows the options and controls
built into the NaviTrack II menus. Pressing the Menu Key
from the active screen moves the display to the top of
the menu tree. Move through the choices using the Up
and Down Keys. Pressing the Select Key when any
choice is highlighted will show that sub-menu. Pressing
the Menu Key within a sub-menu will move up one
level. Checkboxes are turned on and off by pressing the
Select Key.
A Better Way of Locating
The NaviTrack II gives the operator a picture of the sit-
uation as the receiver moves along the target area and
makes it easier to understand where a target line’s
electromagnetic field is. With more complete information,
an operator can understand how things stand under-
ground and resolve complex situations, avoid inaccurate
mark-ups, and find the right line or cable more rapidly.
What the NaviTrack II Does
The NaviTrack II is used above ground to sense and
trace electromagnetic fields emitted from underground or
hidden lines (electrical conductors like metal wires and
pipes) or Sondes (actively transmitting beacons).
When the fields are undistorted, the information from the
sensed fields gives an accurate picture of the buried ob-
ject. When the situation is made complex by interfer-
ence from more than one line, or other factors, the
NaviTrack II provides a display of information that show
multiple measurements of the detected field. This data can
make it easier to understand where the problem is, by pro-
viding clues as to whether a locate is good or bad, ques-
tionable or reliable. Instead of just laying paint in the
wrong place, the operator can see clearly when a difficult
locate needs re-evaluation.
The NaviTrack II provides more of the critical information
the operator needs to understand the situation of the util-
ity being located.
What It Does Not Do
The NaviTrack II locates by sensing electromagnetic
fields surrounding conductive objects; it does not sense
the underground objects directly. It provides more infor-
mation about the shape, orientation, and direction of
fields than other locators but it does not magically interpret
that information or provide an x-ray image of under-
ground objects.
A distorted, complex field in a noisy environment re-
quires intelligent human thought to analyze correctly.
The NaviTrack II cannot change the results of a difficult lo-
cate, even though it shows all the information about
those results. Using what the NaviTrack II shows, a good
operator can improve locating results by “making the cir-
cuit better” (change frequency, ground, or the transmitter’s
location on the target line.)
NaviTrack
®
II
Activated Frequencies
Sonde Selected Frequencies
Line Trace Selected Frequencies
Power (Passive Trace) Selected Frequencies
No-Signal Indicator
Sonde
16 Hz, 512 Hz, 640 Hz, 850 Hz, 8kHz
16 kHz, 33 kHz
Information Menu
Restore Default Settings
(Check Yes/No)
Trace Mode
Units of Measure
Feet/Meters
Backlight Options
On/Off/Auto
LCD Contrast
Increase/Decrease
Display Elements Select (Check On/Off)
Sonde Mode
Watermark
Sound Signals
Center Signal Strength*
Signal Strength
Angle Indicator
Mute > 99'
Tracing Lines*
* = Line Trace Display Only
Frequency Select (Check On/Off)
Line Trace
128 Hz, 1 kHz, 8 kHz, 33 kHz,
200 kHz, 262 kHz
Power
50 Hz, 60 Hz

Ridge Tool Company
26
Advantages of the Omnidirectional
Antenna
Unlike the coils used in many locator devices, the Omni-
directional antenna detects fields on three separate axes,
and can combine these signals into a “picture” of the ap-
parent strength, orientation and direction of a field. Omni-
directional antennas offer definite advantages:
The Mapping Display
The mapping display enabled by the Omnidirectional an-
tennas provides a graphic view of a signal’s character-
istics and a bird’s eye view of the signal underground. It
is used as a guide for tracing underground lines and can
be used to better pinpoint Sondes. It can also be used to
provide more information for complex locates.
Figure 48 – Mapping Display
The use of lines (representing the signals sensed by
upper and lower antennas) gives the operator a graphic
way to see where they are, and where the target utility or
Sonde is located. At the same time the display pro-
vides all the information needed to understand what is
happening with the field being located – its Signal
Strength, continuous distance, Signal Angle and prox-
imity to the target. The information available at one mo-
ment on the NaviTrack II would take multiple sample
readings with some conventional locators. A distorted or
compound field is easier to interpret when all the infor-
mation is in a single display as it is with the NaviTrack II.
Orientation to the Signal
Because of the multiple signals being processed by each
Omnidirectional antenna, the target’s signal always gets
stronger as the receiver gets closer to the target. How the
unit is held does not affect Signal Strength. The user
can approach from any direction and does not need to
know the orientation or direction of the pipe or wire.
Locating Sondes
Used with a Sonde, the NaviTrack II eliminates Nulls
and "Ghost Peaks”. A conventional locator signal often
sees a signal increase followed by a null (better de-
scribed as no signal registering on the antenna) and then
a peak. This can confuse the operator who may interpret
a smaller peak as the target.
Figure 49 – The signal from a Sonde as “seen” by a con-
ventional locator
The main peak is in the center, and two false peaks are
outside the two nulls.
The NaviTrack II uses just one peak to draw the user to
the target. Finding a Sonde using Signal Strength is a
very direct process.
Figure 50 – Sonde signal as “seen” by the NaviTrack II
The only way to go is “up” toward the maximum signal.
NaviTrack
®
II
False Peaks
Null
Peaks
Peak
/