Page is loading ...

The Tektronix PA3000 is a one- to four-channel power analyzer that is optimized for testing today’s single- and multi-phase,
high efficiency power conversion products and designs. Use it to quickly visualize, analyze, and document power efficiency,
energy consumption, and electrical performance to the latest regional and international standards.
Each test example in this demo guide discusses two methods of making the same measurements. The first method refers to
making the measurements directly on the PA3000 using the front panel, whereas, the second method demonstrates the use of
free PWRVIEW Software. In each test example, the second method (PWRVIEW) is the preferred method, because it is easier
and enables more user flexibility and customization options.
Tektronix recommends reviewing all of the test examples to reach the best understanding of all features offered by the PA3000
and the PWRVIEW Software.
Table of Contents
Test 1: Efficiency Testing Single Phase Applications ................................................................................................... 1
Test 2: Efficiency Testing Three Phase Applications .................................................................................................... 9
Test 3: Energy Consumption Testing ..........................................................................................................................17
Test 4: Standby Power Measurements (IEC 62301 Ed 2.0) ....................................................................................... 23
Test 5: Inrush Current Testing ................................................................................................................................................. 29
PA3000 Four-channel,
Multi-phase AC/DC Power Analyzer
––
HOW-TO DEMONSTRATION GUIDE


TEK.COM | 1
PA3000 Four-channel, Multi-phase AC/DC Power Analyzer
Efciency Testing Single Phase Applications
DEMONSTRATION GUIDE
Efciency Testing Single Phase Applications
This example demonstrates a simple method to make efficiency measurements on
an external
AC-DC power supply that is rated to the level VI efficiency standard.
Similar principles can also
be applied to efficiency testing on any AC-DC power
supply, DC-AC inverter, and other related
converter including solar inverter
and UPS systems.
TEST SETUP
Complete the following steps to setup the efficiency measurement on an AC-DC
power
supply with the PA3000 Power Analyzer:
1. Connect the AC input on the device under test (DUT) to the first channel of
the PA3000
using a Tektronix Breakout Box (BB1000) as shown in the wiring
diagram.
(See Figure 1-2.)
2. The breakout box taps in to the current signal and measures the voltage across
the input
terminals. The breakout box makes it easier and safer to connect the input AC signal
on the
DUT using the 4 mm safety leads provided with PA3000.
3. Connect the output DC terminals on the second channel of the PA3000 using
the provided
safety leads. The current shunt on the PA3000 is connected in
series with the output load;
the voltage channels are connected across the
positive and negative terminals of the power
supply as show in the figure.
4. After making all of the connections, use one of the two methods to make
the efficiency
measurement.
PA3000 POWER ANALYZER (FRONT PANEL)
AC LINE
BB1000-UN
BREAKOUT BOX
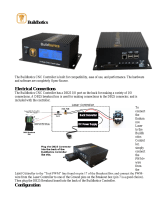
Example test configuration and measurement results for testing AC/DC power supplies and LED drivers.
Time
Volts/Amps
Time
Efficiency
V
out
Time
2380 ELECTRONIC LOADPOWER SUPPLY UNDER TEST
Figure 1-1. Efficiency Testing setup for AC-DC Power Supply.
WATCH VIDEO
How to Make Efficiency
Measuremensts on
AC-DC Power Supply
www.tek.com/
effciency1ph_video

2 | TEK.COM
PA3000 Four-channel, Multi-phase AC/DC Power Analyzer
Efciency Testing Single Phase Applications
DEMONSTRATION GUIDE
METHOD 1: EFFICIENCY MEASUREMENTS ON SINGLE PHASE AC-DC POWER
SUPPLIES. (PA3000 DIRECT)
The following steps describe the process for setting up the PA3000 for efficiency
measurements on an AC-DC power supply.
WHAT YOU WILL NEED — METHOD 1
• PA3000 Power Analyzer • BB1000 Break Out Box
• AC-DC Power Supply (DUT) • Electronic Load (Keithley 2380) (Optional)
• 4mm Safety Leads • AC Source (Optional)
Figure 1-3.
Efficiency
measurement
on the PA3000.
Figure 1-2. AC-DC efficiency measurement wiring diagram.

TEK.COM | 3
PA3000 Four-channel, Multi-phase AC/DC Power Analyzer
Efciency Testing Single Phase Applications
DEMONSTRATION GUIDE
This procedure can also be used for testing efficiency on other applications
such as UPS systems, LED drivers, or DC-AC inverters.
1. Set the PA3000 to the default configuration:
–
Press
.
– Scroll down to User Configuration and press
.
– Select Load Default Configuration, and then press
to confirm. The PA3000 will load
the defaults and display a confirmation screen. Press
and then return to the Main
Menu by pressing
.
2. In the Main Menu, go to Measurements, press
, and then select the
desired
parameters for the AC input signal.
– The first channel will be represented as Group A on the yellow bar at the
top of the screen.
– Select the desired measurements: Vrms, Arms, Watts, VA, PF, Acf,
Athd, and A Harmonics.
3. Select Group B representing the second channel on the PA3000 by pressing
the right arrow
key on the left panel of the PA3000.
4. Select the desired measurements for the DC output such as Watt, Vdc, and
Adc; deselect
any preset measurements that are not needed.
5. After selecting all of the desired parameters, press
to view the Results
screen.
– The PA3000 is now set up for making AC and DC measurements on the first
and second
channels respectively.
6. Power on the DUT from the AC source; an appropriate load can be applied to
the DUT at this point.
– The Results screen should start updating the real time measurements.
7. The Math function can be used for calculating efficiency. Press
to set up
efficiency formula.
8. On the Math screen, press the MATH soft key.
9. Select the desired function from the list and then press
to enter the
options.
NOTE: The Edit Function can be used to edit any specific math formula. While
in the edit
function, press
to enter the Help menu for help in formatting the
function or refer to the
information earlier in this manual.
10. For the efficiency calculations, enter (CH2:W/CH1:W)*100 and then press
. Press
to go back to Math menu where the function can be
renamed and units can be added, if desired.
11. Go back to the Math menu and scroll down to the newly edited function
and enable the
function by pressing
. Select all functions that need to
be displayed on the screen.
12. Press
to view the Results screen.
13. To view selected math formulas, press
.
14. To view math formulas along with other results, press
to view the
Results screen and
press
multiple times until the math window appears
at the bottom of the screen.
15. PA3000 Power Analyzer is now ready to take efficiency measurements.
Optional Steps when using Keithley 2380 Electronic Load
16. Set the Keithley 2380 Electronic load in Constant-Current (CC) mode by pressing the
CC key on the front panel and set the value for full load current based on the output
specification of the power supply under test. Press the on/off button.

4 | TEK.COM
PA3000 Four-channel, Multi-phase AC/DC Power Analyzer
Efciency Testing Single Phase Applications
DEMONSTRATION GUIDE
17. Generally a 30 minute warm-up period is required by the standard, before
any efficiency measurements are made on an AC-DC Power Supply.
18. Check for power stability measurements for five minutes on the input of the Power Supply
and then log an efficiency measurement at 100% load.
19. Repeat this step at 75%, 50%, 25% and 0% load by entering those values on the
front panel of the 2380 Electronic load.
20. Let the Power supply stabilize for five minutes between each load step change.
FURTHER SETTINGS IF REQUIRED
Data Logging. The logging feature allows you to log data over time for prolonged
efficiency
testing involving load and source sweeps. Use the DATA OUT key to log data to any compatible
flash drive connected to the front panel USB
connector. The actual logging interval can be
changed by pressing
and going
to Interfaces USB Host Data Out. The log file will be
saved as a .csv file.
Waveforms and Harmonics. To monitor AC input waveforms and harmonics, use
the
or
key respectively. Switch between channels by using the arrow
keys on the left panel.
Various options for viewing waveforms and harmonics can
be selected from within the Graphs
and Waveforms menu.
Figure 1-4.
Harmonic bar
chart on the
PA3000.
2380 Electronic Load Programming. The ‘List’ mode on 2380 Electronic Load can be
used to automate efficiency testing.
• The load can be set up to automatically step through a set of different load values.
The load can be programmed to execute the list with a fixed time at each step.
• Alternatively, the load can be triggered via a hardware, external trigger or a command
from a controller.
• For more information on how to setup list mode on 2380 Electronic Load, refer to the product
user manual (Document no: 2380-120-60-901-01 Rev. A)

TEK.COM | 5
PA3000 Four-channel, Multi-phase AC/DC Power Analyzer
Efciency Testing Single Phase Applications
DEMONSTRATION GUIDE
METHOD 2: EFFICIENCY
MEASUREMENTS ON SINGLE
PHASE AC-DC POWER
SUPPLIES. (PWRVIEW
SOFTWARE)
The following steps describe the process for setting up the PWRVIEW software
with a PA3000 for efficiency measurements.
WHAT YOU WILL NEED — METHOD 2
• PA3000 Power Analyzer • PC with PWRVIEW software installed
• AC-DC Power Supply (DUT) • USB cable
• 4mm Safety Leads • Electronic Load (Keithley 2380)
• BB1000 Break Out Box • AC Source (Optional)
Figure 1-5.
Efficiency
measurement
with the PWRVIEW
software.
1. Connect the PA3000 to the computer with the PWRVIEW software installed
using
the supplied USB cable. Ethernet or GPIB can also be used, if desired.
2. Open the PWRVIEW software by double-clicking the desktop icon.
3. Click the Add button to connect the PA3000. All available instruments will be listed
in the selection panel.
4. Select the desired instrument (the PA3000) and then click Connect.
NOTE: There are various default applications and compliance tests on the left
panel
from which you can select. This example discusses the AC-DC LED Driver
efficiency
measurement. This method can also be used for similar AC-DC power
supplies
5. Select LED Driver Efficiency under the Applications/Test section on the left
panel and then
click the Wizard button. The wizard helps with wiring and shunt selections. A 1A shunt or
30A shunt
can be selected based on the peak input and output currents.
6. Make changes on the setup wiring as suggested.

6 | TEK.COM
PA3000 Four-channel, Multi-phase AC/DC Power Analyzer
Efciency Testing Single Phase Applications
DEMONSTRATION GUIDE
7. Click Finish when done, and the page will direct you to the Efficiency Setup
tab.
8. Verify the instrument and group information and then click the check box for
the
Measurement Efficiency. PWRVIEW is now ready to take efficiency measurements.
9. Click the Measure tab page at the top and then click the blue Start button.
The
measurements will start updating.
10. To add more measurements or change other settings, such as range and filters,
go to the
Setup tab and select the desired settings.
NOTE: The measurements must be stopped to make any changes on the Setup
page.
Stop the measurements by clicking the Stop button on the bottom of the
Setup page.
Optional Steps when using Keithley 2380 Electronic Load
11. Set the Keithley 2380 Electronic load in Constant-Current (CC) mode by pressing the CC
key on the front panel and set the value for full load current based on the output
specification of the power supply under test. Press the on/off button.
12. Generally a 30 minute warm-up period is required by the standard, before any efficiency
measurements are made on an AC-DC Power Supply.
13. Check for power stability measurements for five minutes on the input of the Power Supply
and then log an efficiency measurement at 100% load.
14. Repeat this step at 75%, 50%, 25% and 0% load by entering those values on the front
panel of the 2380 Electronic load.
15. Let the Power supply stabilize for five minutes between each load step change.
FURTHER SETTINGS IF REQUIRED
Waveform, Harmonics, and Trend Chart. In the measurement Grid, you can view
Waveform, Harmonics, and Trend charts by clicking the respective icons on the menu bar.
Figure 1-6.
Efficiency
Trend Chart.

TEK.COM | 7
PA3000 Four-channel, Multi-phase AC/DC Power Analyzer
Efciency Testing Single Phase Applications
DEMONSTRATION GUIDE
• Waveforms in the PWRVIEW software are constructed using the harmonic data collected
from the power analyzer. The accuracy of the waveform depends on the amount of harmonic
information available. For optimum results, select maximum number of harmonics to display in
the setup area. Selecting 100 harmonics for the PA3000 gives the best results. If no harmonics
are selected, waveform feature will display a blank screen.
• The Harmonic bar chart can be enabled for all voltage, current, and watts measurements.
Up to 100 harmonics can be selected throug the setup screen. Hovering over any harmonic
bar will display the absolute value and percentage of fundamental for that harmonic.
• The Trend chart can be activated for any measurement parameter by either right clicking on
the desired parameter or by clicking the Trend icon on menu bar. The Trend chart can be reset
by using the Reset button on the menu bar.
Data Logging. Recording data is important for most efficiency measurements where load and
source sweep is required.
Figure 1-7.
Logging setup.
• To record data using PWRVIEW, click the Record button on the menu bar. The software
will start recording all the selected data including formulas and limits.
• To change the data logging rate or to set the total log time, click the down arrow on the
Record icon to open the data logging setup. Here you can select the desired logging
duration and interval.
• To stop the data logging, click the Stop button.
• All the recorded data is stored in a database on the local computer. To access the data, click
the Results tab and then click the Measure icon. The dialog box will present all the archived data.
• Select the desired data set and export to either an Excel or a .csv format.

8 | TEK.COM
PA3000 Four-channel, Multi-phase AC/DC Power Analyzer
Efciency Testing Single Phase Applications
DEMONSTRATION GUIDE
Custom Limits. Custom limits can also be set with any of the measurement parameters.
Custom limits help set limits based on various standards or test specifications.
Figure 1-8.
Custom limits.
• To set custom limits, either right-click the desired measurement parameter or
click the Limits
Setup icon on the menu bar. Stop the measurement update to
set up custom limits.
• Custom limits will appear as a separate tab on the measurement grid. The result column will
display red fonts if the limits are failing. Hovering over the results will display the limit function,
limit value, and relative value.
2380 Electronic Load Programming. The ‘List’ mode on 2380 Electronic Load can
be used to automate efficiency testing.
• The load can be set up to automatically step through a set of different load values.
The load can be programmed to execute the list with a fixed time at each step.
• Alternatively, the load can be triggered via a hardware, external trigger or a command
from a controller.
• For more information on how to setup list mode on 2380 Electronic Load, refer to the
product user manual (Document no: 2380-120-60-901-01 Rev. A)

TEK.COM | 9
PA3000 Four-channel, Multi-phase AC/DC Power Analyzer
Efciency Testing Three Phase Applications
DEMONSTRATION GUIDE
Efciency Testing Three Phase Applications
This example demonstrates a simple method to make efficiency measurements on a three phase
motor drive. Similar principles can also be applied to efficiency testing on any three phase inverters
and other DC-AC converters.
Volts
Time
Amps/Volts
Time
Torque
Speed
3∅ INPUT
3
∅ PWM OUTPUT
MOTOR DRIVE
MOTOR
DYNAMOMETER
TORQUE
AND SPEED
PA3000 POWER ANALYZER (FRONT PANEL)
METHOD 1: EFFICIENCY
MEASUREMENTS ON THREE
PHASE PWM MOTOR DRIVE
(PA3000 DIRECT)
This method demonstrates three phase power and efficiency measurements on
a single
phase input and three phase output PWM motor drive directly on the
PA3000 display.
WHAT YOU WILL NEED — METHOD 1
• PA3000 Power Analyzer • BB1000 Break Out Box
• Three Phase Inverter (Motor Drive) • AC Source (Optional)
• 4mm Safety Leads
TEST SETUP
The following steps describe the process to set up the efficiency measurement on
a single phase input PWM motor drive using the PA3000.
1. Connect the single phase AC input on the PWM motor drive to the first channel of the
PA3000 using a Tektronix BB1000 Breakout Box as shown in wiring diagram.
– The breakout box taps into the current signal and measures the voltage across the input
terminals. It makes it easier and safer to connect input the AC signal on the DUT with the
4mm safety leads provided with the PA3000.
Figure 2-1. Three Phase Efficiency Testing on a PWM Motor Drive.
WATCH VIDEO
How to Make Efficiency
Measurements on a Three
Phase Motor Drive
www.tek.com/
effciency3ph_video

10 | TEK.COM
PA3000 Four-channel, Multi-phase AC/DC Power Analyzer
Efciency Testing Three Phase Applications
DEMONSTRATION GUIDE
2. Connect the three phase output of the PWM drive to other three channels using
the 3-phase 4-wire configuration as shown in the wiring diagram.
– All three phases are set up in series with the internal shunt and the voltage
is measured across respective phase and neutral.
3. If the motor drive does not have a dedicated neutral cable, create a floating neutral by
connecting all three VLO terminals on channels 2, 3, and 4 together.
4. After making all of the connections, set the PA3000 to the default configuration:
– Press
.
– Scroll down to User Configuration and press
.
– Select Load Default Configuration, and then press
to confirm.
The PA3000 will load the defaults and display a confirmation screen. Press
and then
return to the Main Menu by pressing
.
5. To select the correct wiring configuration within the Main Menu, go to
Inputs Wiring Configuration and select 1 Phase 2 Wire for Group A.
6. Scroll to Group B by pressing the arrow key on the left front panel and select 3 Phase 4 Wire.
NOTE: If desired, both groups can be named for ease of monitoring. Go back one step
and enter the appropriate name using the Group Name option.
7. The PA3000 makes it easy to configure important settings using default modes.
For the PWM motor drive output, from the Main Menu, select Modes
Select Mode PWM Motor.
– The PWM Mode will set up the PA3000 to accurately measure the output voltage of a
typical PWM drive that switches at high frequencies. The algorithm applies a proprietary
sensing method to determine the actual fundamental power frequency in real time for all
power calculations so that the calculated power and harmonic data are always accurate
even in dynamic speed conditions.
– The PWM Mode is not required for the input line frequency measurements.
– To enable sum measurements for the three phase output on group B, enable the Sum
Results column by entering the Main Menu and going to Measurement Configuration
Sum Results Column Enabled.
Figure 2-2. PWM motor drive efficiency (1 phase in and 3 phase out).

TEK.COM | 11
PA3000 Four-channel, Multi-phase AC/DC Power Analyzer
Efciency Testing Three Phase Applications
DEMONSTRATION GUIDE
8. To make the efficiency measurements, enable the Math function by pressing
and
then pressing the MATH soft key.
9. Select the desired function to edit and press
to enter the options.
NOTE: The Edit Function can be used to edit any specific math formula. While in the edit
function, press
to enter the Help menu for help in formatting the function or refer to
the information earlier in this manual.
10. For the efficiency calculation, enter (GRPB:SUM:W/CH1:W)*100 and then
press
.
Press
to go back to the Math menu where the function can
be renamed and units can
be added, if desired.
11. Go back to the Math menu and scroll down to the newly edited function
and select the
function by pressing
. Select all functions that need to
be displayed on the screen.
12. Press
to view the Results screen.
13. To view selected math formulas, press
.
14. To view math formulas along with other results, go back to the Results screen
and
press
multiple times until the math window appears at the bottom of the screen.
You are now ready to take efficiency measurements on a PWM Motor drive with
single
phase input and three phase output.
FURTHER SETTINGS IF REQUIRED
Torque and Speed Inputs. The overall efficiency of a motor drive system requires measuring real-
time speed and torque data.
The PA3000 has four analog and two counter inputs to enable various auxiliary input measurements
such as torque and speed.
• Refer to the pin number for desired analog or counter input under Auxiliary inputs/outputs and
connect the signal (torque, speed, or others) directly to the respective pin on the AUXILIARY
INPUTS/OUTPUTS connector on the rear panel.
• The auxiliary inputs can be enabled and viewed through the math screen. Press
and
then press the MATH soft key to enter options. Select any desired function and edit function
as ANA1, ANA2, ANA3, or ANA4 for analog inputs and COUNT1 or COUNT2 for counter inputs
to enable and view auxiliary inputs on the screen.
• To view the math screen along with other results, press
multiple times until the math
window appears on the bottom of the display.
Data Logging. The logging feature allows you to log data over time for prolonged efficiency
testing involving load and source sweeps. Use the DATA OUT key to log data to any compatible
flash drive connected to the front panel USB connector. The actual logging interval can be changed
by pressing
and going to Interfaces USB Host Data Out. The log file will be saved as
a .csv file.

12 | TEK.COM
PA3000 Four-channel, Multi-phase AC/DC Power Analyzer
Efciency Testing Three Phase Applications
DEMONSTRATION GUIDE
Waveforms, Harmonics, and Vector Graphs. Waveforms, harmonics, and vector graphs
can be enabled for all three phase signals.
• To monitor AC waveforms, harmonics, or the vector graph use the
, ,
or
keys respectively.
• Switch between channels using the arrow keys on the front panel.
• Select various options for viewing waveforms and harmonics within the Vector
and Waveforms menus.
Figure 2-3.
Vector graph
on the PA3000.

TEK.COM | 13
PA3000 Four-channel, Multi-phase AC/DC Power Analyzer
Efciency Testing Three Phase Applications
DEMONSTRATION GUIDE
METHOD 2: EFFICIENCY
MEASUREMENTS ON THREE
PHASE PWM MOTOR DRIVE
(PWRVIEW SOFTWARE)
This method discusses efficiency measurement on three phase input and output PWM motor
drives using the PWRVIEW software.
WHAT YOU WILL NEED — METHOD 2
• PA3000 Power Analyzer • PC with PWRVIEW software installed
• Three Phase Inverter (Motor Drive) • USB cable
• 4mm Safety Leads • AC Source (Optional)
Figure 2-4. PWM Motor drive efficiency (3-phase in and 3-phase out).
TEST SETUP
1. Connect the three phase AC input of the PWM motor drive to the first two channels of the
PA3000 as shown in wiring diagram. (See Figure 2-4.)
2. Connect the three phase output of the PWM drive to the other two channels using the
configuration as shown in the wiring diagram.
NOTE: The 3-phase 3-wire (2 Wattmeter) configuration enables testing three-phase
signals by using two power channels. This method can be used for simultaneously
testing 3-phase input and outputs on a 4-channel power analyzer.
3. After making all of the power connections, connect the PA3000 to the computer with the
PWRVIEW software installed using the supplied USB cable. Ethernet or GPIB can used.
4. Open the PWRVIEW software by double-clicking the desktop icon. Click the Add button
to connect the PA3000. All available instruments will be listed in the selection panel.
Select the desired instrument (the PA3000) and then click Connect.
NOTE: There are various default applications and compliance tests on the left panel
that you can select from.

14 | TEK.COM
PA3000 Four-channel, Multi-phase AC/DC Power Analyzer
Efciency Testing Three Phase Applications
DEMONSTRATION GUIDE
5. Select PWM Motor Drive Efficiency under the Applications/Test section on the left panel
and then click the Wizard button.
6. The wizard helps with wiring and shunt selections.
7. Select the three phase input and three phase output on the wizard and enter the expected
current in the appropriate box.
8. Click Finish when done and the page will direct you to the Efficiency Setup tab.
9. Verify that the instrument and group information and then click the check box for the
Measurement Efficiency.
10. PWRVIEW is now ready to take efficiency measurements.
11. Go to the Measure tab and then click the blue Start button. The measurements will start updating.
12. To add more measurements or change other settings, such as range and filters, go to the Setup
tab and select the desired settings.
NOTE: The measurements must be stopped to make any changes on the Setup page.
Stop the measurements by clicking the Stop button on the bottom of the Setup page.
FURTHER SETTINGS IF REQUIRED
Torque and Speed Inputs. The overall efficiency of a motor drive system requires measuring
real-time speed and torque data. The PA3000 has four analog and two counter inputs to enable
various auxiliary input measurements such as torque and speed.
• Refer to the pin number for desired analog or counter input under Auxiliary inputs/outputs
and connect the signal (torque,speed, or others) directly to the respective pin on the
AUXILIARY INPUTS/OUTPUTS connector on the rear panel.
• To enable the auxiliary inputs using PWRVIEW, go to the Setup tab.
• On the Setup tab, go to the Wiring page and select the check box near the bottom of the
page for enabling the Auxiliary Inputs (Analog and Counters). A new tab page named Auxiliary
Inputs will be created.
Figure 2-5.
Auxiliary inputs
setup for torque
and speed
measurements.

TEK.COM | 15
PA3000 Four-channel, Multi-phase AC/DC Power Analyzer
Efciency Testing Three Phase Applications
DEMONSTRATION GUIDE
• On the Auxiliary Inputs tab page, enter the desired label, units and equation for the
respective analog and counter inputs Equation Guidelines on the bottom can be used
for assistance with entering equations. Enable the desired inputs.
• Go to the Measure tab page and click the Start button.
• The selected analog and counter input signals will be displayed on the measurement
grid with proper labels and units.
• Desired formulas for further equating system efficiency using analog and counter inputs
along with any other measurement parameters can be entered in the Formula column on
the measurement grid.
Data Logging. Recording data is important for most efficiency measurements where load and
source sweep is required.
• To record data using PWRVIEW, click the Record button on the menu bar. The software will
start recording all the selected data including formulas and limits.
• To change the data logging rate or to set the total log time, click the down arrow on the Record
icon to open the data logging setup. Here you can select the desired logging duration and interval.
• To stop the data logging, click the Stop button.
• All the recorded data is stored in a database on the local computer. To access the data, click
the Results tab and then click the Measure Icon. The dialog box will present all the archived data.
• Select the desired data set and export to either an Excel or a .csv format.

16 | TEK.COM
PA3000 Four-channel, Multi-phase AC/DC Power Analyzer
Efciency Testing Three Phase Applications
DEMONSTRATION GUIDE
Waveform, Harmonics, and Trend Chart. In the measurement grid, you can view waveforms,
harmonics, and trend charts by clicking the respective icons on the menu bar.
• Waveforms in the PWRVIEW software are constructed using the harmonic data collected from
the PA3000. The accuracy of the waveform depends on the harmonic information available.
For optimum results, select the maximum number of harmonics to display in the setup area.
Selecting 100 harmonics for the PA3000 gives the best results. If no harmonics are selected,
waveform feature will display a blank screen.
• The Harmonic bar chart can be enabled for all voltage, current, and watts measurements. Up
to 100 harmonics can be selected through the setup screen. Hovering over any harmonic bar
will display the absolute value and percentage of fundamental for that harmonic.
• The Trend chart can activated for any measurement parameter by either right-clicking the
desired parameter or by clicking the Trend icon on menu bar. The Trend chart can be reset by
clicking the Reset button on the menu bar.
Custom Limits. Custom limits can also be set with any of the measurement parameters. Custom
limits help set limits based on various standards or test specifications.
• To set custom limits, either right-click the desired measurement parameter or click the Limits
Setup icon on the menu bar. Stop the measurement update to set up custom limits.
• Custom limits will appear as a separate tab on the measurement grid. The result column will
display red fonts if the limits are failing. Hovering over the results will display the limit function,
limit value, and relative value.
Figure 2-6.
Harmonic bar
chart.

TEK.COM | 17
DEMONSTRATION GUIDE
PA3000 Four-channel, Multi-phase AC/DC Power Analyzer
Energy Consumption Testing
Energy Consumption Testing
Energy consumption testing on home and office appliances is required for compliance to many
international and regional standards programs such as ENERGY STAR®. Energy consumption
testing involves the integration of power consumed over a long period of time, often days. Use the
dedicated Integration Mode on the PA3000 to make energy consumption testing easier and faster.
Figure 3-1. Energy Consumption Testing on Home and Office Appliances.
Time
WHr
Frequency
Harmonics
APPLIANCES UNDER TEST
AC LINE
PA3000 POWER ANALYZER (REAR PANEL)
BB1000-UN
BREAKOUT BOXES
TEST SETUP
The following steps describe the process to set up energy consumption measurements on
a home or office appliance using a PA3000. This method can be used for testing energy
consumption of any DUT that plugs into the AC wall socket for power.
Figure 3-2.
Energy
consumption
measurements
wiring diagram.
1. Connect the AC input on the DUT to the first channel of the PA3000 using a Tektronix
BB1000 Breakout Box as shown in the wiring diagram.
The breakout box taps in to the current signal and measures the voltage across the input
terminals. It makes it easier and safer to connect the input AC signal on the DUT using
the 4 mm safety leads provided with the PA3000.
2. After making all the connections, use one of the two methods to make efficiency measurements.
WATCH VIDEO
How to Make Energy
Consumption
Measurements
on Appliances
www.tek.com/
consumption_video

18 | TEK.COM
DEMONSTRATION GUIDE
PA3000 Four-channel, Multi-phase AC/DC Power Analyzer
Energy Consumption Testing
METHOD 1: ENERGY
CONSUMPTION
MEASUREMENTS (PA3000 DIRECT)
The following steps describe the process to set up energy consumption testing on home
or office appliances using the PA3000.
WHAT YOU WILL NEED — METHOD 1
• PA3000 Power Analyzer • BB1000 Break Out Box
• Home or Office Appliance (DUT) • AC Source (Optional)
• 4mm Safety Leads
Figure 3-3.
Energy
consumption
testing on the
PA3000.
TEST SETUP
1. Set the PA3000 to the default configuration:
– Press
.
– Scroll down to User Configuration and press
.
– Select Load Default Configuration, and then press
to confirm.
The PA3000 will load the defaults and display a confirmation screen.
Press
and then return to the Main Menu by pressing .
2. To enable the Integrator mode, go to Modes Select Mode Integrator.
3. Press
, select Setup Modes Integrator Setup, and select the desired start method.
– Manual works by pressing INTEG RUN key to start and stop integration.
– Clock allows for setting up a specific time to start integration.
– Level allows you to set trigger levels on a specific signal to start the integration measurement.
4. Go back to the Integrator Setup menu to configure the clock start, duration or the trigger level.
NOTE: The Integrator Setup menu also provides an option to set up the target power factor
for the design. This feature displays the value of VArs required to correct the average power
factor to the target power factor.
5. After you have set the integration mode and selected the start-stop method, press
.
The PA3000 will display integration parameters such as: Hr, Whr, VAHr, and AHr.
6. Power on the DUT and the results on the PA3000 should start updating.
– The integration results will display zero until it is triggered either manually using the INTEG
RUN key on the front panel or by the selected start method.
– The LED under the INTEG RUN key stays on while integration measurements are running.
/