Page is loading ...

- 1 -
NIR Technology Systems
NIR-MS-2000-C2F Flour Analyser
Users Guide
PLEASE READ THIS MANUAL CAREFULLY BEFORE
OPERATION
3, Hagavish st. Israel 58817 Tel: 972 3 5595252, Fax: 972 3
5594529 mr[email protected]
MRC. 10.19

Operations Manual
2 -
Table of Contents
N
N
NI
I
IR
R
R
T
T
Te
e
ec
c
ch
h
hn
n
no
o
ol
l
lo
o
og
g
gy
y
y
S
S
Sy
y
ys
s
st
t
te
e
em
m
ms
s
s 1
Table of Contents 1
Overview 3
Analysis Software 3
Description 4
Setting up NIR-MS-2000-C2F 7
NIR-MS-2000-C2F Details 7
Operation 8
Start Up 8
Idle Mode 8
Analysis 9
Saving Results 11
Downloading / Uploading Data from NIR-MS-2000-C2F 12
Alpha Functions
Date and Time Adjustment 14
Recall Last 16 Results 15
Calibration Setup 15
Autocalibration 18
System Mode 18
Maintenance 22
Opening the NIR-MS-2000-C2F 22
Changing Lamp Fitting 22
Changing External Fuse 22
Changing Internal Fuse 22
Dusting Optics
Replacing Battery 23
23
Closing the NIR-MS-2000-C2F 23
Sample Preparation 23
Large population, small sample 23
Sample preparation procedure 23
Foreign Matter 24
Trouble Shooting 25
Warranty 28

- 3 -
Overview
This chapter gives you an overview of the NIR-MS-2000-C2F’s features, the
control panel and display unit, and a description of the operation.
The NIR-MS-2000-C2F Flour Analyser has been developed in Australia for
use by flour millers and grain processors, for measuring protein, moisture and
oil in grains and oil seeds as well as protein, moisture, water absorption and
starch damage in flour.
The NIR-MS-2000-C2F is a full spectrum NIR spectrophotometer. The NIR-
MS-2000-C2F uses a linear array detector and a spectrograph to provide the
NIR transmittance spectrum from 720 –1100 nm. Within this region of the
electromagnetic spectrum compounds such as protein, moisture, oil and
carbohydrates absorb infrared energy. By measuring the intensity of the
infrared energy that passes through a glass cell filled with grains, each of the
components can be measured.
The NIR-MS-2000-C2F has been designed to provide the following features:
• Grain Identification;
• Automatic Instrument Calibration;
• Spectral Matching;
Analysis Software
Your NIR-MS-2000-C2F comes ready to use, with all internal software
installed and calibrated. This internal software allows you to collect spectra and
analyse it to get protein, moisture, oil and other component readings. A serial cable
and interface software are provided for use with a computer so that data can be
uploaded from the NIR-MS-2000-C2F. A USB Memory device is supplied as a
means of uploading and downloading calibrations and data files.
A more extensive software package, NTAS, is available to allow greater
control of calibrations and data analysis. NTAS provides a Windows 95, 98, 2000
and XP Professional interface to the NIR-MS-2000-C2F allowing visualisation and
data manipulation of spectra collected from the field or in the lab.

Operations Manual
4 -
Description
The NIR-MS-2000-C2F Flour Analyser is provided with the following
equipment:
• Bench top case;
• NIR Spectrophotometer Calibrated;
• 2 x sample cells, 5mm pathlength powder cell and 16mm pathlength
cereal grain cell.
• Cleaning Brush;
• Calibrations of Protein and Moisture for Wheat and Protein, Moisture,
Water Absorption, Starch Damage and Ash in Flour;
• Instruction Manual;
• 240 VAC to 19 volt DC transformer;
• Spare lamp and fuse
• Null Modem serial cable and software disk.
• USB Memory Device
Accessories available as options:
• NTAS Software
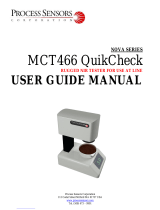
Figure 1. provides a schematic of the optical and electronic layout of the analyser.
Light from tungsten halogen lamp is shone through a sample cell holder, focusing
optics and into a flat field spectrograph and then onto a silicon photodiode array
detector. The amount of light passing through the optics is measured by the detector
and stored in the internal computer’s memory. This is referred to as the “100%
reference” reading. A sample of grain or oil seeds is loaded into a sample cell, that is
placed into the sample cell holder. The amount of light passing through the sample is
measured by the detector and stored into the internal computer’s memory. This is
referred to the “sample scan”.
The calibration models for each product are stored in the instruments memory chip.
The computer board applies the calibration model to the “sample scan” and
calculates the protein and moisture, or oil and moisture values for the sample.
BATTERY
POWER
SAMPLE
CELL
HOLDER
LAMP
HOLDER
LENSES
SPECTROGRAP
DETECTO
R BOARD
COMPUTER
INPUT/OUTPUT
BOARD
Figure 1, NIR-MS-2000-C2F mechanical layout diagram.

- 5 -
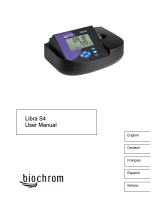
Figure 2. shows the LCD Screen and Keypad layout.
Figure 2, NIR-MS-2000-C2F top panel layout diagram.
• LCD Screen:
Output screen for the NIR-MS-2000-C2F. All data and interface
messages are displayed here.
• Sample Cell Holder:
Slot for the sample cell. Place the sample cell in the well when prompted
to do so.
• Contrast Control Arrows:
Controls the contrast of the LCD screen. Push the blue arrow to increase
the contrast (ie. darken the display) and push the yellow arrow to decrease
the contrast (ie. lighten the display).
ON/OFF
LCD
7
ABC
8
DEF
9
GHI
START
4
JKL
5
MNO
6
PQR
SAVE
1
STU
2
VWX
3
YZ
ENTER
Alpha/
Function
0
- ( )
.
$*
CANCEL
< CONTRAST >

Operations Manual
6 -
• LCD Backlight Button: The backlight is always ON.
• ON/OFF Button:
Turns the NIR-MS-2000-C2F ON / OFF.
• Start Button:
Press the Start Button to commence an analysis.
• Save Button:
Press the Save Button to save the results of an analysis.
• Enter Button:
When entering letters during saving results, press Enter to advance to the
next letter.
• Cancel Button:
To stop any operation before completion, press the Cancel Button. Cancel
button also deletes a character when entering a sample identity.
• Cancel Button: Pressing this button will rotate the motor in the reverse
direction and drive the sample cell up.
• Alpha/Numeric Button:
To enter letters or numbers into the Sample ID, press the Alpha/Numeric
Button to switch between the two modes. '▄' Denotes numbers and '_'
denotes letters. Also switches from Analysis Mode to Set Up Mode. In
Setup Mode allows the operator to change several operating setup
parameters. The Setup Mode options are described in more detail in later
sections.
• Keypad Buttons 0 – 9 and ‘.’:
To select a calibration and enter the Sample ID, use these buttons. When
in Alphabetic mode, press the numeric button to step through the
indicated letters, then press ENTER to advance to the next letter.
When in Numeric mode, press the required number and the cursor will
advance to the next position. The '0' key in the Alphabetic mode can be
toggled between '-', '<' and '>'.

- 7 -
Principle of Operation:
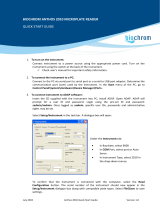
Protein, moisture, oil and starch absorb NIR energy (light) at specific frequencies
(wavelengths = nm), ie, protein – 1020nm, moisture – 970nm, oil – 910nm and
starch 820nm. The NIR spectrum of the sample, shown in figure 3, represents the
amount of light absorbed at each wavelength, which is proportional to the
concentration of each component. A calibration model is stored in the internal
computer’s memory for each component, eg, protein and moisture, for each product,
eg, wheat, barley etc.
To analyse a sample, the instrument collects the NIR spectrum for the sample, and
the computer applies the calibration model and computes the % protein and %
moisture.
Figure 3. NIR Spectrum of Wheat
Setting up NIR-MS-2000-C2F
To setup the NIR-MS-2000-C2F, perform the following actions:
• Connect the external power supply to the adapter on the back of the NIR-
MS-2000-C2F. Turn ON using the "ON/OFF" switch on the front panel.
Hold the ON/OFF button down for 1 to 2 seconds. Do not just poke at it.
When the power switch is turned ON, the LCD panel will light up, however the
internal computer takes approx. 20 seconds to boot up. You should hear two beeps
and the LCD screen will show the following information.

Operations Manual
8 -
Press Start to begin:
Figure 5, NIR-MS-2000-C2F Analysis Mode Screen
The instrument will perform a set of diagnostics and instrument warm up. Wait until
these procedures have finished. The screen will show a message, "Press any key".
Press any key and the instrument will proceed to the "Analysis Mode" screen..
Analysis Mode
When the instrument is in Analysis Mode, certain statistics are displayed. These
statistics are explained below.
S/N: Serial number of this instrument.
TIME: Current time of day.
DATE: Todays date
TEMP: Indicates the current internal temperature of the instrument.
Temperature can be useful for identifying when the climate conditions could be
adversely affecting the results. The instrument operates between 10C and 55C,
however the optimal operating temperature is 25-35C. If the instrument temperature
is less than 10C, the instrument will not function. If above 45C, the instrument will
NIR-MS-2000-C2F
SN:000000
NEAR INFRARED TRANSMISSION ANALYSER
Version 6. V1.1 12/08/09
NIR Technology Systems
Press any button…
Figure 4, NIR-MS-2000-C2F initialization screen
Status:
S/N: 783
TIME: 11.02
DATE: Aug 13
TEMP: 20C
RECORDS: 173
PRINTER: Epsom
OUTLIER: Z Score
CM: OFF
SCALE: OFF

- 9 -
advise that it is operating outside its calibration range. If above 50C, the instrument
not function.
RECORDS: This indicates the number of records the NIR-MS-2000-C2F has
stored in memory. When the NIR-MS-2000-C2F indicates 999 records have been
stored you should download the results.csv file to a PC computer and delete the
existing results.csv file from the instrument.
PRINTER: Indicates the driver selected for the printer
OUTLIERS: Indicates the type of Outlier Detection selected, ie, None, Z Score or
Min Max.
CM: Indicates if the Constant Moisture Correction for Protein is ON or OFF
SCALE: Indicates if a External Balance or Scale is selected.
Analysis
When you are ready to start an analysis, press the Start button. The screen
displays up to 5 products/calibrations. Enter the number of the product you wish to
use. If there are more than 5 products available press ENTER to view the next 5
products.
1 - Wheat
2 - Flour
Select a product:
Figure 6, Select product screen.
Wheat
Protein
Moisture
Lamp warming up….
Figure 7, Lamp warming up screen.

Operations Manual
10 -
Wheat
Protein: 13.2%
Moisture: 11.2%
Scanning
Figure 8, Scanning and Display Mode
Wheat 2009
Protein: 13.2%
Moisture: 11.2%
(Z Score) (CM)
Press START or SAVE
Figure 9, Scanning and Display Mode
Once the product has been selected, the instrument will display the following screen:
(Assuming product 1, "Wheat", was chosen above)
During the warm up period, the lamp is powered up and allowed to stabilise for a set
period of time, approx. 15 seconds. The instrument then measures the energy level
for the lamp. The 100% light level is recorded in the computers memory.
Once the instrument is calibrated, the LCD screen will prompt for the sample cell to
be loaded.
Take the appropriate sample cell (16 mm for wheat) and fill the cell above the
window and almost to the top. Also, note that the sample cells must be loaded in only
one direction. The gear teeth on the side of the cell must be facing the back of the
sample cell chamber. Once the cell has been pushed into the sample chamber the
motor will be activated and the cell will move down into five positions and then
come up into five positions.
For each position the constituents are calculated and displayed on the screen. When
all 10 scans are completed, the average of the results will be displayed.
Should the results be outside the ranges specified in the calibration, the screen will
display a message that the grains analysed are not consistent with the calibrations for
the selected product. Check that the correct product was selected.

- 11 -
Wheat
Protein: 13.2%
Moisture: 11.2%
(Z Score) (CM)
Enter Sample ID: ADC1243
Figure 11, SAVE data
Press SAVE to save the data or press START to begin the next analysis.
If the cell has not risen fully to the top position, press SAVE to save the results and
then press the CANCEL button and the motor will raise the cell. DO NOT FORCE
the cell out of the cell holder.
For Flour Analysis, take the 5mm powder cell and open it. Pour approximately 50ml
of flour into the cell. Scrap the excess flour of the top and clean the sides of any
excess flour. Close the cell and lock.
Select the Flour calibration and when prompted, insert the sample cell.
Saving Results
Once the analysis is completed, press the SAVE button to save the results. When in
SAVE mode, the instrument prompts for a Sample ID. The Sample ID can be entered
from the keypad. Both alphabetic and numeric characters can be included in the
Sample ID. To type in a letter, press the Alpha/Function button to get a small cursor
_ on the screen. Press the appropriate button to select the correct letter and then press
ENTER to advance to the next letter. To type in a number, press the Alpha/Function
button to get a large cursor and press the appropriate number. Since there is only one
number, the cursor will advance automatically. To delete the current character and
move to the previous position press the CANCEL button. To cancel the SAVE
procedure, remove all the characters, by pressing the CANCEL button to remove all
the characters, and press CANCEL once more. Once the desired Sample ID has been
entered press SAVE to confirm the save procedure.
When you save results, they are saved to the memory chip of the NIR-MS-2000-C2F.
The data can be retrieved from the Analyzer by connecting a PC and using either
MAS software, provided in the accessories kit, or NTAS software or by inserting the
USB Memory Device provided and using the internal software to download the data
file. The data can then be used to create new calibrations or stored for data
management purposes.

Operations Manual
12 -
Downloading / Uploading Data from NIR-MS-2000-C2F
A Null Modem serial cable and a software program (MAS) are required to connect
the NIR-MS-2000-C2F's computer board to a computer (Windows Xp, Vista,
Windows 7 32 bit). Connect the cable supplied to both the NIR-MS-2000-C2F and
the PC. Connect the RS232 Null Modem Cable to a serial port on your PC and the
other end to the serial port on the instrument.
• Place the CD-ROM into the PC CD Drive. Click on Setup.exe file and follow the
instructions to install the software.
• Once installed, open the Start menu on the bottom left hand corner of the screen,
select Programs and select NIR MAS Software.
If your PC does not have a male 9 pin D plug serial connector, the you can use a
USB to RS232 conveter. See the Technical Note 16 at the back of the manual.
The following will appear on the PC screen. Select the Scan and Display menu. The
following screen will appear. Press the Connect button. If the cabling is correct and
the settings are correct then a message “Connect Ex PC” will appear on the NIR-MS-
2000-C2F. If not connection is made, refer to the software instruction guide.

- 13 -
Upload Resutls.csv File.
To “Upload” the data from the NIR-MS-2000-C2F, select the File Menu and Upload
Results tab. Press the Browse button to locate the position in memory to store the
Resutls.csv file and then press Upload File From WGA.
Download Calibration Files.
To download a calibration file(called a product on the screen) to the NIR-MS-2000-
C2F, select the Calibration menu, Download Calibration. Browse to select the
appropriate Product.bin file, e.g, wheat.bin or flour.bin. Once selected, press teh
Download to WGA button.
To delete a calibration file from the NIR-MS-2000-C2F, type in the name of the file
and the appropriate path in the WGA File box:
WGA File: results.csv
Press the "Delete" button. There is no confirmation that the file is deleted.
Press EXIT to disconnect the PC from the NIR-MS-2000-C2F. The NIR-MS-2000-
C2F’s LCD panel will return to the Analysis Mode screen, as in Figure 5.
Note: If a connection cannot be made between the PC and the NIR-MS-2000-C2F,
then the most likely cause is that the Baud Rate is not set correctly.
Select the Coms Port button and change the Buad rate to 38400. Press Ok and then
EXIT, and try again.

Operations Manual
14 -
NIR-MS-2000-C2F Set Up Mode
To access the NIR-MS-2000-C2F Set Up Mode, press the 'ALPHA/FUNCTION' key
from the Analysis Mode screen (see Figure 5). The following screen will be
displayed:
Make a selection from the menu by pressing the number to the left of the option.
1) Date and Time Adjustment
By selecting 1 from the above screen, the Analyzer will prompt for the date to be
entered, as shown below:
The date format is a two digit day, a two-digit month and a two-digit year. Enter
today's date and press SAVE to store the new date to memory. Pressing SAVE
without entering a date will leave the date unchanged.
Once the date has been entered, the Analyzer will prompt for the time. The time
format is a two digit hour and a two-digit minute. Enter the current time and press
SAVE. Pressing save, without entering a date will leave the time unchanged.
Setup Menu:
1) Date and Time
2) Last 16 results
3) Product Setup
4) Systems Mode
5) USB Thumb Drive
6) Hardware Options
Figure 16, Setup Menu

- 15 -
Once the time has been entered, the screen will return to that in Figure 16.
2) Recall Last 16 Results
By selecting 2 from the Setup Mode screen, the Analyzer will display the last 16
results collected by the instrument, since it was last powered on. The following
screen summarises the display:
The ID field represents the ID of the sample or the time it was collected should the
ID not exist. The Const1 field represents the first constituent (eg Protein) and Const2
field will represent the second constituent (eg Moisture). If no samples have been
analysed, the display will read:
"No Samples Scanned".
3) Calibration Setup
By selecting 3 from the Setup Mode screen, enter the password if requested and press
SAVE. The password is CROPSCAN. The screen will display the following screen:
Make a selection from the menu by pressing the number to the left of the option.
Enter the date (dd.mm.yy): 04.06.99
Enter the time (hh.mm): 14.22
Enter the value and Press SAVE to store
Figure 17, Date and Time adjustment screen. Press SAVE to store the new
date and time.
Ref1 12.3 10.8 Ref9 12.7 10.1
Ref2 13.8 9.0 Ref10 11.8 12.2
Ref3 14.8 8.7 Ref11 10.7 12.3
9.36 15.8 10.9 Ref12 10.7 12.4
9.45 12.6 9.8 Ref13 13.7 12.4
Ref6 10.7 10.8 14.42 12.8 12.2
Ref7 9.0 9.8 Ref15 9.8 10.2
12.41 10.7 9.6 Ref16 7.0 12.4
Figure 18, NIR-MS-2000-C2F display of the last 16 results since power up.

Operations Manual
Bias and Slope Adjustment
Each calibration has one or several components, eg, protein, moisture and fat. Each
of these component calibration models have a Bias and Slope adjustment facility.
The Bias and Slope can be adjusted in order to correct the calibration to some
reference method of analysis for each component, ie, Kjeldalh for protein, Oven
Drying for moisture and Soxhlet Extraction for fat.
Bias adjustment is where all samples read high or low by a constant
amount. The average difference between the NIR readings and
reference readings = the Bias.
As shown above the NIR anlayser is reading 0.5 lower than the reference
method. As such, 0.5 is added to the existing bias to bring the NIR analyser
into alignment with the reference method.
Slope and Bias adjustment is where some samples read high and some
read low as compared with the reference readings. The Slope and Bias
is calculated by plotting the NIR Analyser readings vs the reference
readings in Excel. By adding a trend line in Excel to the plot, the Slope and
Bias can be taken from the equation shown.
Plot vs Ref Protein
9.5
10.5
11.5
12.5
13.5
14.5
9.5 10.5 11.5 12.5 13.5 14.5
Ref Protein%
Protein%
Sample Cropscan Ref Diff
19.5 10 0.5
211 11.6 0.6
312.2 12.6 0.4
413.4 14 0.6
514.2 14.5 0.3
Bias = Average 0.5
1 - Wheat Soft 6 - Wheat Hard
2 - A S W 7 -
3 - Barley 8 -
4 - Canola 9 -
5 - Oats 10 -
Press ENTER for more
Select Product
Figure 22, Select product screen.

- 17 -
In the example above, the Slope = 1.3847(rounded off to 1.385) and the Bias
or Intercept = -4.6.
The Bias and Slope constants can be modified by selecting 1 from the
CALIBRATION Setup Mode screen. The following screen will be displayed:
Select the product that you wish to change. When the product has been
selected the following screen will be displayed:
(Assuming product 1, "Wheat Soft", was chosen above)
The Protein Bias value will be presented first. Enter the new value and press SAVE
to store it to memory, or just press SAVE to leave the previous value, displayed in
brackets, unchanged. Once the Protein Bias value has been entered the Protein Slope
value will be displayed, enter the new slope value the same way. Now enter values
for the Moisture Bias and Slope values and press SAVE. The screen will return you
to the CALIBRATION Setup Mode screen (Figure 19).
Wheat Soft
Protein Bias Value (-2.30):
Protein Slope Value (+1.200):
Moisture Bias Value (+0.00):
Moisture Slope Value (+1.000):
Enter the value and Press SAVE to store
Figure 21, Bias and slope adjustment screen. Press SAVE to store the new
values.
Plot vs Ref Protein
y = 1.3847x - 4.6424
9.5
10.5
11.5
12.5
13.5
14.5
9.5 10.5 11.5 12.5 13.5 14.5
Ref Protein%
Protein%
CALIBRATION Setup Mode
1 - Bias and slope adjustment
2 - Deleting Calibration
3 - Autocalibration
4 - Outlier Detection
5 – Delete Result File
Figure 19, Calibration Setup Mode screen.
12.
16
6
-
Sample Ref Diff
110.5 10 -0.5
211.8 11.6 -0.2
312.6 0
413.
2 13.8 0.6
513.8 14.5 0.7
Bias = Average 0.1

Operations Manual
18 -
Deleting Calibration
After selecting 2 from the CALIBRATION Setup Mode screen, the following
screen will be displayed. Select the product calibration to delete, or press
cancel to exit. When you select a product to delete, a screen will appear
asking you to confirm that you want to delete the product. Press Y to confirm
or any other button to not delete the product.
Autocalibration
The Autocalibration routine will automatically adjust the bias of instrument with any
reference laboratory samples. It requires minimum of 1 and maximum of 4 samples
analysed by the laboratory and the Analyser. The operator follows the instructions on
the screen to enter in the laboratory's results and the Analyser adjusts the bias of the
calibration so that the Analyser reads the same as the laboratory's instrument.
Enter the number of samples (from 1 to 4) that you will use for Autocalibration and
press SAVE. The next screen is the Select product screen (Figure 25), select the
product you want to use. After selecting the product the normal routine of analysis
will proceed. The final screen will display the old and new Slopes & Bias. Press
SAVE to store the new Calibration or Cancel. After saving, press Cancel to return to
Figure 25, Autocalibration results screen.
main menus.
1 - Wheat Soft 6 - Wheat Hard
2 - A S W 7 -
3 - Barley 8
-
4 - Canola 9 -
5 - Oats 10 -
Press ENTER for more Select Product
Figure 20, Select product screen.
Protein Bias Old: 0.5 Protein Bias New: 1.0
Moisture Bias Old: 0.1 Moisture Bias New: 0.3 ▄
Press SAVE to store or CANCEL
Figure 26, Autocalibration results screen.
Figure 23, Autocalibration Mode screen.
Protein value: 12.10 Ref Protein: ▄
Moisture value: 11.20 Ref Moisture: ▄
Enter Ref. value & Press SAVE to store
Enter # of Cal Samples: ▄

- 19 -
Outlier Detection
This feature checks each scan and the results to see if they are consistent with the rest
of the results. If the software detects an “Outlier” it will reject the results and not
include the specific results in the averaged results.
There are two outlier detection methods;
1) Z Scores: uses a statistical calculation to detect results greater than 1.5 times
the standard deviation from the mean of all the scans.
2) Min Max: simply rejects the lowest and highest results.
Select either method or select 3) None for no outlier detection.
Outlier Detection
1) Z Score
2) Min and Max Levels
3) None
Figure 26. Outlier Detection Options

Operations Manual
20 -
4) System Mode
By selecting 4, you will enter the System Mode. The System Mode is password
protected and for use by only qualified service staff. The Password is ”S”, then
SAVE.
1) Mode Configuration.
Select 1). The screen will show two columns of parameters with either a 1 or 0
following each parameter. 1 means “ON” and 0 means “OFF”. These parameters
govern how the instrument collects and stores data. The following describe each of
these parameters.
• Warm Up: Causes the instrument to undergo a warm up period when turned on.
• Temp Prof: Causes the instrument to correct for temperature drift using the
profiling factors set in the wga.ini file.
• Adap Scan: Sets the signal integration mode to “Adaptive”, such that the
integration time changes from 5000, 10000, 20000, 40000 and 80000 usecs
depending upon the absorbance level.
• PrinterOn: Sets the serial port to printer rather than for a PC.
• Lamp Preheat: Causes the instrument to wait a fixed period, default 15 secs, after
turning on the lamp before taking the 100% scan.
• Idle Zero: Sets the instrument to collect the Zero scan continuously while idle.
• Save Each: Stores all five scans rather than the average of the five.
• Match Sp: Causes the instrument to match the sample scan to the calibration scans.
Only available if the calibration file has the correct parameters and data in the file.
• Sound En: Turns on or off the internal beeper.
• Cell Code: Sets the instrument to look for a Cell Code for the sample cells. No
longer used and should be set to “0”.
• Full Scan: Sets the instrument to scan all 38 pixels. If set to “0” then the instrument
skips any pixel where the “B” coefficient is set to “0”. This can educe the scan
time.
• Password On: Sets the Password for the Calibration Mode. If set to “0” then no
password is required.
• Indiv Res: Displays the results for all five scans. If set to “0”, then each scan will be
shown as “1, 2, 3, 4, 5” and the average of the five scans will be displayed. If set to
“1” then all five readings are shown on the screen and the average shown at the end
of the analysis.
• ProtCM: Sets the results to display the first constituent to Constant Moisture basis.
The Constant Moisture basis is set in the calibration file.
• LiqSamp: Sets the instrument to read liquid samples.
• DecPl: =1 Sets the display to read 2 decimal places.
• ContinuosuCal = 1 Set the instrument up so that the previous product selection is
used when Start is pressed. Press Cancel before Press Start to bring up the Product
menu.
• Weighbridge = 1: Sets the instrument’s serial port to operate with the Analyser
Weighbridge Software.
/