Page is loading ...

OPTOELECTRONICS CIRCUIT COLLECTION
By Neil Albaugh
AVALANCHE PHOTODIODE BIAS SUPPLY 1
Provides an output voltage of 0V to +80V for reverse biasing
an avalanche photodiode to control its gain. This circuit can
also be reconfigured to supply a 0V to –80V output.
LINEAR TEC DRIVER–1
This is a bridge-tied load (BTL) linear amplifier for driving
a thermoelectric cooler (TEC). It operates on a single +5V
supply and can drive ±2A into a common TEC.
LINEAR TEC DRIVER–2
This is very similar to DRIVER–1 but its power output stage
was modified to operate from a single +3.3V supply in order
to increase its efficiency. Driving this amplifier from a
standard +2.5V referenced signal causes the output transis-
tors to have unequal power dissipation.
LINEAR TEC DRIVER–3
This BTL TEC driver power output stage achieves very high
efficiency by swinging very close to its supply rails, ±2.5V.
This driver can also drive ±2A into a common TEC. Opera-
tion is shown with the power output stage operating on
±1.5V supplies. Under these conditions, this linear amplifier
can achieve very high efficiency.
SBEA001 - SEPTEMBER 2001
Application Report
The following collection of analog circuits may be useful in electro-optics applications such as optical networking
systems. This page summarizes their salient characteristics.
LASER DIODE DRIVER–1
A single-ended voltage–controlled current source is shown
here. This circuit operates from a single +3.3V supply and it
can drive from 0A to 2A into a laser diode with a 0V to 2V
input from a Digital-to-Analog (D/A) converter. Its input
can be also be configured for a 0V to –2V input voltage.
LASER DIODE DRIVER–2
Similar to the previous circuit except that it operates from
±5V supplies and it is inverting; i.e., drives from 0A to 2A
into a laser diode with a 0V to –2V input. A very low noise
bipolar input op amp allows this circuit to achieve a low
noise output current, an important consideration in dense
channel spacing systems. As drawn, neither terminal of the
laser diode is grounded.
TEMPERATURE UNDER–AND OVER–RANGE
SENSING WITH A WINDOW COMPARATOR
This circuit is useful to monitor the temperature of a TEC
thermistor, to sense an out-of-range condition, or if the
thermistor is shorted or open. Current sources make the
threshold adjustments non-iterative. The supply voltage is
+5V.
www.ti.com

2
SBEA001
AVALANCHE PHOTODIODE
BIAS SUPPLY–1
An avalanche photodiode (APD) is commonly used in opti-
cal detector circuits that require high sensitivity and wide
bandwidth. A high reverse bias voltage across the photo-
diode junction creates avalanche gain, and varying the re-
verse bias voltage can control this gain. Although some
APDs require a bias of a few hundred volts, many InGaAs
and Si APDs require only 60V to 80V.
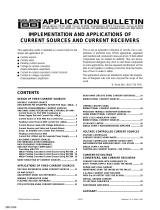
The circuit shown in Figure 1 can provide a positive bias
voltage of up to +80V to an APD. The 0V to +2V input
control voltage can be a DAC output or from an analog
source.
The OPA445 high-voltage op amp is rated to operate with up
to ±45V supplies and it can provide up to ±15mA if its
power dissipation limits are observed. To obtain a high
positive output voltage from this op amp, it can be operated
from unequal supplies as long as the voltage difference
between the supplies is 90V or less and the amplifier’s
common-mode input voltage stays within its specified range.
To allow the OPA445’s output voltage to swing to zero, a
negative supply of –5V was chosen. Staying within the 90V
supply voltage difference specification, a +85V positive
supply was chosen. This allows the OPA445 output voltage
to swing up to +80V.
R
IN
and R
F
set the gain of this noninverting op amp circuit
to 40V/V. As illustrated in Figure 2 an input of 0V to +2V
results in an output of 0V to +80V.
Other gains can be calculated by the equation:
Av
R
R
F
IN
=
+ 1
Other op amps can be used in this circuit if lower output
voltages are desired. An OPA551 or OPA552 can be used
for a 0V to +50V bias supply if its positive supply voltage
is reduced to +55V.
Bandwidth of this circuit is about 60kHz, as seen in
Figure 3. To reduce noise, a capacitor can be placed in
C
2
1nF
C
1
1nF
V+
V–
R
F
442kΩ
R
SERIES
50kΩ
R
SHUNT
100kΩ
C
SHUNT
10pF
Simplified APD Model
5
6
1
7
3
2
4
R
IN
11.3kΩ
V
IN
0V to +2V Input = 0V to +80V Output
OPA445
U1
V+
85V
+
–
–
V–
5V
+
FIGURE 1. Positive Bias Supply Circuit Diagram.
parallel with R
F
. In addition, low-pass filtering can be
accomplished by adding a passive RC low-pass filter (LPF)
on the DAC output, the OPA445 output, or both. Low noise
on the bias supply is important, noise on an APD bias supply
will feed through into the following stage–usually a
transimpedance amplifier.
80
60
40
20
0
Output (V)
0 0.5 1.0 1.5 2.0
V
IN
(V)
V
OUT
vs V
IN
FIGURE 2.
APD Bias Supply DC Output versus Input Voltage.
1000
100
10
1
Output (mV)
1 10 100 1k 10k 100k 1M
Frequency (Hz)
FIGURE 3. APD Bias Supply Small Signal Bandwidth.

SBEA001
3
The circuit’s transient response in Figure 4 shows a clean
step response with no peaking or overshoot.
The OPA445 is now offered in a SO-8 surface–mount
package, so adding a programmable APD bias supply into a
corner of a larger PCB layout is now feasible.
This bias supply circuit can easily be reconfigured to supply
a 0V to –80V output by changing the op amp’s supplies to
+5V and –85V. A 0V to –2V input is required, but a 0V to
+2V input can be used if the input is connected to R
IN
and
the op amp noninverting input is grounded. This changes the
op amp to an inverting configuration. Note that the circuit’s
input impedance is now lower (equal to R
IN
) if the OPA445
is used as an inverter. The familiar inverting op amp gain
equation is:
Av
R
R
F
IN
=
–
Output Voltage
0V to 2V
1kHz Square Wave Input
100
80
60
40
20
0
Output (V)
0 0.2 0.4 0.6 0.8 1.0 1.2 1.4 1.6
Time (ms)
FIGURE 4. APD Bias Supply Transient Response.
LASER DIODE DRIVER–1
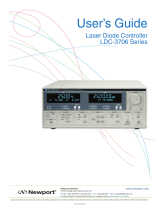
The voltage-controlled current source circuit shown in Fig-
ure 5 can be used to drive a constant current into a signal or
pump laser diode. This simple linear driver provides a
cleaner drive current into a laser diode than switching PWM
drivers.
The basic circuit is that of a Howland current pump with a
current booster (Q
1
) on the output of a R-R CMOS OPA350
op amp (U
2
). Laser diode current is sensed by differentially
OPA350
C
1
120pF
R
4
10kΩ
6
7
2
3
4
R
3
100kΩ
R
1
100kΩ
V
IN
U
2
R
2
10kΩ
V+
V–
R
SHUNT
0.1Ω
Q
1
FTZ869
INVERTING INPUT
V
1
3.3V
+
–
1V
IN
= 1A
OUT
as shown
LASER
DIODE
NOTE: Bypass capacitors are not shown.
FIGURE 5. Laser Diode Constant–Current Driver–1, Circuit Diagram.
measuring the voltage drop across a shunt resistor (R
SHUNT
)
in series with the laser diode. The output current is con-
trolled by the input voltage (V
IN
) that may be from an analog
voltage source or from a voltage-output DAC. As shown, the
scale factor is 1V input equals 1A output.
The scale factor (V
IN
/I
OUT
) can be set to other values by
choosing appropriate resistor values using the equation:
V
I
R
R
R
IN
OUT
3
4
SHUNT
= •
and, R
1
= R
3
, R
2
= R
4

4
SBEA001
FIGURE 7. Output Current and Q
1
Power Dissipation versus
Input Voltage with 5V Supply.
6.0
4.0
2.0
0
2.0
1.0
0
P
D
(W)I
OUT
(A)
0 0.5 1.0 1.5 2.0
V
IN
(V)
FIGURE 8. Laser Driver Transient Response with +3.3V
Supply.
FIGURE 9.
Laser Driver Transient Response with +5V Supply.
V
IN
= 2V
V
IN
= 1.5V
V
IN
= 1V
V
IN
= 0.5V
2.5
2.0
1.5
1.0
0.5
0
I
OUT
(A)
0 100 200 300 400 500
Time (µs)
A P–Spice simulation (DC sweep) was performed on V
IN
,
sweeping the input voltage from 0V to 2V. The lower curve,
shown in Figure 6, shows the relationship of the laser diode
current to the input voltage. Power dissipation of Q
1
is
shown in the upper curve.
FIGURE 6. Output Current and Q
1
Power Dissipation ver-
sus Input Voltage with 3.3V Supply.
3.0
2.0
1.0
0
2.0
1.0
0
P
D
(W)I
OUT
(A)
0 0.5 1.0 1.5 2.0
V
IN
(V)
Operating on a supply voltage of 3.3V, Q
1
dissipates only
1.5W at an output current of 1A. This is well within the
capability of the FTZ transistor, as its SOT-223 package can
dissipate heat into the copper traces on a PC board.
Similar curves are shown in Figure 7 for operation on a 5V
supply voltage. This clearly shows the power advantage in
operating the current source on a low supply voltage. The
higher 5V supply voltage is advantageous if a higher output
compliance voltage is required. A laser diode macromodel
was unavailable, so a laser diode junction was simulated by
a series connection of three silicon diodes.
sponse on both the rising and falling edges of the pulse.
Figure 9 also shows clean pulse response operating on a 5V
supply.
Changing the value of the shunt resistor or the scale factor
will necessitate changing the compensation capacitor C
1
.
Verify that your circuit is stable before connecting an expen-
sive laser diode to the output.
If a negative output control voltage is available, it can be
applied to R
1
and R
3
is then tied to ground. The amplifier is
then configured as an inverting amplifier.
The power booster used for Q
1
is a very high gain single NPN
transistor, and is not a Darlington, it has a Beta of over 300
at a collector current of 1A, allowing the CMOS OPA350 op
amp to easily drive it to high currents. Zetex rates its continu-
ous collector current as 6.5A but SOA limits are reached
before approaching this current.
If a unidirectional output current is acceptable, this circuit
can be used to drive a TEC for cooling a laser diode or an
APD. Adding a mechanical switch or a low on-resistance
H-bridge will allow the TEC polarity to be switched and
changed from heating to cooling.
Satisfactory operation of this circuit should be verified in
your actual application by breadboarding and testing.
The P–Spice Probe output of a transient response simulation is
shown in Figure 8. The input voltage pulse amplitude was
stepped from 10mV to 500mV to 10mV to 2V, the current
output waveform was plotted. The circuit displays clean re-
V
IN
= 2V
V
IN
= 1.5V
V
IN
= 1V
V
IN
= 0.5V
2.5
2.0
1.5
1.0
0.5
0
I
OUT
(A)
0 100 200 300 400 500
Time (µs)

SBEA001
5
LASER DIODE DRIVER–2
The voltage-controlled current source circuit shown in
Figure 10 can be used to drive a very low-noise constant
current into a signal or pump laser diode. This simple linear
driver provides a far cleaner drive current into a laser diode
than a switching PWM driver can achieve.
The basic circuit is that of an NPN transistor current booster
(Q
1
) on the output of (U
1
), a very low noise bipolar op amp
OPA227. Laser diode current is sensed by measuring the
voltage drop across a shunt resistor (R
SHUNT
) in the emitter
of Q
1
. The output (laser) current is controlled by the input
voltage (V
IN
) that may be from an analog voltage source or
from a voltage-output DAC. As shown, the scale factor is
–1V input equals 1A output.
The scale factor (V
IN
/I
OUT
) can be set to other values by
choosing appropriate resistor values using the equation:
V
I
R
R
•R
IN
OUT
1
2
SHUNT
=
A P–Spice simulation (DC sweep) was performed on V
IN
,
sweeping the input voltage from 0V to –2V. The lower curve
shown in Figure 11 shows the relationship of the laser diode
current to the input voltage. Power dissipation of Q
1
is
shown in the upper curve. Operating on a supply voltage of
3.3V, Q
1
dissipates only 1.5W at an output current of 1A.
This is well within the capability of the FTZ851 transistor,
as its SOT-223 package can dissipate heat into the copper
traces on a PC board.
A similar DC sweep output current (I
OUT
) versus V
IN
curve
is obtained with Q
1
operating on a 5V supply. The higher 5V
supply voltage is advantageous if a higher output compli-
FIGURE 10. Laser Diode Constant-Current Driver–2 Circuit Diagram.
FIGURE 11.Output Current and Q
1
Power Dissipation Ver-
sus Input Voltage with 3.3V Supply.
OPA227
C
1
100pF
R
1
1kΩ
6
7
2
3
4
U
1
V+
V–
V–
R
SHUNT
0.1Ω
R
1
10kΩ
Q
1
FTZ
V
S
3.3V
+
–
–
–
LASER
DIODE
V+
V+
V
IN
V+
5V
+
V–
V–
5V
+
851
NOTE: Bypass capacitors are not shown.
3.0
2.0
1.0
0
2.0
1.0
0
P
D
(W)I
OUT
(A)
–2.0 –1.5 –1.0 –0.5 0
V
IN
(V)
LASER CURRENT
ance voltage is required. Op amp U
1
supplies can be from
±5V to ±15V.
See Figure 12 for the P–Spice Probe output of a transient
response simulation. The input voltage pulse amplitude was
stepped from –10mV to –500mV to –10mV to –2V, the
current output waveform was plotted. The circuit displays
clean response on both the rising and falling edges of the
pulse. The circuit simulation also exhibited clean pulse
response with Q
1
operating on a 5V supply.
Changing the value of the shunt resistor or the scale factor
will necessitate changing the compensation capacitor C
1
.
Verify that your circuit is stable before connecting an expen-
sive laser diode to the output.

6
SBEA001
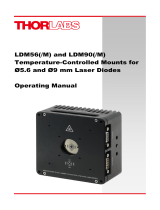
LINEAR TEC DRIVER–1
The linear thermoelectric cooler (TEC) driver circuit is
capable of driving ±2A into a TEC (see Figure 15). The
circuit operates on a single +5V supply and drives the TEC
in the highly desirable “constant-current” mode. A bridge-
tied load (BTL) amplifier topology achieves bidirectional
current output. This type of amplifier drives its load differ-
entially, so the TEC must not be grounded on either end. An
input offset of 1/2 supply voltage (in this case, an offset of
±2.5V) is used to allow the amplifiers to swing in both
directions and to interface with a single-supply input voltage
source. This is represented in the circuit by V
OS
.
In Figure 15, voltage V
IN
is amplified by a R-R CMOS op amp
U
1
, with a class B power output stage (formed by the addition
of a complimentary power transistor pair Q
1
and Q
3
) that drives
one end of a TEC load through shunt resistor R
4
. A CMOS
instrumentation amplifier (IA) U
3
senses the voltage drop
across the shunt resistor and amplifies it by 50, it then feeds it
back to the input of U
1
. This feedback approach forces the
output TEC current to be a function of V
IN
. Shunt resistance and
IA gain determines the scale factor of the circuit.
V
I
A•R
IN
OUT
V4
=
where A
V
is the IA gain in V/V
A P-Spice simulation (DC sweep) was performed on V
IN
,
sweeping the input voltage from –2.5V to +2.5V. This is
equivalent to an input voltage of 0V to +5V from an external
voltage source.
The P-Spice Probe output current to the TEC is shown in
Figure 13. TEC current is shown for three different sizes;
1Ω, 1.5Ω, and a 2Ω TEC. When operating on a single +5V
supply, this driver is capable of driving a 1Ω or 1.5Ω TEC
to 2A. Output voltage compliance limits the 2Ω TEC current
to about 1.6A.
As Figure 13 illustrates, this TEC driver amplifier is a
voltage-controlled current source. Constant-current drive
assures that TEC drive current is independent of production
variations in TEC junctions or long-term aging. Constant-
current drive also eliminates the effect of thermal “back
FIGURE 13. TEC Current Versus Input Voltage V
IN
.
FIGURE 14. Output Transistor Power Dissipation.
3.0
2.5
2.0
1.5
1.0
0.5
0
P
D
(W)
–3.0 –2.0 –1.0 0 1.0 2.0 3.0
V
IN
(V)
1Ω TEC
1Ω TEC
2Ω TEC 2Ω TEC
1.5Ω TEC 1.5Ω TEC
V
OPA
= +5V
V
S
= +5V
A laser diode macromodel was unavailable so a laser diode
junction was simulated by a series connection of three
silicon diodes. This driver circuit requires both the anode
and cathode of the laser diode to be floating.
The power booster used for Q
1
is a very high gain single
NPN transistor, and is not a Darlington, it has a Beta of over
100 at a collector current of 2A, allowing the OPA227 op
amp to easily drive it to high currents. Zetex rates its
continuous collector current as 6A, but SOA limits are
reached before approaching this current.
Satisfactory operation of this circuit should be verified in
your actual application by breadboarding and testing.
FIGURE 12.Laser Driver–2 Transient Response with +3.3V
Supply.
V
IN
= –2V
V
IN
= –1V
2.5
2.0
1.5
1.0
0.5
0
I
OUT
(A)
0 100 200 300 400 500
Time (µs)
V
IN
= –1.5V
V
IN
= –0.5V
EMF” on current through the TEC under dynamic tempera-
ture control conditions.
To determine the circuit’s power dissipation and the require-
ments for heat sinking the SOT-223 output power transis-
tors, a simulation was run by sweeping the DC input voltage
as before, and using the same size TECs. The results are
shown in Figure 14.
4.0
2.0
0.0
–2.0
–4.0
TEC Current (A)
–3.0 –2.0 –1.0 0 1.0 2.0 3.0
V
IN
(V)
1Ω TEC
2Ω TEC
1.5Ω TEC

SBEA001
7
R
4
0.02Ω
R
5
15Ω
C
3
4.7nF
C
1
10nF
TEC
R
1
10kΩ
OPA353
OPA353
R
3
10kΩ
R
6
15Ω
C
2
10nF
R
2
10kΩ
+
–
V
OS
V
OPA
V
S
V
OS
V
OPA
V
S
V
OPA
V
OS
3
7V+
8
1
2
6
4
3
2
7
6
4
V–
U
3
IN+
IN–
REF
INA155
Q
2
FTZ869
Q
4
FTZ968
V+
V–
C
4
470pF
Q
3
FTZ968
Q
1
FTZ869
6
7
2
3
4
V–
V+
U
1
U
2
V
IN
V
OS
2.5V
+
––
V
S
5V
V
S
+
V
OPA
5V
V
OPA
5kΩ
5kΩ
22.2kΩ
22.2kΩ
200kΩ
200kΩ
NOTES: (1) Optional: use one dual op amp OPA2353.
(2) Bypass capacitors on Q
1
, Q
2
, and U
3
are not shown.
FIGURE 15. TEC Driver–1 Circuit Diagram

8
SBEA001
Power dissipation of one NPN Q
1
and one PNP Q
3
power
output transistor is shown in this sweep. The dissipation of
the devices in the other half of the bridge (NPN = Q
2
and
PNP = Q
4
) will be the same, as shown in Figure 16.
Depending on whether the TEC is in its cooling or heating
mode, power is dissipated in Q
1
and Q
4
or in Q
2
and Q
3
.
Driver efficiency is usually a concern in large multi-channel
systems due to limitations on the total power dissipation of
the system. Linear amplifiers do not reach the efficiencies of
PWM switching types, but they do offer important advan-
tages, principally their very low noise. Switching noise
interference in laser and APD circuits is not a concern with
linear drivers.
The DC simulation data was used to plot the efficiency of the
driver. To simplify the calculation, only the power output
stage was considered. The CMOS OPA353 op amp power
dissipation is only about 26mW, so deleting it contributes
little error to the overall efficiency calculation. In this calcu-
lation, efficiency is considered to be the ratio of the power
delivered to the load TEC to the power supplied to the driver.
For example, a current of 1A into a 1Ω TEC represents a
power P
OUT
of 1W dissipated in the load (P
OUT
= I
2
R). The
power supplied to the driver P
IN
is 1A from the = 5V supply,
or 5W (P
IN
= E • I).
Therefore:
Eff(%)
P
P
•100, or Eff(%)
I•R
V•I
•100
1A •1
5V•1A
OUT
IN
2
SS
2
===
Ω
=•%100 20
Swinging the output voltage close to the supply rails mini-
mizes the voltage across the output transistor, thus reducing its
power dissipation. Likewise, it maximizes the voltage across
the load. As can be seen from the equation above, this
increases the efficiency of a linear driver. In fact, as seen in
Figure 16, this circuit can reach an efficiency of over 60%
under favorable conditions. The discussion of TEC Drivers 2
and 3 investigates this further.
100
80
60
40
20
0
–3.0 –2.0 –1.0 0 1.0 2.0 3.0
2Ω TEC
1.5Ω TEC
1Ω TEC
V
OPA
= +5V
V
S
= +5V
Efficiency (%)
FIGURE 16. Driver Efficiency with 1Ω, 1.5Ω, and 2Ω Loads.
2.0
1.5
1.0
0.5
0
TEC Current (A)
100 1k 10k 100k 1M 10M 100M
Frequency (MHz)
1Ω TEC
1.5Ω TEC
2Ω TEC
FIGURE 17. TEC Driver Amplifier Frequency Response.
Some peaking is shown in the frequency response curves of the
1Ω and 1.5Ω TEC but increasing the capacitance of the com-
pensation capacitors C
3
and C
4
can eliminate this. Notice that
the capacitance of C
3
and C
4
are not the same. Amplifier U
1
requires more capacitance than U
2
because of the presence of
feedback gain provided by the instrumentation amplifier, U
3
.
Similar results are seen in Figure 18, a P–Spice transient
simulation of this TEC driver amplifier. Slight peaking is noted
for heavy loads, as predicted by the frequency response curves.
Also evident in the transient response waveform is a small
crossover distortion “glitch” around 0A output current due to
the delay between turning off one transistor before its compli-
mentary transistor turns on. For example, the op amp driving
the power transistors must slew quickly between the voltage
at which the NPN transistor turns off and the PNP transistor
turns on. Due to the fact that this amplifier uses a Class B
output stage, this region is 2V
BE
. A
fast op amp, such as the
OPA353, minimizes the crossover distortion and enhances
stability about the crossover region. For applications such as
an audio amplifier, the output stage transistors could be biased
slightly into conduction (class AB1) which would eliminate
the crossover region altogether. Applications for driving
loads such as a thermoelectric cooler do not warrant the
increased complexity of a Class AB1 output stage.
1Ω TEC
2Ω TEC
1.5Ω TEC
1.5
1.0
0.5
0
–0.5
–1.0
–1.5
TEC Current (A)
0246810
Time (ms)
FIGURE 18. TEC Driver Transient Response.
Driver–amplifier loop stability was investigated by running
an AC and Transient simulation. Results of the AC simulation
are shown in Figure 17.

SBEA001
9
LINEAR TEC DRIVER–2
The linear TEC driver circuit (see Figure 21) is capable of
driving +1.5A and –1A into a TEC. The small-signal ampli-
fier circuit operates on a single +5V supply and the power
output stage operates on a single +3.3V supply to minimize its
power dissipation. This circuit drives the TE cooler in the
highly desirable “constant-current” mode. A BTL amplifier
topology achieves bi-directional current output. This type of
amplifier drives its load differentially, so the TEC must not be
grounded on either end.
An input offset of 1/2 the op amp supply voltage V
OPA
(in this
case, an offset of +2.5V) is used to allow the amplifiers to swing
in both directions and to interface with a single-supply input
voltage source. This is represented in the circuit by V
OS
.
In the schematic, voltage V
IN
is amplified by a R-R CMOS
op amp U
1
with a class B power output stage (formed by the
addition of a complimentary power transistor pair Q
1
and
Q
3
) that drives one end of a TEC load through shunt resistor
R
4
. A CMOS INA155 instrumentation amplifier (IA) U
3
senses the voltage drop across the shunt resistor and ampli-
fies it by 50; it then feeds it back to the input of U
1
. This
feedback approach forces the output TEC current to be a
function of V
IN
. Shunt resistance and IA gain determines the
scale factor of the circuit.
V
I
A•R
IN
OUT
V4
=
where A
V
is the IA gain in V/V.
A P–Spice simulation (DC sweep) was performed on V
IN
,
sweeping the input voltage from –2.5V to +2.5V. This is
equivalent to an input voltage of 0V to +5V from an external
voltage source.
The P–Spice Probe output current to the TEC is shown in
Figure 19.
FIGURE 19. TEC Current Versus Input Voltage V
IN
.
While this is the optimum offset to allow the op amp to
swing symmetrically to its supply rails, it creates a problem
for the output transistors. To swing optimally to its rails, it
would be biased to 1/2V
S
to half its supply of only +3.3V or
an offset of 1.65V. The 2.5V offset that is used creates an
unbalance in the output transistor bridge, causing some
problems as we shall see.
As Figure 19 illustrates, this TEC driver amplifier is a
voltage-controlled current source. Constant-current drive
assures that TEC drive current is independent of production
variations in TEC junctions or long-term aging. Constant-
current drive also eliminates the effect of thermal “back
EMF” on current through the TEC under dynamic tempera-
ture control conditions.
To determine the circuit’s power dissipation and the require-
ments for heat sinking the SOT-223 output power transis-
tors, a simulation was run by sweeping the DC input voltage
as before, using the same sizes of TECs. The results are
shown in Figure 20.
3.0
2.5
2.0
1.5
1.0
0.5
0
P
D
(W)
–3.0 –2.0 –1.0 0 1.0 2.0 3.0
V
IN
(V)
1Ω TEC
2Ω TEC
1.5Ω TEC
V
OPA
= +5V
V
S
= +3.3V
FIGURE 20. Output Transistor Q
1
and Q
3
Power Dissipation.
Power dissipation of one NPN (Q
1
) and one PNP (Q
3
) power
output transistor is shown in this sweep. Note the difference in
power dissipation between the NPN and PNP transistor. This is
a direct result of the unbalance caused by the offset voltage
problem previously noted. The dissipation of the devices in the
other half of the bridge (NPN = Q
2
and PNP = Q
4
) are similar
but a “mirror image” as seen in Figure 4. Depending on whether
the TEC is in its cooling or heating mode, power is primarily
dissipated in the PNP transistor Q
3
or in Q
4
. The power
dissipated in NPNs, Q
1
and Q
2
, is relatively minor.
The effects of limited output compliance voltage are also
clearly seen in the curve of Figure 22.
This compliance limit can also be seen in the power transis-
tor output voltage driving the each end of the TEC load (see
Figure 23). Note that the amplifier’s output voltage polarity
crossover point is at the 2.5V input bias point. Biasing the
output transistors at their optimum 1.65V point would allow
the output voltage to swing symmetrically to the supply
rails, +3.3V and ground.
Driver efficiency was not simulated for this TEC driver
amplifier.
TEC current is shown for three different sizes; 1Ω, 1.5Ω,
and a 2Ω TEC. With the output transistors operating on a
single +3.3V supply, this driver is capable of driving a 1Ω
TEC to over 2A or 2Ω TEC to over 1A in one direction but
its output current capability is lower in the opposite direc-
tion. Output voltage compliance limits are asymmetrical due
to the 1/2V
OPA
offset voltage applied to the op amp input.
3.0
2.0
1.0
0
–1.0
–2.0
TEC Current (A)
–3.0 –2.0 –1.0 0 1.0 2.0 3.0
V
IN
(V)
1Ω TEC
2Ω TEC
1.5Ω TEC
V
OPA
= +5V
V
S
= +3.3V

10
SBEA001
R
4
0.02Ω
R
5
15Ω
C
3
4.7nF
C
1
10nF
TEC
R
1
10kΩ
OPA353
OPA353
R
3
10kΩ
R
6
15Ω
C
2
10nF
R
2
10kΩ
+
–
V
OS
V
OPA
V
S
V
OS
V
OPA
V
S
V
OPA
V
OS
3
7V+
8
1
2
6
4
3
2
7
6
4
V–
U
3
IN+
IN–
REF
INA155
Q
2
FTZ869
Q
4
FTZ968
V+
C
4
470pF
Q
3
FTZ958
Q
1
FTZ869
6
7
2
3
4
V–
V+
U
1
U
2
V
IN
V
OS
2.5V
+
––
V
S
5V
V
S
+
V
OPA
5V
V
OPA
5kΩ
5kΩ
22.2kΩ
22.2kΩ
200kΩ
200kΩ
NOTES: (1) Optional: Use one dual op amp OPA2353
(2) Bypass capacitors on Q
1
, Q
2
, and U
3
are not shown.
FIGURE 21. TEC Driver–2 Circuit Diagram.

SBEA001
11
3.0
2.5
2.0
1.5
1.0
0.5
0
P
D
(W)
–3.0 –2.0 –1.0 0 1.0 2.0 3.0
V
IN
(V)
1Ω TEC
Q
4
2Ω TEC
Q
4
1.5Ω TEC
Q
4
V
OPA
= +5V
V
S
= +3.3V
Q
2
FIGURE 22. Output Transistor Q
2
and Q
4
Power Dissipation.
3.5
3.0
2.5
2.0
1.5
1.0
0.5
–3.0 –2.0 –1.0 0 1.0 2.0 3.0
V
IN
(V)
1Ω TEC
1.5Ω TEC
V
OPA
= +5V
V
S
= +3.3V
2Ω TEC
V
OUT
(V)
Q
1
and Q
3
Q
2
and Q
4
FIGURE 23. TEC Driver–2 Amplifier Output Voltage Swing.
Linear amplifiers do not reach the efficiencies of PWM
switching types, but they do offer important advantages,
principally their very low noise. Switching noise interfer-
ence in laser and APD circuits is not a concern with linear
drivers.
Driver amplifier loop stability was investigated by running
an AC and Transient simulation. Results of the AC simula-
tion are shown in Figure 24.
Some peaking is shown in the frequency response of the 1Ω
and 1.5Ω TEC but increasing the capacitance of the compen-
sation capacitors C
3
and C
4
can eliminate this. Notice that
the capacitance of C
3
and C
4
are not the same. Amplifier U
1
requires more capacitance than U
2
because of the presence
of feedback gain provided by the instrumentation amplifier,
U
3
.
Similar results are seen in Figure 25, a P–Spice transient
simulation of this TEC driver amplifier. Slight peaking is
noted for heavy loads as predicted by the frequency response
curves.
2.0
1.5
1.0
0.5
0
TEC Current (A)
100 1k 10k 100k 1M 10M 100M
Frequency (mHz)
1Ω TEC
1Ω TEC
1Ω TEC
FIGURE 24. TEC Driver–2 Amplifier Frequency Response.
V
OPA
= +5V
V
S
= +3.3V
1Ω TEC
1.5Ω TEC
2Ω TEC
2.0
1.0
0
–1.0
–2.0
I
OUT
(A)
0246810
Time (ms)
FIGURE 25. TEC Driver–2 Amplifier Transient Response.
Also evident in the transient response waveform is a small
crossover distortion “glitch” around 0A output current due
to the delay between turning off one transistor before its
complimentary transistor turns on. For example, the op amp
driving the power transistors must slew quickly between the
voltage at which the NPN transistor turns off and the PNP
transistor turns on. Due to the fact that this amplifier uses a
Class B output stage, this region is 2V
BE
. A
fast op amp such
as the OPA353 minimizes the crossover distortion and
enhances stability about the crossover region. For applica-
tions such as an audio amplifier, the output stage transistors
could be biased slightly into conduction (class AB1) which
would eliminate the crossover region altogether. Applica-
tions for driving loads such as a thermoelectric cooler do not
warrant the increased complexity of a Class AB1 output
stage.
Due to the asymmetry of output stage of this driver, it may
not be the best choice for a TEC driver amplifier. For better
efficiency, see the last section of “Linear TEC Driver–3.”

12
SBEA001
LINEAR TEC DRIVER–3
The linear TEC driver circuit (see Figure 28) is capable of
driving over ±2A into a typical TEC. The circuit operates on
a bipolar ±2.5V supply and drives the TE cooler in the highly
desirable “constant-current” mode. A BTL amplifier topology
achieves bidirectional current output. This type of amplifier
drives its load differentially, so the TEC must not be grounded
on either end.
With bipolar supplies, an input offset voltage is not necessary
to allow the amplifier outputs to swing in both directions. A
level shift circuit will be necessary to interface with a single-
supply input voltage source that is biased to 1/2V
CC
.
In the schematic, voltage V
IN
is amplified by a R-R CMOS op
amp U
1
with a class B power output stage (formed by the
addition of a complimentary power transistor pair Q
1
and Q
3
)
that drives one end of a TEC load through shunt resistor R
4
. A
CMOS instrumentation amplifier (IA) U
3
senses the voltage
drop across the shunt resistor and amplifies it by 50, it then feeds
it back to the input of U
1
. This feedback approach forces the
output (TEC) current to be a function of V
IN
. Shunt resistance
and IA gain determines the scale factor of the circuit.
V
I
A•R
IN
OUT
V4
=
, where A
V
is the IA gain in V/V.
A P–Spice simulation (DC sweep) was performed on V
IN
,
sweeping the input voltage from –2.5V to +2.5V. The ampli-
fier output current to the TEC is shown in Figure 26. This is
a P–Spice Probe file output.
Current limiting in a voltage-controlled current source be-
comes a simple matter of clamping the maximum input volt-
age to the amplifier. If driven by a rail-to-rail op amp, a voltage
divider or pot will set the current limit. When the R-R op amp
hits its rail, that voltage is divided down to an appropriate
voltage that represents the maximum desired TEC current. The
R-R op amp can’t swing past its rail, so this clamps the input
voltage to the TEC driver amplifier.
To determine the circuit’s power dissipation and the require-
ments for heat sinking the SOT-223 output power transistors,
a simulation was run by sweeping the DC input voltage as
before using the same sizes of TECs. The results are shown in
Figure 27.
5.0
2.5
0.0
–2.5
–5.0
TEC Current (A)
–3.0 –2.0 –1.0 0 1.0 2.0 3.0
V
IN
(V)
1Ω TEC
2Ω TEC
1.5Ω TEC
V
OPA
= ±2.5V
V
S
= ±2.5V
TEC current is shown for three different TEC sizes; 1Ω, 1.5Ω,
and a 2Ω TEC. Operating on a bipolar ±2.5V supply, this
driver is capable of driving a 1Ω or 1.5Ω TEC to 2A. Output
voltage compliance limits the 2Ω TEC current to about 1.6A.
This output capability is the same as TEC Driver–1, essentially
the same circuit operating on a single +5V supply.
As Figure 26 illustrates, this TEC driver amplifier is a voltage-
controlled current source. Constant-current drive assures that
TEC drive current is independent of production variations in
TEC junctions or long-term aging. Constant-current drive also
eliminates the effect of thermal “back EMF” on current through
the TEC under dynamic temperature control conditions.
FIGURE 26. TEC Current Versus Input Voltage V
IN
.
4.0
3.0
2.0
1.0
0
P
D
(W)
–3.0 –2.0 –1.0 0 1.0 2.0 3.0
V
IN
(V)
1Ω TEC
1Ω TEC
2Ω TEC
2Ω TEC
1.5Ω TEC
1.5Ω TEC
V
OPA
= ±2.5V
V
S
= ±2.5V
FIGURE 27. Output Transistor Power Dissipation.
Power dissipation of one NPN (Q
1
) and one PNP (Q
3
) power
output transistor is shown in this sweep. The dissipation of the
devices in the other half of the bridge (NPN = Q
2
and PNP = Q
4
)
will be the same as those shown in Figure 28. Depending on
whether the TEC is in its cooling or heating mode, power is
dissipated in Q
1
and Q
4
or in Q
2
and Q
3
.
Driver efficiency is usually a concern in large multi-channel
systems due to limitations on the total power dissipation of the
system. Linear amplifiers do not reach the efficiencies of
PWM switching types but they do offer important advantages,
principally their very low noise. Switching noise interference
in laser and APD circuits is not a concern with linear drivers.
The DC simulation data was used to plot the efficiency of the
driver. To simplify the calculation, only the power output stage
was considered. The CMOS OPA353 op amp power dissipa-
tion is only about 26mW, so deleting it contributes little error
to the overall efficiency calculation. In this calculation, effi-
ciency is considered to be the ratio of the power delivered to
the load TEC to the power supplied to the driver. For example,
a current of 1A into a 1Ω TEC represents a power P
OUT
of 1W
dissipated in the load (P
OUT
= I
2
R). The power supplied to the
driver P
IN
is 1A from each ±2.5V supply, or 5W
(P
IN
= E • I).
Therefore:
Eff(%)
P
P
•100, or Eff(%)
I•R
V•I
•100
1A •1
5V•1A
OUT
IN
2
SS
2
===
Ω
=•%100 20

SBEA001
13
R
4
0.02Ω
R
5
15Ω
C
3
4.7nF
C
1
10nF
TEC
R
1
10kΩ
OPA353
OPA353
R
3
10kΩ
R
6
15Ω
C
2
10nF
R
2
10kΩ
-V
OPA
V
S
+V
OPA
+V
S
+V
OPA
3
7V+
8
1
2
6
4
3
2
7
6
4
V–
U
3
IN+
IN–
REF
INA155
Q
2
FTZ869
Q
4
FTZ968
V+
V-
C
4
470pF
Q
3
FTZ968
Q
1
FTZ869
6
7
2
3
4
V-
V+
U
1
U
2
V
IN
+
+V
S
+2.5V
+V
S
+
+V
OPA
+2.5V
+V
OPA
+
–– ––
-V
S
-2.5V
–V
S
+
-V
OPA
-2.5V
–V
OPA
-V
S
+V
OPA
5kΩ
5kΩ
22.2kΩ
22.2kΩ
200kΩ
200kΩ
C
5
10nF
–V
OPA
C
6
10nF
–V
OPA
-V
S
NOTES: (1) Optional: Use one dual op amp OPA2353
(2) Bypass cpacitors on Q
1
, Q
4
, and U
3
are not shown.
FIGURE 28. TEC Driver–3 Circuit Diagram.

14
SBEA001
Swinging the output voltage close to the supply rails mini-
mizes the voltage across the output transistor, thus reducing
its power dissipation. Likewise, it maximizes the voltage
across the load. As can be seen from the previous equation,
this increases the efficiency of a linear driver. In fact, as seen
in Figure 29, this circuit can reach an efficiency of over 60%
under favorable conditions. The dissipation of TEC Driver–3
on ±2.5V is exactly the same as TEC Driver–1 on +5V.
100
80
60
40
20
0
–3.0 –2.0 –1.0 0 1.0 2.0 3.0
1.5Ω TEC
1Ω TEC
V
OPA
= +5V
V
S
= +5V
2Ω TEC
Efficiency (%)
FIGURE 29. Driver–1 (+5V supply) and Driver–3 (±2.5V sup-
plies) efficiency with 1Ω, 1.5Ω and 2Ω TEC loads.
Driver amplifier loop stability was investigated by running an
AC and Transient simulation. Results of the AC simulation
are shown in Figure 30.
FIGURE 30. TEC Driver Amplifier Frequency Response.
Some peaking is shown in the frequency response curves of
the 1Ω and 1.5Ω TEC but increasing the capacitance of the
compensation capacitors C
3
and C
4
can eliminate this. No-
tice that the capacitance of C
3
and C
4
are not the same.
Amplifier U
1
requires more capacitance than U
2
because of
the presence of feedback gain, that is provided by the
instrumentation amplifier, U
3
.
FIGURE 31. TEC Driver Amplifier Transient Response.
Similar results are seen in Figure 31, a P–Spice transient
simulation of this TEC driver amplifier. Slight peaking is
noted for heavy loads as predicted by the frequency response
curves.
Also evident in the transient response waveform is a small
crossover distortion “glitch” around 0A output current due
to the delay between turning off one transistor before its
complimentary transistor turns on. For example, the op amp
driving the power transistors must slew quickly between the
voltage at which the NPN transistor turns off and the PNP
transistor turns on. Due to the fact that this amplifier uses a
Class B output stage, this region is 2V
BE
. A
fast op amp,
such as the OPA353, minimizes the crossover distortion and
enhances stability about the crossover region. For applica-
tions such as an audio amplifier, the output stage transistors
could be biased slightly into conduction (class AB1) which
would eliminate the crossover region altogether. Applica-
tions for driving loads such as a thermoelectric cooler do not
warrant the increased complexity of a Class AB1 output
stage.
Reducing the power output transistor supplies from ±2.5V to
±1.5V increases the overall efficiency of the driver amplifier
by reducing the power dissipation in the output transistors.
As expected, lower transistor V
CE
results in lower power
dissipation at the same collector current. Running the output
stage on as low voltage as possible increases efficiency—
especially if the amplifier output voltage can swing close to
the rail.
Although the low-level circuits are operating on different
supply voltages (±2.5V) than the output stage (±1.5V), this
does not cause the same asymmetry problems as discussed
in “TEC Driver–2.” This is because the inputs are ground-
referenced as are all of the supplies; both the op amp and the
output stage can swing symmetrically both positive and
negative.
See Figure 32 for output current into three sizes of TECs.
2.0
1.5
1.0
0.5
0
100 1k 10k 100k 1M 10M 100M
Frequency (MHz)
1Ω TEC
1.5Ω TEC
2Ω TEC
V
OPA
= ±2.5V
V
S
= ±2.5V
TEC Current (A)
V
OPA
= +5V
V
S
= +3.3V
1Ω TEC
1.5Ω TEC
2Ω TEC
2.0
1.0
0
–1.0
–2.0
I
OUT
(A)
0246810
Time (ms)

SBEA001
15
FIGURE 32. TEC Driver Output Current with ±1.5V Output
Stage Supplies.
Operation on low voltage supplies does sacrifice output
voltage compliance somewhat. This reduces the maximum
drive current into a 2Ω or 1.5Ω TEC but lower resistance 1Ω
TECs are unaffected.
Worthwhile gains in power dissipation are also realized by
operating the output stage on ±1.5V supplies, as shown in
Figure 33.
FIGURE 33.Output Transistor Power Dissipation with ±1.5V
Supplies.
Smaller transistor heat sinks are required and reductions in
cooling capacity are possible in large systems.
Figure 34 shows the very high efficiency that can be achieved
by a linear TEC driver when it swings very close to its
supply rails. Driving a 2Ω TEC to its maximum current of
about 1.3A, this amplifier achieves an efficiency of about
90%. Driving a 1Ω TEC to its maximum current of about
1.3A, this amplifier achieves an efficiency of about 80%.
Lower output currents achieve lower efficiencies but, at the
same time, power dissipation is also lower.
FIGURE 34. Improved Amplifier Efficiency with Output Stage
Operating on ±1.5V Supplies.
The key to achieving good efficiency with a linear driver is
to match the TEC driver amplifier characteristics with ap-
propriate power supplies for your TEC. Thermoelectric
coolers are available with a wide range of voltage and
current characteristics; it is important to choose a TEC that
requires a drive voltage that is very close to the voltage(s)
available from your existing power supply. In new designs,
it may be possible to chose a TEC and then specify a power
supply voltage that optimizes the performance of the TEC
and driver amplifier.
Satisfactory operation of these circuits should be verified in
your actual application by breadboarding and testing.
4.0
2.0
0
–2.0
–4.0
TEC Current (A)
–3.0 –2.0 –1.0 0 1.0 2.0 3.0
V
IN
(V)
1Ω TEC
2Ω TEC
1.5Ω TEC
V
OPA
= ±2.5V
V
S
= ±1.5V
1.5
1.0
0.5
0
P
D
(W)
–3.0 –2.0 –1.0 0 1.0 2.0 3.0
V
IN
(V)
1Ω TEC
V
OPA
= ±2.5V
V
S
= ±1.5V
2Ω TEC
1.5Ω TEC
100
80
60
40
20
0
–3.0 –2.0 –1.0 0 1.0 2.0 3.0
1.5Ω TEC
1Ω TEC
V
OPA
= ±2.5V
V
S
= ±2.5V
2Ω TEC
Efficiency (%)

16
SBEA001
TEMPERATURE UNDER–AND
OVER–RANGE SENSING WITH
A WINDOW COMPARATOR
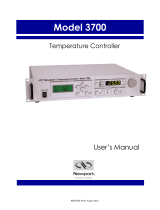
The window comparator circuit shown in Figure 35 has been
used to monitor a TEC operating temperature and indicate
an out-of-range condition. Separate outputs are provided for
indicating an over-temperature or under-temperature condi-
tion. A logic HI at the output of U
1
or U
2
indicates that the
thermistor temperature is outside of the set points of the
window comparator.
A logic LOW at both outputs indicates that the TEC tem-
perature is within its safe operating range. A dual compara-
tor with open-collector or drain outputs can be used in a
“wired-OR” configuration but the single OPA340 or dual
OPA2340 CMOS op amp offers higher accuracy.
In the schematic, voltage V
IN
is used to simulate the voltage
appearing across a thermistor that measures the laser/TEC
temperature. If a 10kΩ at 25°C thermistor is excited by
100µA from a REF200 Current Reference, it will read
1.000V across the thermistor at 25°C. By using this con-
stant-current source, the thermistor’s output voltage is a
direct function of its temperature and this is easily converted
to °C by using the thermistor’s calibration chart.
A P–Spice simulation (DC sweep) was performed on V
IN
,
sweeping the thermistor voltage from 0V to 2V. The lower
temp limit was set to 500mV with R
LOW
, a 5kΩ resistor. A
10kΩ resistor, R
DELTA
, set the difference between the low
and high thresholds to 1V; therefore, the high threshold was
500mV + 1.000V = 1.500V.
The P–Spice Probe output is shown in Figure 36. As the
thermistor voltage crosses each threshold, U
1
and U
2
indi-
cate their status with a TTL HIGH or LOW output.
OPA340
OPA340
U
3
REF200
100µA
Thermistor
Output
V
IN
1V
R
DELTA
10kΩ
R
LOW
5kΩ
2
3
4
6
7
V+
V–
U
2
2
3
4
6
7
V+
V–
U
1
+5V
R
H
20kΩ
R
L
20kΩ
HI = Temp Error:
Temp Too High
HI = Temp Error:
Temp Too Low
+
–
+
–
V
S
5V
+5V
+5V
+5V
NOTES: (1) Optional: Use one dual op amp OPA2340
(2) Bypass capacitors on U
1
through U
3
are not shown.
FIGURE 35. Precision Window Comparator Circuit Diagram.
Temp Too
High
Temp Too
Low
Temp O.K.
Temp O.K.
U
2
Output
U
1
Output
U
1
and U
2
Inputs
HI Threshold
LO Threshold
Delta
Thermistor Voltage
2.0
0
6.0
–1.0
6.0
–1.0
0 0.5 1.0 1.5 2.0
V
IN
(V)
U
1 OUT
(V)V
IN
(V) U
2 OUT
(V)
FIGURE 36. Input Voltage, HIGH and LOW Thresholds, and
Ouput Voltages.
To prevent loading of the thermistor, a low bias current
precision CMOS op amp was used as a comparator. Operat-
ing on a single +5V supply, the R/R op amp outputs are
TTL/CMOS compatible. A dual OPA2340 is ideal for low–
speed window comparator applications.

SBEA001
17
One caution–the REF200 Current Reference requires about
2.5V of headroom to operate properly. This means that the
upper threshold should not exceed 2.5V if this circuit is
operated on the recommended +5V supply.
By setting the thresholds appropriately, a thermistor can also
be monitored for an open or shorted condition.
This circuit can also perform a continuous check of whether
the temp control system is operating within specification.
Setting the window low temperature trip point to the lower
desired operating temperature limit with R
LOW
and its upper
temperature trip point to the upper desired operating tem-
perature limit by R
DELTA
will allow this circuit to indicate
when the TEC is within the desired control range. A digital
HIGH appears at the output of U
1
or U
2
if the temperature
exceeds either the upper or lower preset error bounds.
Additional sensitivity can be obtained by sensing an instru-
mentation amplifier (IA) output (this is usually the amplified
error signal that is used by the control loop) instead of
connecting the window comparator directly to the ther-
mistor. Since the IA usually has gain, a larger signal is
available to drive the comparator. In this case, the compara-
tor is monitoring the amplified difference between the ther-
mistor voltage and the temp set voltage rather than the
thermistor directly. This can monitor the temperature control
loop error and a second window comparator can monitor the
thermistor temperature as described above.
Ordinarily, accurately setting both thresholds of a window
comparator is a tedious process. Voltage excitation of the
commonly-used three-resistor divider guarantees interaction
between thresholds. To adjust thresholds, first one pot is
adjusted—then the other. The second adjustment changes
the first threshold point, etc. Threshold trimming is an
iterative process for the standard window comparator cir-
cuit.
By using current excitation, only two fixed resistors or pots
are needed. R
LOW
sets the lower threshold and R
DELTA
sets
the “width” of the “window”. Adjusting the R
DELTA
does
not change the lower threshold and adjusting the lower
threshold does not change the voltage difference between
thresholds. Thus the adjustment procedure is greatly simpli-
fied.
Noisy environments may require a small amount of hyster-
esis (positive feedback) to prevent “chatter” on the outputs
at the comparator switching points.
Satisfactory operation of this circuit should be verified in
your actual application by breadboarding and testing.

IMPORTANT NOTICE
Texas Instruments Incorporated and its subsidiaries (TI) reserve the right to make corrections, modifications,
enhancements, improvements, and other changes to its products and services at any time and to discontinue
any product or service without notice. Customers should obtain the latest relevant information before placing
orders and should verify that such information is current and complete. All products are sold subject to TI’s terms
and conditions of sale supplied at the time of order acknowledgment.
TI warrants performance of its hardware products to the specifications applicable at the time of sale in
accordance with TI’s standard warranty. Testing and other quality control techniques are used to the extent TI
deems necessary to support this warranty. Except where mandated by government requirements, testing of all
parameters of each product is not necessarily performed.
TI assumes no liability for applications assistance or customer product design. Customers are responsible for
their products and applications using TI components. To minimize the risks associated with customer products
and applications, customers should provide adequate design and operating safeguards.
TI does not warrant or represent that any license, either express or implied, is granted under any TI patent right,
copyright, mask work right, or other TI intellectual property right relating to any combination, machine, or process
in which TI products or services are used. Information published by TI regarding third–party products or services
does not constitute a license from TI to use such products or services or a warranty or endorsement thereof.
Use of such information may require a license from a third party under the patents or other intellectual property
of the third party, or a license from TI under the patents or other intellectual property of TI.
Reproduction of information in TI data books or data sheets is permissible only if reproduction is without
alteration and is accompanied by all associated warranties, conditions, limitations, and notices. Reproduction
of this information with alteration is an unfair and deceptive business practice. TI is not responsible or liable for
such altered documentation.
Resale of TI products or services with statements different from or beyond the parameters stated by TI for that
product or service voids all express and any implied warranties for the associated TI product or service and
is an unfair and deceptive business practice. TI is not responsible or liable for any such statements.
Mailing Address:
Texas Instruments
Post Office Box 655303
Dallas, Texas 75265
Copyright 2001, Texas Instruments Incorporated
/