TGA100 TRACE GAS ANALYZER
USER AND REFERENCE MANUAL
LAST REVISION: 2 August 2004
COPYRIGHT © 1992 - 2004, CAMPBELL SCIENTIFIC, INC.

2

TABLE OF CONTENTS
1 OVERVIEW 12
1.1 System Components 12
1.2 Theory of Operation 13
1.2.1 Optical System 13
1.2.2 Laser Scan Sequence 14
1.2.3 Concentration Calculation 15
1.3 Trace Gas Species Selection 15
1.4 Dual Ramp Mode 15
1.5 User Interface 16
1.6 Micrometeorological Applications 17
1.6.1 Eddy Covariance 17
1.6.2 Flux Gradient 18
1.6.3 Site Means 19
1.6.4 Absolute Concentration / Isotope Ratio Measurements 20
1.7 Specifications 21
1.7.1 Measurement Specifications 21
1.7.2 Physical Specifications 22
2 INSTALLATION 23
2.1 Analyzer Installation 23
2.2 TGA100 PC Installation 24
2.3 Routine Operation 25
2.3.1 Startup Procedure 25
2.3.2 Shutdown Procedure 25
2.3.3 System Checks 26
3 TGA SOFTWARE 27
3.1 General 27
3.2 Startup 27
3.3 Main Menu 27
3

4

3.4 Real Time Screen 28
3.4.1 Screen Layout 29
3.4.2 Navigating and Editing 30
3.4.3 Run Mode 30
3.4.4 Dynamic Parameters 31
3.4.5 Detector Video 32
3.4.6 Functions 32
3.4.7 Graph Selections 32
3.4.8 Graph Display Limits 33
3.4.9 Quick Keys 33
3.5 Parameter Change Menu 35
3.5.1 Standard Parameter Screens 36
3.5.2 File Output Selection Screen 37
3.5.3 Analog Output Screen 38
3.5.4 Gradient and Site Means Screens 39
3.6 TGA Files 39
3.6.1 Parameter Files 39
3.6.2 10 Hz Concentration Data Files 40
3.6.3 Gradient (Delta Concentration) Files 40
3.6.4 Site Means Files 41
3.6.5 Housekeeping Data File 42
3.6.6 Header Files 43
3.6.7 User Messages 43
4 DETAILED SETUP INSTRUCTIONS 44
4.1 Configuring the System for a Specific Gas Species 44
4.1.1 Laser Selection 44
4.1.2 Reference Gas 44
4.1.3 Detectors 45
4.1.4 Air Gap Purge 46
4.1.5 Polyethylene Sample Cell Liner 46
4.2 Optical Alignment 47
4.2.1 Setting Parameters to Align a New Laser 49
4.2.2 Initial Alignment 49
4.2.3 Horizontal and Vertical Alignment 50
4.2.4 Focus Adjustment 51
4.2.5 Reference Detector Coalignment 51
5

6

4.3 Finding the Absorption Line 52
4.4 Laser Mapping 53
4.5 Optimizing Laser Parameters 55
4.5.1 Laser Temperature 55
4.5.2 Zero Current 58
4.5.3 High Current 59
4.5.4 Omitted Data Count 62
4.5.5 Laser Modulation Current 63
4.5.6 Laser Maximum Temperature and Laser Maximum Current 63
4.5.7 Laser Multimode Correction 63
4.6 Optimizing Detector Parameters 64
4.6.1 Detector Gain and Offset 64
4.6.2 Detector Temperature 65
4.6.3 Detector Linearity Coefficients 65
4.7 Calibration 66
5 SAMPLING SYSTEM CONTROL 67
5.1 GRADIENT MEASUREMENTS 67
5.1.1 Gradient Overview 67
5.1.2 Gradient Calculations 68
5.1.3 Real time display 70
5.1.4 Controlling Gradient Valve Assemblies 70
5.1.5 Controlling a Gradient Site Selection Assembly 72
5.1.6 Gradient Mode Parameters 74
5.1.7 Gradient Mode Setup 75
5.2 SITE MEANS MEASUREMENTS 80
5.2.1 Site Means Overview 80
5.2.2 Site Means Calculations 81
5.2.3 Real Time Display 83
5.2.4 Controlling a Site Means Sampling System 83
5.2.5 Site Means Parameters 84
5.3 MASTER/SLAVE OPERATION 85
5.3.1 Master/Slave Setup 85
5.3.2 Master/Slave Operation 86
5.3.3 Shift and Omit Samples 86
7

8

6 EDDY COVARIANCE MEASUREMENTS 86
6.1 Overview 86
6.2 Flow Rate and Tubing Size 88
7 AUXILIARY INPUTS AND OUTPUTS 90
7.1 Reading Data from a CSAT3 Sonic Anemometer 90
7.2 Reading Data from a CR9000 90
7.3 Sending Concentration Data to a CR9000 91
7.4 TGA Analog Inputs 91
7.5 PC Analog Inputs 92
7.6 Analog Outputs 92
7.7 Digital Outputs 93
7.8 Excitation Source 93
8 TGA100 OPTIONS 94
8.1 Laser Cooling 94
8.1.1 LN2DEWAR TGA100 LN2 Laser Dewar 94
8.1.2 CRYODEWAR TGA100 Laser Cryocooler System 94
8.2 Lasers 95
8.3 TGAHEAT Temperature Controller 95
9 TGA100 ACCESSORIES 96
9.1 TGA100 Insulated Enclosure Cover 96
9.2 Dewar Evacuation System 96
9.3 Sample Vacuum Pump 96
9.4 Sample Air Dryers 97
9.4.1 General Description 97
9.4.2 Theory of Operation 98
9.4.3 Installation Instructions 98
9

10


1 OVERVIEW
The TGA100 Trace Gas Analyzer measures trace gas concentration in an air sample using tunable diode laser
absorption spectroscopy (TDLAS). This technique provides high sensitivity, speed, and selectivity. The TGA100 is a
rugged, portable instrument designed for use in the field. It can measure one of a large number of gases by choosing
appropriate lasers and detectors. It incorporates several features that make it ideal for measuring fluxes of trace gases
using gradient or eddy covariance techniques. A vacuum pump continuously pulls the air sample through the analyzer,
which measures the concentration of the trace gas at a 10 Hz rate. The TGA computer provides the user interface;
controlling the analyzer, and calculating, displaying, and storing data in real time.
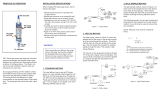
1.1 System Components
Figure 1-1
Figure 1-1. TGA100 System Components
illustrates the main system components as well as additional equipment needed to operate the TGA100.
These system components include:
• TGA100 Analyzer: The analyzer optics and electronics, mounted in an insulated fiberglass enclosure.
• TGA100 PC: A desktop computer, supplied as part of the TGA100.
• Fiber optic cable (7737-L): Connects the TGA100 analyzer to the TGA100 PC.
• Sample Intake (15838 shown): Filters the air sample and controls its flow rate.
• Sample pump (RB0021-L shown): Pulls the air sample and reference gas through the analyzer at low pressure.
• Suction hose (7123): Connects the analyzer to the sample pump. Supplied with RB0021 sample pump.
• Reference gas: tank of reference gas, with pressure regulator (supplied by user).
• Reference gas connection (15837): Flow meter, needle valve, and tubing to connect the reference gas to the
analyzer.
TGA100 Analyzer
Reference Gas
Sample Pump
TGA100 PC
Sample Intake
Fiber Optic
Cable
Reference Gas Connection
Suction Hose
12

1.2 Theory of Operation
1.2.1 Optical System
The TGA100 optical system is shown schematically in . The optical source is a lead-salt tunable diode laser
that operates between 80 and 140 K, depending on the individual laser. Two options are available to mount and cool the
laser: the TGA100 LN2 Laser Dewar and the TGA100 Laser Cryocooler System. Both options include a laser mount
that can accommodate one or two lasers. The LN2 Laser Dewar mounts inside the analyzer enclosure. It holds 10.4
liters of liquid nitrogen, and must be refilled twice per week. The Laser Cryocooler System uses a closed-cycle
refrigeration system to cool the laser without liquid nitrogen. It includes a vacuum housing mounted inside the analyzer
enclosure, an AC-powered compressor mounted outside the enclosure, and 3.1 m (10 ft) flexible gas transfer lines.
Figure 1-2
Figure 1-2. Schematic Diagram of TGA100 Optical System
Reference
detector
The laser is simultaneously temperature and current controlled to produce a linear wavelength scan centered on a
selected absorption line of the trace gas. The IR radiation from the laser is collimated and passed through a 1.5 m
sample cell, where it is absorbed proportional to the concentration of the target gas. A beam splitter directs most of the
energy through a focusing lens to the sample detector, and reflects a portion of the beam through a second focusing lens
and a short reference cell to the reference detector. A prepared reference gas having a known concentration of the target
gas flows through the reference cell. The reference signal provides a template for the spectral shape of the absorption
line, allowing the concentration to be derived independent of the temperature or pressure of the sample gas or the
spectral positions of the scan samples. The reference signal also provides feedback for a digital control algorithm to
maintain the center of the spectral scan at the center of the absorption line. The simple optical design avoids the
alignment problems associated with multiple-path absorption cells. The number of reflective surfaces is minimized to
reduce errors caused by Fabry-Perot interference.
13

1.2.2 Laser Scan Sequence
The laser is operated using a scan sequence that includes three phases: the zero current phase, the high current phase,
and the modulation phase, as illustrated in Figure 1-3. The modulation phase performs the actual spectral scan. During
this phase the laser current is increased linearly over a small range (typically +/- 0.5 to 1 mA). The laser’s emission
wavenumber depends on its current. Therefore the laser’s emission is scanned over a small range of frequencies
(typically +/- 0.03 to 0.06 cm
-1
).
During the zero current phase, the laser current is set to a value below the laser’s emission threshold. “Zero” signifies
the laser emits no optical power; it does not mean the current is zero. The zero current phase is used to measure the
detector’s dark response, i.e., the response with no laser signal.
The reduced current during the zero phase dissipates less heat in the laser, causing it to cool slightly. The laser’s
emission frequency depends on its temperature as well as its current. Therefore the temperature perturbation caused by
reduced current during the zero phase introduces a perturbation in the laser’s emission frequency. During the high
current phase the laser current is increased above its value during the modulation phase to replace the heat “lost” during
the zero phase. This stabilizes the laser temperature quickly, minimizing the effect of the temperature perturbation. The
entire scan sequence is repeated every 2 ms. Fifty consecutive scans are averaged and processed to give a concentration
measurement every 100 ms (10 Hz sample rate).
Laser
Current
Zero Current Phase
(Laser Off)
Omitted
Used in Calculation
2 ms
High Current Phase
(Temperature
Stabilization)
Modulation Phase
(Spectral Scan)
Detector
Response
Figure 1-3. TGA100 Laser Scan Sequence
14

1.2.3 Concentration Calculation
The reference and sample detector signals are digitized and averaged over 50 consecutive scans. The average reference
and sample scans are then corrected for detector offset and nonlinearity, and converted to absorbance. A linear
regression of sample absorbance vs. reference absorbance gives the ratio of sample absorbance to reference absorbance.
The assumption that temperature and pressure are the same for the sample and reference gases is fundamental to the
design of the TGA100. It allows the concentration of the sample, C
S
, to be calculated by:
)1(
))()((
DLL
DLC
C
AS
RR
s
−+
=
Where C
R
= concentration of reference gas, ppm
L
R
= length of the short reference cell, cm
L
S
= length of the short sample cell, cm
L
A
= length of the long sample cell, cm
D = ratio of sample to reference absorbance
1.3 Trace Gas Species Selection
The TGA100 can measure gases with absorption lines in the 3 to 10 micron range, by selecting appropriate lasers,
detectors, and reference gas. Lead-salt tunable diode lasers have a limited tuning range, typically 1 to 3 cm
-1
within a
continuous tuning mode. In some cases more than one gas can be measured with the same laser, but usually each gas
requires its own laser. The laser dewar has two laser positions available (four with an optional second laser mount),
allowing selection of up to four different species by rotating the dewar, installing the corresponding cable, and
performing a simple optical realignment.
The standard detectors used in the TGA100 are Peltier cooled, and operate at wavelengths up to 5 microns. These
detectors are used for most gases of interest, including nitrous oxide (N
2
O), methane (CH
4)
, and carbon dioxide (CO
2
).
Some gases, such as ammonia (NH
3
), have the strongest absorption lines at longer wavelengths, and require the
optional long wavelength, liquid nitrogen-cooled detectors. These detectors operate to wavelengths beyond 10 microns.
They require filling with liquid nitrogen once each day.
A prepared reference gas having a known concentration of the target gas must flow through the reference cell. The
beam splitter directs a small fraction of the laser power through the reference cell to the reference detector. This gives a
reference signal proportional to the laser power, with the spectral absorption signature of the reference gas. The
reference signal provides a template for the spectral shape of the absorption feature, allowing the concentration to be
derived without measuring the temperature or pressure of the sample gas, or the spectral positions of the scan samples.
1.4 Dual Ramp Mode
The TGA100 can be configured to measure two gases simultaneously by alternating the spectral scan wavelength
between two nearby lines. This technique requires that the two absorption lines be very close together (within about 1
cm
-1
), so it can be used only in very specific cases. The dual ramp mode is used to measure isotope ratios in carbon
dioxide or water by tuning each ramp to a different isotopomer.
The dual ramp mode may also be used to measure some other pairs of gases, such as carbon monoxide and nitrous
oxide, or nitrous oxide and methane, but the measurement noise will be higher than if a single gas is measured. For
measurements of a single gas, the laser wavelength is chosen for the strongest absorption lines of that gas. Choosing a
laser that can measure two gases simultaneously involves a compromise. Weaker absorption lines must be used in order
to find a line for each gas within the laser’s narrow tuning range.
15

1.5 User Interface
The TGA100 includes a computer that provides the user interface. It displays the data in real time, allows the user to
modify control parameters, and saves data to the hard disk. The real time graphics screen is presented in . In
the upper left corner is a box which displays the TGA software version, the laser and detector temperatures, and the
time. Beneath the time and temperature display is a blank area used for information and error message display. The rest
of the top of the screen has five menu columns: run mode, dynamic parameters, detector video, special function
enable/disable, and graph selections.
Figure 1-4
Figure 1-4. Real Time Graphics Screen
In the middle of the screen are graph 1 and graph 2, used to display certain user-selectable variables. This example
shows N
2
O concentration in graph 2 and laser temperature in graph 2.
Graph 3 is located at the bottom-center of the screen, and is also used to display user-selected variables. In this example
graph 3 shows the sample cell pressure.
At the bottom left corner of the screen are two high speed graphic windows that show the raw reference (REF) detector
signal and the raw sample (SMP) detector signal, scaled to match the analog-to-digital converter (ADC) input range.
At the bottom right corner of the screen are two more high speed graphic windows that display processed reference and
sample signals. The user may select the type of data to display in these windows using the Detector Video menu or the
Quick Keys. The number displayed at the top of these windows is either the transmittance or the absorbance of the
center of the spectral scan, depending on the display mode selected. All four of the high-speed graphic windows have
three vertical dashed lines. These lines show the center of the spectral scan and the range of data actually used to
calculate concentration.
16

1.6 Micrometeorological Applications
The TGA100 is ideally suited to measure fluxes of trace gases using micrometeorological techniques. In addition to its
rugged design that allows it to operate reliably in the field with minimal protection from the environment, it also
incorporates several hardware and software features to facilitate these measurements.
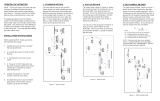
1.6.1 Eddy Covariance
The TGA100's sample rate, frequency response, sensitivity and selectivity are optimized for measuring trace gas fluxes
using the eddy covariance (EC) method. It is designed to collect three-dimensional wind data from a CSAT3 sonic
anemometer while synchronously measuring trace gas concentration. Figure 1-5 illustrates a typical EC application.
The sonic anemometer and air sample intake are mounted on the measurement mast. Tubing connects the air sample
intake to the inlet of a PD1000 sample air dryer, which filters and dries the air sample. A needle valve at the outlet of
the PD1000 sets the sample flow rate, typically to approximately 15 slpm. The TGA100 analyzer is located near the
base of the measurement mast to minimize the length of sample tubing. This avoids the attenuation of high frequencies
in the concentration data that can be caused by excessive tubing length. The TGA100 PC requires shelter from the
environment, but can be located up to 500 m (1650 ft) away from the TGA100 analyzer, connected by fiber optic cable.
The sample pump requires minimal shelter and can be located up to 90 m (300 ft) away from the analyzer, connected
by the suction hose. The CSAT3 connects to the TGA analyzer by way of a TL925 serial interface module, which can
be mounted inside the analyzer enclosure for protection from the environment.
CSAT3 Cable
Figure 1-5. Example Eddy Covariance Flux Application
17

1.6.2 Flux Gradient
The TGA100 also supports the measurement of trace gas fluxes by the gradient method. The TGA100 automatically
controls gradient switching valves and computes the mean concentration at each of the two intake heights. Timing
parameters are entered by the user to control the gradient valves, typically switching between intakes every 5 to 20 s.
The results are displayed on the TGA100 PC in real-time and stored on the hard disk.
Figure 1-6
Figure 1-6. Example Gradient Flux Application
illustrates a typical gradient application. Two intake assemblies are mounted at different heights on the
measurement mast. Tubing connects each intake assembly to a gradient valve assembly that selects one of the intakes at
a time. The air sample from the selected intake flows through the PD1000 sample air dryer, which filters and dries the
air sample. A needle valve at the outlet of the PD1000 sets the sample flow rate, typically 5 to 10 slpm. Tubing
connects the outlet of the dryer to the TGA100 analyzer, which may be located 200 m (650 ft) or more away. The
TGA100 PC requires shelter from the environment, and can be located up to 500 m (1650 ft) away from the TGA100
analyzer, connected by fiber optic cable. However, for gradient applications the analyzer is normally positioned away
from the intake mast, and the PC is placed near the analyzer for convenience. The sample pump requires minimal
shelter and can be located up to 90 m (300 ft) away from the analyzer, connected by 1” ID suction hose.
This example shows a gradient flux measurement at a single site. However, the TGA100 can also support flux gradient
measurements at multiple sites by installing intake assemblies, a gradient valve assembly, and a sample dryer at each
site, and a site selection system near the analyzer. The site selection system connects one site at a time to the analyzer.
The TGA100 controls the site selection system using timing parameters supplied by the user. Normally each site is
measured for 15 to 30 min before switching to the next site.
18

1.6.3 Site Means
The TGA100’s site means sampling mode is similar to the flux gradient mode in that it controls switching valves and
calculates mean concentrations for each intake. The difference between the two sampling modes is that the gradient
mode considers the sample intakes in pairs, switching several times between an upper and lower intake before moving
to another site, but the site means mode considers all of the intakes as one group. It cycles through all of the intakes in
sequence (up to 18 sites are supported). Applications for the site means mode include concentration profile
measurements and trace gas flux measurements using the mass balance technique.
Figure 1-7
Figure 1-7. Example Profile Application
illustrates an eight-level vertical profile using the TGA100 site means mode. The eight intake assemblies are
arranged vertically on a single measurement tower. These intake assemblies include a filter to remove particulates and a
critical flow orifice to set the sample flow (typically less than 1 slpm). A separate tube connects each intake assembly to
the site selection system, which selects one of the intakes at a time. All of the unselected intakes are connected through
the bypass tube to the sample pump suction hose, keeping air flow at all times in all intake tubes. The flow from the
selected intake goes through a sample air dryer to the TGA100 analyzer. A second dryer is used to provide dry air to
purge the sample dryer.
Purge Dryer
Sample Dryer
Site Selection
Sampling
System
Digital Control Cable
Sample
Bypass
Dryer Purge
Sample
Sample
Intakes
19

1.6.4 Absolute Concentration / Isotope Ratio Measurements
The TGA100 can be configured for highly accurate measurements of trace gas concentrations by performing frequent
calibration. The TGA100 has a small offset error caused by optical interference. This offset error changes slowly over
time, with a standard deviation roughly equal to the short-term noise. Offset errors have little effect on flux
measurements by either the gradient or eddy covariance technique, but may be important in other applications. For
measurements of absolute trace gas concentration, the offset error can be removed by switching between a
nonabsorbing gas (e.g. nitrogen) and the sample, using the gradient mode of operation.
Applications such as isotopic ratio measurements require the highest possible accuracy. This is achieved using a
frequent two-point calibration to correct for drift in the instrument gain and offset. High accuracy requires the flow rate
for the calibration gases to be the same as for the sample air. Even though the sampling system can be designed so that
calibration gases flow only when they are used, frequent calibration (every few minutes) consumes a large amount of
calibration gas if high flow rates are used. The site means sampling mode is normally used because it works well at low
flow rates.
Figure 1-8
Figure 1-8. Example CO
2
Isotope Application
illustrates a typical CO
2
isotope application. It is similar to the site means example above, but it also includes
two intakes connected to calibration tanks. A tank of nitrogen or CO
2
-free air is also shown connected to the analyzer to
purge the air gap between the laser dewar and sample cell. This purge is required for CO
2
isotope measurements
because of the high ambient concentration of CO
2
and the need for high accuracy.
Purge Dryer
Sample Dryer
Site Selection
Sampling
System
Digital Control Cable
Sample
Bypass
Dryer Purge
Sample
Sample
Intakes
Purge
Calibration tanks
20
Page is loading ...
Page is loading ...
Page is loading ...
Page is loading ...
Page is loading ...
Page is loading ...
Page is loading ...
Page is loading ...
Page is loading ...
Page is loading ...
Page is loading ...
Page is loading ...
Page is loading ...
Page is loading ...
Page is loading ...
Page is loading ...
Page is loading ...
Page is loading ...
Page is loading ...
Page is loading ...
Page is loading ...
Page is loading ...
Page is loading ...
Page is loading ...
Page is loading ...
Page is loading ...
Page is loading ...
Page is loading ...
Page is loading ...
Page is loading ...
Page is loading ...
Page is loading ...
Page is loading ...
Page is loading ...
Page is loading ...
Page is loading ...
Page is loading ...
Page is loading ...
Page is loading ...
Page is loading ...
Page is loading ...
Page is loading ...
Page is loading ...
Page is loading ...
Page is loading ...
Page is loading ...
Page is loading ...
Page is loading ...
Page is loading ...
Page is loading ...
Page is loading ...
Page is loading ...
Page is loading ...
Page is loading ...
Page is loading ...
Page is loading ...
Page is loading ...
Page is loading ...
Page is loading ...
Page is loading ...
Page is loading ...
Page is loading ...
Page is loading ...
Page is loading ...
Page is loading ...
Page is loading ...
Page is loading ...
Page is loading ...
Page is loading ...
Page is loading ...
Page is loading ...
Page is loading ...
Page is loading ...
Page is loading ...
Page is loading ...
Page is loading ...
Page is loading ...
Page is loading ...
Page is loading ...
Page is loading ...
Page is loading ...
Page is loading ...
Page is loading ...
Page is loading ...
Page is loading ...
Page is loading ...
Page is loading ...
Page is loading ...
Page is loading ...
Page is loading ...
Page is loading ...
Page is loading ...
Page is loading ...
Page is loading ...
Page is loading ...
/