Page is loading ...

APOGEE INSTRUMENTS, INC. | 721 WEST 1800 NORTH, LOGAN, UTAH 84321, USA
TEL: (435) 792-4700 | FAX: (435) 787-8268 | WEB: APOGEEINSTRUMENTS.COM
Copyright © 2023 Apogee Instruments, Inc.
OWNER’S MANUAL
INSIGHT QUANTUM
SPECTRORADIOMETER
Models MS-100
Rev: 18-July-2023

2
TABLE OF CONTENTS
Owner’s Manual ............................................................................................................................................................ 1
Certificate of Compliance ...................................................................................................................................... 3
Certificate of Compliance ...................................................................................................................................... 4
Packing Contents ................................................................................................................................................... 5
Introduction ........................................................................................................................................................... 6
Sensor Models ....................................................................................................................................................... 7
Product Diagram .................................................................................................................................................... 8
Getting Started ...................................................................................................................................................... 9
Dark Calibration ................................................................................................................................................... 11
Taking a Measurement ........................................................................................................................................ 12
Data Screen Explanations .................................................................................................................................... 14
Specifications ....................................................................................................................................................... 17
Cosine Correction ................................................................................................................................................ 19
Using Apogee InSight PC Software ...................................................................................................................... 20
Downloading Data ............................................................................................................................................... 34
Using Modbus ...................................................................................................................................................... 34
Using the Apogee InSight App ............................................................................................................................. 38
Maintenance and Recalibration .......................................................................................................................... 45
Troubleshooting and Customer Support ............................................................................................................. 46
Return and Warranty Policy ................................................................................................................................ 47

3
CERTIFICATE OF COMPLIANCE
EU Declaration of Conformity
This declaration of conformity is issued under the sole responsibility of the manufacturer:
Apogee Instruments, Inc.
721 W 1800 N
Logan, Utah 84321
USA
for the following product(s):
Models: MS-100
Type: Spectroradiometer
The object of the declaration described above is in conformity with the relevant Union harmonization legislation:
2014/30/EU Electromagnetic Compatibility (EMC) Directive
2011/65/EU Restriction of Hazardous Substances (RoHS 2) Directive
2015/863/EU Amending Annex II to Directive 2011/65/EU (RoHS 3)
Standards referenced during compliance assessment:
EN 61326-1:2013 Electrical equipment for measurement, control, and laboratory use – EMC requirements
EN 63000:2018 Technical documentation for the assessment of electrical and electronic products with
respect to the restriction of hazardous substances
Please be advised that based on the information available to us from our raw material suppliers, the products
manufactured by us do not contain, as intentional additives, any of the restricted materials including lead (see
note below), mercury, cadmium, hexavalent chromium, polybrominated biphenyls (PBB), polybrominated
diphenyls (PBDE), bis (2-ethylhexyl) phthalate (DEHP), butyl benzyl phthalate (BBP), dibutyl phthalate (DBP), and
diisobutyl phthalate (DIBP). However, please note that articles containing greater than 0.1 % lead concentration
are RoHS 3 compliant using exemption 6c.
Further note that Apogee Instruments does not specifically run any analysis on our raw materials or end products
for the presence of these substances, but we rely on the information provided to us by our material suppliers.
Signed for and on behalf of:
Apogee Instruments, July 2023
Bruce Bugbee
President
Apogee Instruments, Inc.

4
CERTIFICATE OF COMPLIANCE
UK Declaration of Conformity
This declaration of conformity is issued under the sole responsibility of the manufacturer:
Apogee Instruments, Inc.
721 W 1800 N
Logan, Utah 84321
USA
for the following product(s):
Models: MS-100
Type: Spectroradiometer
The object of the declaration described above is in conformity with the relevant UK Statutory Instruments and
their amendments:
2016 No. 1091 The Electromagnetic Compatibility Regulations 2016
2012 No. 3032 The Restriction of the Use of Certain Hazardous Substances in Electrical and Electronic
Equipment Regulations 2012
Standards referenced during compliance assessment:
BS EN 61326-1:2013 Electrical equipment for measurement, control, and laboratory use – EMC requirements
BS EN 63000:2018 Technical documentation for the assessment of electrical and electronic products with
respect to the restriction of hazardous substances
Please be advised that based on the information available to us from our raw material suppliers, the products
manufactured by us do not contain, as intentional additives, any of the restricted materials including lead (see
note below), mercury, cadmium, hexavalent chromium, polybrominated biphenyls (PBB), polybrominated
diphenyls (PBDE), bis (2-ethylhexyl) phthalate (DEHP), butyl benzyl phthalate (BBP), dibutyl phthalate (DBP), and
diisobutyl phthalate (DIBP). However, please note that articles containing greater than 0.1 % lead concentration
are RoHS 3 compliant using exemption 6c.
Further note that Apogee Instruments does not specifically run any analysis on our raw materials or end products
for the presence of these substances, but we rely on the information provided to us by our material suppliers.
Signed for and on behalf of:
Apogee Instruments, July 2023
Bruce Bugbee
President
Apogee Instruments, Inc.

5
Case
MS-100 InSight Spectroradiometer
Protective Case
Quick Start Guide
Mini-USB Cable
Power Adapter
Modbus Communication Board
Neck Strap Screw
Neck Strap

6
Spectral (i.e., wavelength-dependent) radiation is intensity of output from a radiation source (e.g., sun, electric
lamp, reflected radiation from a surface of interest) as a function of wavelength. Radiation spectra vary for
different radiation sources and conditions. Radiation spectra can be used to characterize radiation sources.
Spectrometers measure relative spectral radiation over a specified wavelength range. Spectroradiometers are
spectrometers calibrated to output spectral measurements in absolute units (e.g., energy flux density in W m-2
nm-1 or photon flux density in µmol m-2 s-1 nm-1).
Typical applications of spectroradiometers include measurement of spectral output from radiation sources used to
grow plants, algae, and corals (e.g., in greenhouses, growth chambers, and aquarium lighting), measurement of
solar spectra with changing atmospheric conditions, and measurement of spectral reflectance on stationary (e.g.,
agricultural or ecological weather stations and flux towers) and mobile (e.g., plant phenotyping) platforms. Please
note that the meter is not waterproof.
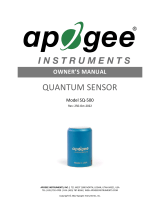
Apogee Instruments InSight model MS-100 (380 to 780 nm measurement range) spectroradiometers are handheld
units designed for laboratory and field use. Each spectroradiometer consists of a spectrometer (slit, diffraction
grating, detector array) and diffuser mounted in a small plastic housing. Each unit is calibrated to provide spectral
measurements in absolute units. Onboard circuitry allows for output to a computer (via USB), handheld device (via
Bluetooth), or datalogger (via ModBus).

7
The Apogee InSight MS series handheld quantum spectroradiometers covered in this manual are self-contained
and come complete with a handheld meter, carrying case, protective case, quick start guide, mini-USB cable,
power adapter, communication board, neck strap screw, and neck strap.
Sensor model number is located
on a label on the right side of the
meter. The serial number is
located on the same side under
the bar code.

8

9
Installing the SD Card
This unit writes measurement data onto a MicroSD card (1 GB to 32 GB). The SD card is not
included and must be purchased separately. Insert the card into the MicroSD card slot. All
captured data is written to excel files (.xls).
Even without a MicroSD Card, the MS-100 can capture data.
Setting the Date/Time
Plug your MS-100 into your PC using the included mini-USB cable. Launch the
Apogee InSight software. Click on “Device.” Under “Device List,” click on your
meter and choose “Connect” to automatically sync up your device with the
Date/Time on your PC.
Charging the Internal Battery
Connect one end of the mini-USB charger cable to the MS-100 and the other end
into a wall socket with the appropriate voltage. You can also connect the meter
to a computer to charge. The indicator light will illuminate orange while it is
charging. The light will turn green when fully charged. For first time use, charge
the battery for at least 6 hours.
The indicator light will light up in orange
while charging, and light up green when
the battery is fully charged.
If the unit is charging, a lightning bolt will
appear over the battery symbol.
charging
charged

10
Using the Lanyard Strap/Tripod
You can attach a lanyard (neck strap) onto the ring at the
bottom of the MS-100.
If you detach the lanyard screw on the bottom of the MS-
100, it will expose a screw hole where you can attach a
tripod for hands-free LED measurements.

11
It is good practice to perform a dark calibration every time you turn on the MS-100, whenever you move to a
different temperature environment (hot to cold or cold to hot), or whenever you move to a different light
intensity environment (light to dark or dark to light).
Slide the sensor cover up over the sensor lens on the back of the unit.
Press the “Measure” button at the top of the MS-100. The calibration takes
approximately 6 seconds.
When Dark Calibration is complete, the screen will read “Calibration OK.”
You also can use the InSight PC software to perform a dark calibration.

12
1. Slide the sensor cover up over the sensor diffuser on the back of the unit.
2. Turn on the MS-100 by pressing the On/Off button on the left side of the unit. The
indicator light on the front of the unit will illuminate green, and an Apogee splash
screen will display.
Note: If you are using a USB charger, the MS-100 will automatically turn itself on.
3. After the splash screen, a “Dark Calibration” label will display, indicating that a
dark calibration is in progress.
4. When dark calibration is complete, the screen will read “Calibration OK” and then
show the time, date, and software version number.
5. Slide the sensor cover down so that the sensor diffuser is visible again.

13
6. The first screen will display the date and time, optic number, and software
version number. The battery level indicator is on the top right.
7. Hold the MS-100 as shown with the sensor facing toward the front, in the
direction of a light source, and press the “measure” button on the top of the MS-
100.
8. The measurement takes approximately 10 seconds to complete. The unit will
beep to indicate completion. The screen will then show the wavelength spectrum.
Press the On/Off button on the left side of the unit to go to the next measurement
screen.
Note: See the following page for an explanation of the different measurements the
MS-100 can take.
9. Continue to press the On/Off button once to go to the next screen. The following
screens display the different measurements.

14
PPFD: photosynthetic photon flux density. Sum of photons between 400 and 700 nm in units of micromoles per
square meter per second [mmol m-2 s-1] for instantaneous measurements. PPFD is almost universally used to
quantify photosynthetically active radiation (PAR), radiation driving photosynthesis.
ePPFD: extended photosynthetic photon flux density. Sum of photons between 400 and 750 nm in units of mmol
m-2 s-1 for instantaneous measurements. Recent research indicates PAR should be extended to include far red
photons between 701 and 750 nm because these photons drive photosynthesis with similar efficiency to photons
in the 400 to 700 nm range when they are acting synergistically with photons in the 400 to 700 nm range (meaning
when far red photons in the 701 to 750 nm range are added to photons in the 400 to 700 nm range) (Zhen and van
Iersel, 2017; Zhen et al., 2019; Zhen and Bugbee 2020a; Zhen and Bugbee 2020b; Zhen et al., 2021; Zhen et al.,
2022).
YPFD: yield photon flux density. Photon flux density at each wavelength weighted by relative quantum efficiency,
measured by McCree (1972a, 1972b), and summed. Quantum yield is moles of carbon fixed per mole of
photosynthetic photons absorbed. Relative quantum yield data from McCree were derived from measurements
made on single leaves of twenty-two species with monochromatic radiation sources over short time intervals.
YPFD as measure of photosynthetically active radiation may not be appropriate for broad spectrum radiation
sources over longer time intervals for whole plants and plant canopies.
TPFD: total photon flux density. Sum of photons between 380 and 780 nm in units of mmol m-2 s-1 for
instantaneous measurements. The range 380 to 780 nm is the entire spectral measurement range of the
spectroradiometer.
PFD-UV: photon flux density in the ultraviolet (UV) range. Sum of photons between 380 and 399 nm in units of
mmol m-2 s-1 for instantaneous measurements. The spectroradiometer is only sensitive to UV radiation from 380 to
399 nm.
PFD-B: photon flux density in the blue (UV) range. Sum of photons between 400 and 499 nm in units of mmol m-2 s-
1 for instantaneous measurements.
PFD-G: photon flux density in the green (G) range. Sum of photons between 500 and 599 nm in units of mmol m-2
s-1 for instantaneous measurements.
PFD-R: photon flux density in the red (R) range. Sum of photons between 600 and 700 nm in units of mmol m-2 s-1
for instantaneous measurements.
PFD-FR: photon flux density in the far-red (FR) range. Sum of photons between 701 and 750 nm in units of mmol
m-2 s-1 for instantaneous measurements.
FR F: far-red fraction. Sum of far-red photons between 701 and 750 nm divided by the sum of photons between
400 and 750 nm (ePAR range). Phytochrome is a pigment in plant leaves that mostly absorbs radiation in the red
and far-red wavelength ranges. Absorption by phytochrome in these ranges influences plant perception of sunny
and shaded conditions, and as a result, plant morphology. Historically, the red to far-red ratio has been used in
field studies as a metric to indicate full sunlight to deep shade, where full sunlight has a red to far-red ratio near

15
1.1 and deep shade has a red to far-red ratio less than 0.1. However, the red to far-red ratio approaches infinity for
some electric light sources. The far-red fraction is an improved metric for indicating the sun to shade environment
because it ranges from 0 to 1 and is positively correlated with plant morphological responses influenced by
phytochrome (Kusuma and Bugbee, 2020). A far-red fraction of 0 indicates no far-red radiation and a far-red
fraction of 1 indicates only far-red radiation.
PPE: phytochrome photoequilibrium. Photon flux density at each wavelength weighted by phytochrome red state
weighting factors divided by the sum of photon flux density at each wavelength weighted by phytochrome red
state weighting factors and photon flux density at each wavelength weighted by phytochrome far-red state
weighting factors, where the weighting factors are from Sager et al. (1988). Phytochrome photoequilibrium is a
metric to quantify the sun versus shade environment of plants. It is used in a similar way to red to far-red ratio and
far-red fraction, but weights spectral radiation by the photostationary states of phytochrome and therefore
accounts for spectral absorptivity of phytochrome. Phytochrome photoequilibrium ranges from 0 to 1, with full
sunlight about 0.7 and deep shade near 0.3.
iPPE: improved phytochrome photoequilibrium. Same as PPE, but with updated weighting factors from Kusuma
and Bugbee (2021). The updated weighting factors include distortion functions that account for radiation
absorption from the leaf surface to location of phytochrome within the leaf.
CFI: sometimes called color fidelity index. Relative metric quantifying the ability of a light source to accurately
render colors of objects relative to the color appearance when illuminated by a reference light source, typically
daylight. Similar metric to color rendering index (CRI) but updated to include more color samples to produce a
more representative measurement than CRI. CRI was derived with eight color samples, Rf was derived with ninety-
nine.
CRI: color rendering index. Relative metric quantifying the ability of a light source to accurately render colors of
objects relative to the color appearance when illuminated by a reference light source, typically daylight. Maximum
CRI is 100 and is only achieved by a light source with a spectrum identical to daylight, which would render colors
the same as daylight. CRI can be negative, as with a low-pressure sodium lamp, which is about -44. Typically, CRI
falls between 0 and 100. Incandescent bulbs are near 100 and most white LEDs are greater than 80.
CCT: correlated color temperature. Metric quantifying color appearance of white light sources. It is reported as an
absolute temperature (in units of K) and typically ranges from 2000 to 6500 K, with lights that appear blue (cool
colors) being higher numbers and lights that appear orange (warm colors) being lower numbers. For example, clear
blue sky ranges from about 15000-25000 K and flame ranges from about 1700-2000 K. An incandescent bulb is
about 2500 K.
LUX: lux. Illuminance in units of lumens per square meter [lm m-2]. Metric that quantifies light intensity weighted
by the sensitivity of the human eye, as defined by the CIE 1931 weighting factors.
ADDITIONAL MEASUREMENT INFORMATION
fc: footcandles. Illuminance in units of lumens per square foot [lm ft-2]. Metric that quantifies light intensity
weighted by the sensitivity of the human eye, as defined by the CIE 1931 weighting factors.
R FR R: red to far-red ratio. Sum of red photons between 650 and 670 nm divided by the sum of far-red photons
between 720 and 740 nm. Metric often used in field studies to indicate plant radiation environment from full sun
to deep shade. As indicated above, far-red fraction is an improved metric.

16
LambdaP: peak wavelength. Wavelength where maximum radiation is measured, in units of nanometers [nm].
LambdaD: dominant wavelength. Wavelength indicating perceived color of a radiation source, in units of nm. It is
the wavelength within the visible range that aligns with perceived hue.
CIE 1931 x and y: chromaticity coordinates calculated from CIE 1931 color matching functions.
CIE 1976 u’ and v’: chromaticity coordinates calculated from CIE 1976 color matching functions.
Kusuma, P., and B. Bugbee, 2020. Far-red fraction: An improved metric for characterizing phytochrome effects on
morphology. Journal of the American Society of Horticultural Science, doi: 10.21273/JASHS05002-20.
Kusuma, P., and B. Bugbee, 2021. Improving the predictive value of phytochrome equilibrium: Consideration of
spectral distribution within a leaf. Frontiers in Plant Science, doi: 10.3389/fpls.2021.596943.
McCree, K. J., 1972a. The action spectrum, absorptance and quantum yield of photosynthesis in crop plants.
Agricultural Meteorology, 9:191-216.
McCree, K. J., 1972b. Test of current definitions of photosynthetically active radiation against leaf photosynthesis
data. Agricultural Meteorology, 10:443-453.
Sager, J. C., W. O. Smith, J. L. Edwards, and K. L. Cyr, 1988. Photosynthetic efficiency and phytochrome
photoequilibria determination using spectral data. Transactions of the ASAE 31(6):1882-1889.
Zhen, S., and M. W. Van Iersel, 2017. Far-red light is needed for efficient photochemistry and photosynthesis.
Journal of Plant Physiology, 209:115–122.
Zhen, S., M. Haidekker, and M. W. van Iersel, 2019. Far-red light enhances photochemical efficiency in a
wavelength-dependent manner. Physiologia Plantarum, 167(1):21-33.
Zhen, S., and B. Bugbee, 2020a. Far-red photons have equivalent efficiency to traditional photosynthetic photons:
Implications for redefining photosynthetically active radiation. Plant Cell and Environment, doi:
10.1111/pce.13730.
Zhen, S., and B. Bugbee, 2020b. Substituting far-red for traditionally defined photosynthetic photons results in
equal canopy quantum yield for CO2 fixation and increased photon capture during long-term studies: Implications
for re-defining PAR. Frontiers in Plant Science, doi: 10.3389/fpls.2020.581156
Zhen, S., M. W. Van Iersel, and B. Bugbee, 2021. Why far-red photons should be included in the definition of
photosynthetic photons and the measurement of horticultural fixture efficacy. Frontiers in Plant Science, doi:
10.3389/fpls.2021.693445.
Zhen, S., M. W. Van Iersel, and B. Bugbee, 2022. Photosynthesis in sun and shade: The surprising importance of far-
red photons. New Phytologist, doi: 10.111/nph.18375.

17
MS-100
SPECTRUM
Sensor
CMOS Linear Image Sensor
Wavelength Range
380 to 780 nm
Wavelength Data
Increment
1 nm
Spectral Bandwidth
Approximately 12 nm (half bandwidth)
Wavelength
Reproducibility
± 1 nm*1
Measurement Range
PPFD: 0.1 to 3,500 µmol mˉ² sˉ¹; Lux: 5 to 190,000 lx
Illuminance Accuracy
Illuminant A @ 2,856 K at 20,000 lx *2
± 5 %
Color Accuracy
± 0.0025 in CIE 1931 x, y
Color Repeatability
± 0.0005 in CIE 1931 x, y
CCT Accuracy
± 2 %
CRI Accuracy @ Ra
± 1.5 %
Stray Light
-25 dB max. *3
Integration Time
Range
6 to 1,000 ms
Digital Resolution
16 bits
FEATURE
Capture Function
One time
Operation Mode
Standalone Mode/Bluetooth Mode/USB Mode (PC Connection)
Integration Mode
Auto
Measuring Modes
1. Spectrum Graphics
2. PPFD, ePPFD, YPFD, TPFD
3. PFD-UV, PFD-B, PFD-G, PFD-R
4. PFD-FR, FR F, PPE, iPPE
5. CFI, CRI, CCT, lux
6. fc, R F-R R, λp,
λd
7. CIE 1931 x & y, CIE 1976 u’ & v’
Measuring Capabilities
1. Illuminance (LUX)/Foot Candle (fc)
2. Correlated Color Temperature (CCT)
3. CIE Chromaticity Coordinates
a. CIE 1931 x, y Coordinates
b. CIE 1976 u’, v’ Coordinates
c. CIE 1931 XYZ Value
4. Dominant Wavelength
(λd)
5.
Color Fidelity Index (CFI, Ra)/R1 to R15
6.
Photosynthetically Active Radiation (PAR)
a. PPFD (400 to 700 nm) mˉ² sˉ¹
b. ePPFD (400 to 750 nm) mˉ² sˉ¹
c.
PPF-UV (380 to 400 nm)
mˉ² sˉ¹
d.
PPF-B (400 to 500 nm)
mˉ² sˉ¹
e.
PPF-G (500 to 600 nm)
mˉ² sˉ¹

18
*1:Input source must be a stable light source.
*2:Temperature 23±2℃ and relative humidity 50% or less.
*3:Input the 550nm monochromatic light and measure the stray light ratio at 550nm ± 40nm.
Calibration Traceability
Spectroradiometer calibrations are performed using a radiation source traceable to the National Institute of
Standards and Technology (NIST).
f.
PPF-R (600 to 700 nm)
mˉ² sˉ¹
g.
PPF-NIR (700 to 780 nm)
mˉ² sˉ¹
7. Percent Flicker
8. Spectral Power Distribution (SPD) mW/m2
9. Peak Wavelength (
λp)
10. Peak Wavelength (
λpV)
11.
Integration Time (I-Time)
SYSTEM CONFIGURATIONS
Display
0.96” 128x64 mono OLED
Maximum Files
≒ 1.2 million files @ 8 GB Micro-SD card (Excel)
Battery Operation
Time
≦ 3 hours/Fully charged
Battery Operation
Power
USB Power; 700 mAh/3.7V Rechargeable Li-ion Battery
Micro Card (SD 2.0, SDHC/up to 32G)
Data Output Interface
Mini USB port (USB 2.0)
Bluetooth 3.0 and 4.0 compatible with iOS and Android
Data Format
Compatible with Microsoft Office Excel
Dimensions
90 x 30 x 32.2 mm (H x W x D)
Weight (with Battery)
70 g ± 5 g
Operating
Temperature
0 to 35˚C, relative humidity 70 % or less without condensation
Storage Temperature
-10 to 40˚C, relative humidity 70 % or less without condensation
Display Languages
English
Software
Apogee InSight (available for PC, iOS, and Android)
Warranty
One year

19
Directional (cosine) response is defined as
the measurement error at a specific angle of
radiation incidence. Error for Apogee InSight
MS-100 series spectroradiometers is
approximately ± 2 % and ± 5 % at solar zenith
angles of 45° and 70°, respectively.

20
To download Apogee InSight software, go to www.apogeeinstruments.com/downloads/.
DEVICE SCREEN
Launch the Apogee InSight software. Plug your
spectroradiometer into the PC using the included mini-USB cable.
To connect your MS-100, click on “Device.” Under “Device List,”
select on your meter and choose “Connect.” This will also
automatically sync up your device with the Date/Time on your
PC.
Perform a dark calibration on your meter. Once your meter is
connected to the software, click the “Dark Calibration” button
above the “Setting” button. The calibration takes about 4
seconds.
/