Page is loading ...

VM700T (turbo)
Video Measurement Set
Option 11
PAL Video Measurements
M
any capabilities in one instrument
–
Digitizing waveform monitor
– Digitizing vectorscope
– Picture Display
– Group delay and frequency
response
– Noise measurement set
– Automatic measurement set
Auto mode
– Unattended monitoring of PAL
video signals from studios, STLs,
Earth Stations, and transmitters
– User-specified limits
Measur
e mode provides graphic
display of measurements
– ICPM
– K factor
– Differential gain and phase
– Chrominance to luminance delay
– Noise spectrum
– Group delay with sin x/x
– Color bars
– Relative to reference on most
measurements
– Configurable for all standard
test signals
Award winning user interface
State-of-the-art architecture
Extremely fast update rate
Parallel and serial printer ports
Three input channels
Channel difference modes
External VGA display port
Fully documented r
emote control
operation
Har
dcopy for analysis and
documentation
Recognized with eight technical
Emmy awards and one Oscar for
outstanding contributions to the
television industry, Tektronix
world class core competencies
have enabled it to design and
deliver the most comprehensive
solutions in the industry.
The VM700T is a product of this
core competency. Recognized as
the defacto industry standard that
keeps pace with evolving cus-
tomer needs, the VM700T is a
total solution for your baseband
video and audio
1
monitoring and
measurement needs. Featur
es
such as an extremely fast and
fully automatic measurement
mode as well as full manual oper-
ation
pr
ovides the first time user
as well as the seasoned profes-
sional an unequaled value for their
test and measurement investment.
Automatic video measurement set
The VM700T Auto mode makes
standard video transmitter mea-
sur
ements quickly and automati
-
cally, including those specified
in CCIR Rep. 624-1, Rec. 567,
and Rec. 569. Both vertical inter-
val and full field measurements
can be made and compared with
user-defined limits. A dual limit
verification system is employed
to generate a caution or alarm
message when either limit is vio-
lated. Reports can be generated
and printed automatically at
operator scheduled times or trig-
gered from a conditional event.
Graphic displays of measurements
Measure mode provides virtual
real time graphic displays of
measurement results automati-
cally. Vertical interval or full
field measurements including
noise spectrum, group delay,
K-factor, dif
ferential gain and
differential phase are presented
as clever, easy to understand
interactive digital displays. Such
displays ar
e indispensable when
extremely fast measurement
update rates (up to 30 times a
second) are required to provide
instant feedback of critical
adjustments and analysis of
signal variations. User definable
limits are visually integrated into
each graphic display and can be
used to trigger a measur
ement
report or a user definable macro
function. Such a function can,
for example, dial out through a
Copyright © 1996, T
ektr
onix, Inc. All rights r
eser
ved.
1
Option 40 audio measurement package.

modem to report measurement
r
esults or control a signal router.
A relative to reference mode
allows normalizing to a signal
source or eliminate signal path
errors from the desired
measurement. Up to 2 video
references can be stored in
NVRAM. Additionally, after
downloading to a PC through the
V
M700T FTP driver, the video
reference can be uploaded to
another VM700T for reuse. A
running averaging mode can be
used to reduce the effect of noise.
When additional measurement
data is required a user can custom
configure measurement parameters
and report format.
A powerful Test Signal search
capability quickly and automati-
cally locates and identifies valid
test signals required for a selected
measurement, eliminating the
annoying and time consuming
task of manually locating
test signals.
Digital waveform monitor/
vectorscope
The VM700T Waveform mode
application provides real time
graphics displays of the video
signal allowing many additional
measurements to be made manu-
ally. Easy to use measurement
cursors are available to measure
time, frequency and amplitude
parameters of a video signal.
These cursors allow a very quick
and precise location of the 10%,
50% and 90% points on any
transition. Cursor mode also
employs an automatic calcula-
tion in the wave shape in the
center of the display
. The para-
meters calculated are sine peak-
to-peak amplitude, frequency,
and of
fset from blanking level.
This is very useful for frequency
r
esponse measur
ements with the
Multiburst signal.
The wavefor
m display can be
expanded around any point both
vertically and horizontally. Since
the data is digitized, the display
remains bright and easy to ready
at all expansion factors. The
scales automatically expand with
the waveform, so all units are
correct as displayed. A channel
dif
fer
ence mode (A-B, A-C, B-A,
B-C, C-A, and C-B) is also provided.
A
screen memory selection
enables Envelope mode, which is
useful for looking at teletext,
Jitter, or other changes over time.
Vector mode provides the normal
vectorscope display. The vectors
may be rotated or expanded, with
t
he rotation angle and gain values
displayed numerically on the screen.
A unique “Find ColorBars” feature
searches all video for ColorBars
and displays the vectors if found.
The vectors can be referenced to
either the selected channel’s burst
or the burst of one of the other
two channels or continuous
subcarrier. The phase difference
between the selected channel and
the reference is always displayed.
Select Line in both Waveform
and Vector modes can be used
to quickly specify any line for
display or automatic measurement
if it is the proper signal.
Picture mode
The signal source can be quickly
verified using the picture display.
Additionally, a “bright-up” line
select mode allows a user to
select any video line for use in
Measure mode or for viewing in
Waveform or Vector mode.
User programmable functions
Function mode is an extremely
powerful feature that allows a
user to store a sequence of user
operations as a macro function
for later “playback.”
For example, a set of measur
e-
ments (complete with hardcopy
commands) to be made on a
transmitter demodulator video
output, could be stored as a
function labeled “DEMOD.” The
function “playback” could then
be initiated manually, remotely
or completely automatically as a
user specified timed event.
Function files can be stored as a
text file on a PC for editing,
copying or uploading to another
VM700T. Other function capabil-
ities include controlling of external
serial devices such as video/audio
routers, switchers, signal generators,
telephone modems and many
other devices which support
RS232 communications.
Hardcopy
All information on the screen
m
ay be printed in high resolution
graphics on printers supporting
PostScript
®
, Hewlett-Packard
®
LaserJet™, DeskJet™, and
ThinkJet™, or 24-pin Epson
®
g
raphics via the Centronics
compatible parallel port or
standard RS-232C interface.
Automatic measurement results
in text format can be printed on
most ASCII printers using the
parallel or serial ports.
Remote Operation
The VM700T has a powerful and
fully documented remote control
language. The VM700T can
thus be operated from a remote
terminal via RS-232C to monitor
unattended transmission systems.
In addition, all files can be
uploaded to a main computer,
and downloaded to other
VM700Ts. Two different
protocols are supported: FTP
(File Transfer Protocol) and
TELNET. The user can also select
a “no protocol” mode of the
RS-232C interface when dealing
with low baud rates. However,
file transfers can only take place
with FTP.
Specifications
The performance requirements
cited in this section are valid
only within the following
environmental limits:
Temperature range of 0 to 50
degrees Celsius, with a
minimum warm-up time of 20
minutes. The following tables list
each measurement and its
performance requirement.
The range specifies the extremes
between which a measurement
can be made.
All measurement accuracies
specified are valid only with
nominal input signals of 1 volt
pk-pk (± 6 dB) with an unweighted
signal-to-noise ratio of at least
60 dB on the incoming signal and
a termination accuracy of ± 0.025%
(Tektronix PN 011-0102-01
or equivalent).
2

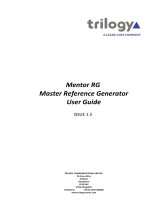
Vertical interval test signals can be seen very clearly for additional analysis of the signal.
These can be printed as support documentation for automatic measurement results.
E
ven a single horizontal synchronization pulse can be displayed at a high intensity.
0.5
0.0
Volts
Sound-In-Sync OffSound-In-Sync OffPrecision Mode On Precision Mode On
L18 L19
M
icroSeconds
20.0 40.0 60.0 80.0 100.0 120.0
Sync = SourceSync = Source625 line PAL 625 line PAL Synchronous Synchronous No Filtering No Filtering
APL = 42.5% APL = 42.5%
S
inewave at middle of screen is too small or frequency too low for measurement.
S
inewave at middle of screen is too small or frequency too low for measurement.
0.1
0.0
-0.1
-0.2
-0.3
Volts
Sound-In-Sync On Sound-In-Sync On Precision Mode OffPrecision Mode Off
Time from L to R: 4.703 MicroSecondsTime from L to R: 4.703 MicroSeconds
Frequency (1/T): 0.212647 MHzFrequency (1/T): 0.212647 MHz
L19
MicroSeconds
-1.0 0.0 1.0 2.0 3.0 4.0 5.0
Sync = SourceSync = Source
Vertical delta: -0.256 VoltsVertical delta: -0.256 Volts
Frames selected: Frames selected: 11 22 33 44
625 line PAL 625 line PAL Synchronous Synchronous
Slow clamp to 0.00 V at 6.72 uSSlow clamp to 0.00 V at 6.72 uS
No Filtering No Filtering
APL = 42.1% APL = 42.1%
Noise reduction: 15.05db Noise reduction: 15.05db
In Vector Mode, the VM700T becomes a digital vectorscope with an electronic graticule.
The “Color Bar Search’’ feature makes it easy to quickly display a line containing a color
bar test signal.
Main Measure Mode display of available measurements.
Sound In Sync ON Sound In Sync ON
V
U
75%
100%
mg
Mg
r
R
yl
Y
l
g
G
cy
Cy
b
B
A
PL = 42.2%
A
PL = 42.2%
System LineSystem Line
A
ngle (deg) 0.0
A
ngle (deg) 0.0
Gain x 1.014Gain x 1.014
0
.125 dB
0
.125 dB
L133 L133
Burst from source Burst from source
Display +V & -VDisplay +V & -V
625 line PAL 625 line PAL
V
U
75%
100%
mg
Mg
r
R
yl
Y
l
g
G
cy
Cy
b
B
Picture Mode display. (Video courtesy of KOIN-TV, Portland, Oregon.)
Measure Mode DGDP special position acquisition feature.
Auto
Scan
Auto
Scan
Manual
Steps 5
Manual
Steps 5
RefPacket
35.1uSec
RefPacket
35.1uSec
1st Step
39.9uSec
1st Step
39.9uSec
Last Step
55.9uSec
Last Step
55.9uSec
Measure
Cycles 7
Measure
Cycles 7
ExitExit
Measurement Location for the DGDP MeasurementMeasurement Location for the DGDP Measurement
u secu sec
5.0 10.0 15.0 20.0 25.0 30.0 35.0 40.0 45.0 50.0 55.0 60.05.0 10.0 15.0 20.0 25.0 30.0 35.0 40.0 45.0 50.0 55.0 60.0
Line = 330 (SIS mode)
3

Bar Line Time measurement.
Chrominance to Luminance Gain and Delay measurement.
MEASURE MODE
1,2
BAR LINE TIME
A
bsolute Relative
M
easurement Range Mode Mode
Accuracy Accuracy
B
ar Level (b1 or Back Porch) 300 mV to 1.4 V ± 0.5% ± 0.2%
S
ync Level 50 mV to 600 mV ± 0.5% ± 0.2%
S
ync to Bar Top 350 mV to 2 V ± 0.5% ± 0.2%
S
ync/Bar Ratio 10% to 125% ± 0.5% ± 0.2%
1
00% nominal
B
ar Tilt (Rec 569) 0 to 20% ± 0.2% ± 0.1%
L
ine Time Distortion 0 to 20% ± 0.2% ± 0.1%
(
Rec 567)
B
ar Width 10 µS to 30 µS ± 100 nS NA
BURST FREQUENCY
3
M
easurement Range Relative Mode Accuracy
B
urst Frequency Error ± 100 Hz ± 0.5 Hz
C
HROMINANCE TO LUMINANCE
A
bsolute Relative
M
easurement Range Mode Mode
A
ccuracy Accuracy
C
hrominance to Luminance Delay ± 300 ns ± 5 ns ± 1.0 ns
C
hrominance to Luminance Gain Ratio 0 to 160% ± 1.0% ± 0.1%
BOUNCE
Measurement Range Accuracy
Peak Deviation 0 to 50% ± 1%
Settling Time 0 to 10 sec ± 100 msec
CHROMINANCE NOISE
Measurement Range Absolute Mode Accuracy
AM Noise –20 to –80 dB ± 1 dB (–20 to –60 dB)
PM Noise –20 to –70 dB ± 1 dB (–20 to –60 dB)
1
All accuracies for measur
ements with averaging capabilities assume the default average of 32.
2
All accuracies for measurements with relative to reference mode assume an average of 256 was
used to cr
eate the r
efer
ence.
3
Requires a reference signal.
0.0
10.0
20.0
30.0
40.0
50.0
60.0
70.0
80.0
90.0
100.0
110.0
120.0
0.0
10.0
20.0
30.0
40.0
50.0
60.0
70.0
80.0
90.0
100.0
110.0
120.0
Bar & LineTime Wfm --> Bar & LineTime Wfm -->
1
00 % = Bar Level
1
00 % = Bar Level
Bar
32 -> 32
Bar Level = 700.6 mV
(Ref. b1)
Bar Level = 700.2 mV
(Ref. Back Porch)
Sync Level = 299.4 mV
Sync to Bar Top = 999.6 mV
Sync/Bar Ratio = 99.7 %
(100% = 3/7)
LineTime Dist. = 0.1 %
(Rec. 567)
Bar Tilt = -0.1 %
(
Rec. 569)
Bar Width = 10.0 u sec
Line = 330 (SIS mode) Line = 330 (SIS mode)
Average Average
Chroma Gain (%)Chroma Gain (%)
Chroma Delay (n sec)Chroma Delay (n sec)
8
6.0
88.0
90.0
92.0
9
4.0
96.0
98.0
100.0
102.0
104.0
106.0
108.0
110.0
112.0
114.0
-60.0 -40.0 -20.0 0.0 20.0 40.0 60.0
8
6.0
88.0
90.0
92.0
9
4.0
96.0
98.0
100.0
102.0
104.0
106.0
108.0
110.0
112.0
114.0
-60.0 -40.0 -20.0 0.0 20.0 40.0 60.0
Chrom/Lum Gain Delay Wfm --> Chrom/Lum Gain Delay Wfm --> Pulse
32 -> 32
Line = 17 (SIS mode) Line = 17 (SIS mode)
Average Average
Chroma Gain = 99.9 %
Chroma Delay = 5.7 n sec
4

Chrominance Non-Linearity measurement.
Color Bar measurement.
Luminance Level (mV )Luminance Level (mV )
Chrominance Level (mV )Chrominance Level (mV )
Chrominance Phase (deg)Chrominance Phase (deg)
Gray Gray Yellow Yellow Cyan Cyan Green Green MagentaMagenta Red Red Blue Blue Black Black
0.0
500.0
1000.0
0.0
500.0
1000.0
0.0
500.0
1000.0
0.0
500.0
1000.0
0.0
100.0
200.0
300.0
400.0
0.0
100.0
200.0
300.0
400.0
ColourBar (Sync = B) Wfm --> ColourBar (Sync = B) Wfm --> Colour Bar
32 -> 32
Line = 446 (SIS mode) Line = 446 (SIS mode)
Average Average
700.6 464.9 369.9 309.9 214.6 154.7 59.6 -0.3
0
.7
4
74.4
6
70.2
6
20.8
6
21.7
6
70.7
4
76.6
0
.6
------- 166.6 283.0 240.9 61.0 103.0 346.6 -------
M
EASURE MODE (continued)
CHROMINANCE NON-LINEARITY
4
A
bsolute Relative
M
easurement Range Mode Mode
A
ccuracy Accuracy
C
hrominance Amplitude 0 to 100% ± 0.4% ± 0.2%
C
hrominance Phase 0 to 360 deg ± 1 deg ± 0.2 deg
C
hrominance to Luminance –50 to +50% ± 0.2% ± 0.2%
I
ntermodulation
COLOR BAR
Absolute Relative
Measurement Range Mode Mode
Accuracy Accuracy
Luminance Level 0 to 700 mV ± 3.5 mV ± 0.2%
Chrominance Level 0 to 700 mV ± 1.0% of ± 0.2%
(excluding gray and black) nominal
Chrominance Phase ± 180 deg ± 0.5 deg ± 0.1 deg
DIFFERENTIAL GAIN AND PHASE
Absolute Relative
Measure
ment Range Mode M
ode
A
ccuracy Accuracy
D
ifferential Gain 0 to 100% ± 0.3% ± 0.03%
(Minimum, Maximum, and Peak)
Differential Phase 0 to 360 deg ± 0.3 deg ± 0.03 deg
(Minimum, Maximum, and Peak)
4
4
Accuracies for chr
ominance non-linearity amplitude and phase measur
ements assume an average of 256.
Differential Gain and Phase measurement.
Chrominance Amplitude Error (%) Ref = 420 mV PacketChrominance Amplitude Error (%) Ref = 420 mV Packet
Chrominance Phase Error (deg) Ref = 420 mV PacketChrominance Phase Error (deg) Ref = 420 mV Packet
C
hrominance Luminance Intermodulation (% of 700 mV)
C
hrominance Luminance Intermodulation (% of 700 mV)
1
40 mV
1
40 mV
4
20 mV
4
20 mV
7
00 mV
7
00 mV
-3.0
-2.0
-1.0
0
.0
-3.0
-2.0
-1.0
0
.0
-0.6
-0.4
-
0.2
0.0
0
.2
0
.4
-0.6
-0.4
-
0.2
0.0
0
.2
0
.4
-
0.10
-0.05
-0.00
-
0.10
-0.05
-0.00
C
hrominance Nonlinearity Wfm -->
C
hrominance Nonlinearity Wfm -->
M
od 3 Step
32 -> 32
L
ine = 331 (SIS mode)
L
ine = 331 (SIS mode)
Average Average
-2.2 0.0 -1.5
0.1 0.0 -0.2
-
0.0
-
0.1
-
0.1
Differential Gain (%)Differential Gain (%)
Differential Phase (deg)Differential Phase (deg)
1st. 1st. 2nd. 2nd. 3rd. 3rd. 4th. 4th. 5th.5th. 6th. 6th.
-0.2
0.0
0.2
0
.4
0.6
0
.8
-0.2
0.0
0.2
0
.4
0.6
0
.8
-1.4
-1.2
-1.0
-0.8
-0.6
-0.4
-0.2
0.0
0.2
0.4
-1.4
-1.2
-1.0
-0.8
-0.6
-0.4
-0.2
0.0
0.2
0.4
D
G DP (Sync = B) Wfm -->
D
G DP (Sync = B) Wfm -->
C
omposite
32 -> 32
Line = 19 (SIS mode) Line = 19 (SIS mode)
Average Average
Special Positioning is in useSpecial Positioning is in use
0.00 0.66 0.56 0.38 0.40 0.31
min = 0.00 max = 0.66 pk-pk = 0.66
0.00 -0.01 -0.18 -0.68 -0.92 -0.87
min = -0.92 max = 0.00 pk-pk = 0.92
5

Frequency Response and Group Delay measurement using Sin X/X.
Horizontal Timing measurement.
M
EASURE MODE (continued)
FREQUENCY RESPONSE AND GROUP DELAY
A
bsolute Relative
M
easurement Range Mode Mode
A
ccuracy Accuracy
F
requency Response
to 5 MHz ± 40 dB ± 1.0 dB ± 0.3 dB
to 6 MHz ± 40 dB ± 2.0 dB ± 0.6 dB
Group Delay
to 5 MHz ± 1.0 µs ± 20 ns ± 5 ns
t
o 6 MHz ± 1.0 µs ± 40 ns ± 10 ns
HORIZONTAL BLANKING
Measurement Range Absolute Mode Accuracy
Blanking Start 0.1 to 4.2 µs ± 50 ns
Blanking End 6.8 to 12.2 µs ± 50 ns
Blanking Width 6.9 to 16.4 µs ± 50 ns
INCIDENTAL CARRIER PHASE MODULATION
Measurement Range Accuracy
ICPM (requires zero Carrier Pulse 0 to 90 deg ± 1.0 deg
and the quadrature output of the
demodulator on Channel C)
JITTER
Measurement Range Absolute Mode Accuracy
Jitter (2 Field) ± 20 µs ± 10 ns
Jitter Long Time ± 20 µs ± 10 ns
H_Jitter.
HORIZONTAL TIMING
M
easurement Range Absolute Mode Accuracy
B
urst Level 80 to 600 mV ± 1%
H
orizontal Sync Rise and Fall Time 80 ns to 1 µs ± 10 ns
H
orizontal Sync Width 1 to 8 µs ± 10 ns
Burst Width 1.4 to 3 µs ± 25 ns
Sync to Burst Start 5 to 8 µs ± 25 ns
Sync Level 75 to 600 mV ± 0.5%
Amplitude (dB)Amplitude (dB)
G
roup Delay (n sec)
G
roup Delay (n sec)
(Ref. at 0.24 MHz)(Ref. at 0.24 MHz)
0
.0
0
.0
1
.0
1
.0
2
.0
2
.0
3
.0
3
.0
4
.0
4
.0
5
.0
5
.0
5
.8
5
.8
-0.8
-0.6
-0.4
-
0.2
0
.0
0
.2
0.4
0.6
-0.8
-0.6
-0.4
-
0.2
0
.0
0
.2
0.4
0.6
0
.0
0
.0
1
.0
1
.0
2
.0
2
.0
3
.0
3
.0
4
.0
4
.0
5
.0
5
.0
5
.8
5
.8
-40.0
-
30.0
-20.0
-10.0
0.0
10.0
20.0
30.0
40.0
-40.0
-
30.0
-20.0
-10.0
0.0
10.0
20.0
30.0
40.0
Group Delay & Gain (Sync = B) Wfm --> Group Delay & Gain (Sync = B) Wfm --> Sin X/X
32 -> 32
4.43 M Hz -0.2 dB
4
.43 M Hz 8 n sec
Line = 153 (SIS mode) Line = 153 (SIS mode)
Average Average
H Timing (Sync = B) H Timing (Sync = B)
32 -> 32
5.59 u sec
2.26 u sec
299.3 mV
301.0 mV
4.70 u sec
257 n sec
244 n sec
Line = 153 (SIS mode) Line = 153 (SIS mode)
Average Average
LineLine
(n sec)(n sec)
-4.0 -3.0 -2.0 -1.0 0.0 1.0 2.0 3.0-4.0 -3.0 -2.0 -1.0 0.0 1.0 2.0 3.0
FF
FF
II
II
EE
EE
LL
LL
DD
DD
11
22
77
625625
H Sync Jitter in a Frame (Sync = B) H Sync Jitter in a Frame (Sync = B)
32 -> 32
Jitter (Line 20 to 300) -- 0 n sec p-p
Average Average
6

LINE FREQUENCY
M
easurement Range Accuracy
L
ine Frequency ± 3% ± 0.1%
F
ield Frequency ± 3% ± 0.1%
LUMINANCE NON-LINEARITY
Absolute Relative
M
easurement Range Mode Mode
A
ccuracy Accuracy
L
uminance Non-Linearity 0 to 100% ± 0.4% ± 0.2%
K-factor measurement.
Luminance Non-Linearity measurement.
Luminance Non Linearity (%)Luminance Non Linearity (%)
1st. 1st. 2nd. 2nd. 3rd. 3rd. 4th. 4th. 5th.5th.
99.74
99.76
99.78
99.80
99.82
99.84
99.86
99.88
99.90
99.92
99.94
99.96
99.98
100.00
100.02
100.04
100.06
100.08
99.74
99.76
99.78
99.80
99.82
99.84
99.86
99.88
99.90
99.92
99.94
99.96
99.98
100.00
100.02
100.04
100.06
100.08
Luminance Non Linearity (Sync = B) Wfm --> Luminance Non Linearity (Sync = B) Wfm --> Composite
32 -> 32
100.0 100.0 99.9 99.8 99.9
pk-pk = 0.2
Line = 330 (SIS mode) Line = 330 (SIS mode)
Average Average
M
EASURE MODE (continued)
K
-FACTOR
M
easurement Range Absolute Mode Accuracy
2T Pulse K-Factor 0 to 10% Kf ± 0.3%
KPB –10 to +5% KPB ± 0.3%
P
ulse to Bar Ratio 10 to 125% ± 0.7%
P
ulse Half Amplitude Duration (HAD) 100 to 500 ns ± 5 ns
LEVEL METER
Measurement Range Accuracy
Level Meter 0 to 1.4 V ± 3.5 mV
MULTIBURST
5
Absolute Relative
Measurement Range Mode Mode
Accuracy Accuracy
Multiburst Flag Amplitude 0 to 700 mV ± 0.5% NA
Packets 1-5 –40 to +6 dB ± 0.1 dB ± 0.03 dB
(0.5, 1.0, 2.0, 4.0, 4.8 MHz)
Packet 6 (5.8 MHz) –40 to +6 dB ± 0.2 dB ± 0.06 dB
Multiburst measur
ement.
(dB)(dB)
(MHz)(MHz)
-0.45
-0.40
-0.35
-0.30
-0.25
-0.20
-0.15
-0.10
-0.05
0.00
0.05
0.10
0.15
0.20
0.25
0.30
0.35
0.40
0.45
0.50
-0.45
-0.40
-0.35
-0.30
-0.25
-0.20
-0.15
-0.10
-0.05
0.00
0.05
0.10
0.15
0.20
0.25
0.30
0.35
0.40
0.45
0.50
Multi Burst (Sync = B) Wfm --> Multi Burst (Sync = B) Wfm --> Multi Burst
32 -> 32
0.01
0.5
0.05
1.0
0.03
2.0
0.02
4.0
-0.02
4.8
-0.01
5.8
420.6 mVAmplitude (0 dB = Flag)
Line = 18 (SIS mode) Line = 18 (SIS mode)
Average Average
Level Meter measur
ement.
744.7
635.2
600.0
610.0
620.0
630.0
640.0
650.0
660.0
670.0
680.0
690.0
700.0
710.0
720.0
730.0
740.0
750.0
760.0
770.0
780.0
790.0
800.0
744.7
635.2
600.0
610.0
620.0
630.0
640.0
650.0
660.0
670.0
680.0
690.0
700.0
710.0
720.0
730.0
740.0
750.0
760.0
770.0
780.0
790.0
800.0
m
V
m
V
Level Meter (Sync = B) Level Meter (Sync = B)
#000
Level(b-a)
= 700.0 mV
Line = 330 (SIS mode) Line = 330 (SIS mode)
Average Off Average Off
(a) at 9.6 u sec, (b) at 17.1 u sec(a) at 9.6 u sec, (b) at 17.1 u sec
5
T
otal Har
monic Distor
tion on packets must be
≤
46 dB.
2T Pulse K Factor (Sync = B) Wfm --> 2T Pulse K Factor (Sync = B) Wfm --> Pulse & Bar
32 -> 32
CCIR-2T 5.0% K-2T = 0.4 % KF
K-PB = 0.0 % KF
PB Ratio = 100.2 %
HAD = 199.4 n sec
Line = 330 (SIS mode) Line = 330 (SIS mode)
Average Average
7

VERTICAL BLANKING
M
easurement Range Absolute Mode Accuracy
E
qualizing Pulse Width 80 ns to 1 µs ± 10 ns
B
road Pulse Width 80 ns to 1 µs ± 10 ns
V
ertical Blanking Field 1 19 to 30 lines NA
Vertical Blanking Field 2 19 to 30 lines NA
Noise Spectrum measurement.
Ve
rtical Blanking display.
M
EASURE MODE (continued)
NOISE SPECTRUM
M
easurement Range Absolute Mode Accuracy
Unweighted Signal-to-Noise –20 to –80 dB ± 0.4 dB
(
5 MHz Low Pass) (–20 to –60 dB)
±
1.0 dB
(–60 to –70 dB)
L
uminance Weighted Signal-to-Noise –20 to –80 dB ± 1.0 dB
(5 MHz Low Pass and (–20 to –60 dB)
Unified Weighting) ± 2.0 dB
(
–60 to –70 dB)
C
hrominance Weighted –20 to –80 dB ± 1.0 dB
S
ignal-to-Noise (–20 to –60 dB)
±
2.0 dB
(–60 to –70 dB)
SCH PHASE
Measurement Range Absolute Mode Accuracy
SCH Phase ± 90 deg ± 5 deg
Sync Timing ± 1 µS ± 10 nS
Burst Timing ± 180 deg ± 5 deg
Vertical Blanking Serration Pulse measurement.
Blanking
Display
Blanking
Display
Equalizer
Pulse
Equalizer
Pulse
Broad
Pulse Sep
Broad
Pulse Sep
V Sync
Display
V Sync
Display
Average
Num 32
Average
Num 32
RescaleRescale
Timing DisplayTiming Display
V
ertical Blanking (Sync = B)
V
ertical Blanking (Sync = B)
4.70 u sec
258 n sec
243 n sec
Average Off Average Off
SCH Phase measur
ement.
Source
Only
Source
Only
Source and
Chan. A
Source and
Chan. A
Source and
Chan. B
Source and
Chan. B
Source and
Chan. C
Source and
Chan. C
180
170
160
150
140
130
120
110
100
90
80
70
60
50
40
30
20
10
0
-10
-20
-30
-40
-50
-60
-70
-80
-90
-100
-110
-120
-130
-140
-150
-160
-170
SCH Phase MeasurementSCH Phase Measurement 625 line PAL 625 line PAL Ch A SCH -3.2 deg
Ch B SCH -1.7 deg
Rel Burst -29.9 deg
Rel Sync 19 nsec
Color Frame Derived
from Channel B SCH
Sync Relative Timing (nsec)
1000-1000 100-100 10-10 0
Burst Relative Phase (deg)
180-180 30-30 10-10 3-3 0
Average 32 -> 32
Amplitude (0 dB = 700 mV p-p)Amplitude (0 dB = 700 mV p-p)
(MHz)(MHz)
-84.0
-82.0
-80.0
-78.0
-76.0
-74.0
-72.0
-70.0
-68.0
-66.0
-64.0
-62.0
-60.0
1.0 2.0 3.0 4.0 5.0 6.0
-84.0
-82.0
-80.0
-78.0
-76.0
-74.0
-72.0
-70.0
-68.0
-66.0
-64.0
-62.0
-60.0
1.0 2.0 3.0 4.0 5.0 6.0
Noise Spectrum (Sync = B) Wfm --> Noise Spectrum (Sync = B) Wfm --> Pedestal
32 -> 32
Cursor1 3.71 MHz(+-34 kHz Band) -78.4 dB p-p
Cursor2 5.58 MHz(1.87 MHz above) -79.7 dB p-p ( -1.3 dB Diff)
Noise Area in Cursors -72.0 dB rms
Noise Level = -66.2 dB rms
Band width 100kHz to Full Band width 100kHz to Full
Line = 12 (SIS mode) Line = 12 (SIS mode)
Average Average
8
Blanking
Display
Blanking
Display
Equalizer
Pulse
Equalizer
Pulse
Broad
Pulse Sep
Broad
Pulse Sep
V Sync
Display
V Sync
Display
Full DisplayFull Display
F1F1
F2F2
F3F3
F4F4
Vertical Blanking (Sync = B) Vertical Blanking (Sync = B)
Line = 12 (SIS mode) Line = 12 (SIS mode) Line = 12 (SIS mode)
Bruch Sequence OK
Line = 12 (SIS mode)

AMPLITUDE AND PHASE MEASUREMENTS (continued)
M
easurement Range Accuracy ITS Element Standard
D
ifferential Gain 0 to +100% ± 0.3% D2 CCIR Rec. 569
(
Peak and p-p) (0% nominal)
D
ifferential Phase 0 to 360 deg ± 0.3 deg D2 CCIR Rec. 569
(Peak and p-p) (0 deg nominal)
FREQUENCY RESPONSE MEASUREMENTS
M
easurement Range Accuracy ITS Element Standard
M
ultiburst Flag 20 to 130% of bar ± 0.5% C1 CCIR Rec. 567
A
mplitude (60% nominal)
M
ultiburst Amplitude 0 to 200% of flag ± 1.5% of C2 CCIR Rec. 567
(100% nominal) flag (± 2.5%
of 5.8 MHz
packet)
WAVEFORM DISTORTION MEASUREMENTS
Measurement Range Accuracy ITS Element Standard
Baseline Distortion 50% of bar ± 0.3% B1 CCIR Rec. 569
2
T Pulse/Bar +25 to –90% ± 0.5% B1 CCIR Rec. 569
Ratio Error (0% nominal)
2T Pulse K-factor 0 to 10% Kf ± 0.3% Kf B1 CCIR Rec. 569
(
0% Kf nominal)
B
ar Tilt 0 to 40% 0.2% B2 CCIR Rec. 567
(End Points) (0%nominal)
Bar Ti
lt 0 to +40% ± 0.2% B2 CCIR Rec. 567
(Peak-to-Peak) (0% nominal)
Line Time Distortion 0 to 40% of bar ± 0.2% B2 CCIR Rec. 560
Bar Tilt (Rec 569) 0 to 40% of bar ± 0.2% B2 CCIR Rec. 569
Field Time Distortion 0 to 35% ± 0.5% Field Square
Wave
Chrominance-Luminance ± 50% ± 0.2% G1 or G2 CCIR Rec. 569
Intermodulation (0% nominal)
Luminance Non-linear 0 to 50% ± 0.4% D1 CCIR Rec. 569
Distortion (0% nominal)
LOW FREQUENCY ERROR
Measur
ement Range Accuracy Standard
Low Frequency Error 0% to 25% ± 0.8% CCIR Rec. 569
(Repor
ted as: CCIR LF Er
r
or (0% nominal)
50-550 Hz LF Error
10-1000 Hz LF Error)
NOISE MEASUREMENTS
Measurement
Range Accuracy Standard
Unweighted SNR
26 to 60 dB
±
1.0 dB
Measur
ed on one quiet
(567) 61 to 70 dB ± 2.0 dB line per CCIR Rec. 567
Luminance Weighted SNR 26 to 60 dB ± 1.0 dB Measured on one quiet
(567)
61 to 70 dB
±
2.0 dB line per CCIR Rec. 567
Chrominance Weighted SNR 26 to 60 dB ± 1.0 dB Measured on one quiet
61 to 70 dB ± 2.0 dB line per CCIR Rep. 637-2
Periodic SNR
26 to 60 dB ± 1.0 dB Measured on one quiet
61 to 70 dB ± 2.0 dB line per CCIR Rep. 637-2
Unweighted SNR 26 to 60dB ± 1.0 dB Measured on one quiet
(569) 61 to 70 dB ± 2.0 dB line per CCIR Rec. 569
Luminance W
eighted SNR
26 to 60 dB ± 1.0 dB Measured on one quiet
(569)
61 tp 70 dB
±
2.0 dB
line per CCIR Rec. 569
INCIDENT
AL CARRIER PHASE MODULATION
Measur
ement Range Accuracy
ICPM (requires zero Carrier Pulse and the quadrature 0 to 30 deg. ± 1.0 deg.
output of the demodulator on Channel C)
A
UTO MODE
LINE BLANKING TIMING MEASUREMENTS
T
hese measurements are all made on samples acquired from the live signal area. With
t
he exception of Line Sync Rise Time and Fall Time, these measurements are made in
a
ccordance with CCIR Report 624-1.
M
easurement Range Accuracy
C
olor Burst Duration 6 to 13 cycles (10 cycles nominal) ± 0.1 cycle
F
ront Porch Duration 0.5 to 3 µs (1.5 µsnominal) ± 20 ns
Line Blanking 9 to 16 µs (12 µsnominal) ± 50 ns
Line Sync Rise and Fall Times 120 to 300 ns ±15 ns
3
00 ns to 1 µs ± 30 ns
Line Sync 1.4 to 6.6 µs (4.7 µs nominal) ± 10 ns
Sync-to-Start of Burst 2.2 to 8 µs (5.6 µs nominal) ± 20 ns
Burst Duration 1.4 to 3 µs ± 25 ns
SCH Phase ± 90 deg ± 5 deg
FIELD BLANKING TIMING MEASUREMENTS
M
easurement Range Accuracy
E
qualizing Pulse Duration 1.4 to 20 µs (2.35 µs nominal) ± 10 ns
Broad Pulse Separation 1.4 to 20 µs (4.7 µs nominal) ± 10 ns
OTHER TIMING MEASUREMENTS
Measure
ment Range Accuracy ITS Element Standard
B
ar Rise Time 120 to 300 ns ± 20 ns B2 Measured from
0.3 to 1.0 µs ± 30 ns 10% to 90%
points
AMPLITUDE AND PHASE MEASUREMENTS
Measurement Range Accuracy ITS Element Standard
Average Picture Level 0 to 200% ± 3%
Sync Amplitude Error +100 to –50% ± 0.5% Live picture
(300 mV nominal) of nominal area CCIR Rec. 569
Sync Amplitude Error +100 to –50% ± 0.3% Last broad CCIR Rec. 569
(with Sound-in-Sync) (300 mV nominal) of nominal pulse in field
Burst Amplitude Error +80 to –50% ± 1.0% Live picture CCIR Rec. 569
(300 mV nominal) area
Chrominance Reference –80 to +50% ± 1.0% D2 CCIR Rec. 569
Amplitude Error (300 mV nominal)
Luminance Bar
+30 to –70% ±
0.3% B2 CCIR Rec. 569
Amplitude Error (700 mV nominal)
Luminance Bar 200 to 900 mV ± 2.2 mV B2
Amplitude
Luminance Bar 0 to 90% of ± 0.3% B2 and
Amplitude Maximum Carrier Zero Carrier
(% of carrier)
Residual Carrier 0 to 90% of ± 0.3% B2 and
(Bar Top) Maximum Carrier Zero Carrier
Blanking Level 0 to 90% of ± 0.2% Live picture CCIR Rep. 624-1
Zer
o Carrier area
Chr
ominance-Luminance
±
75% of bar
±
1.0% G1 or G2 CCIR Rec. 569
Gain Inequality amplitude
Chrominance-Luminance ± 300 ns ± 5 ns F or G1 CCIR Rec. 569
Delay Inequality
(0 ns nominal)
or G2
Sync/Bar Rel. 3/7 20 to 110% ± 0.5% B2 CCIR Rec. 569
Sync to Bar Top 0.5 to 2 V ± 0.5% B2 CCIR Rec. 569
C/L Gn Er
r (using
± 50% ± 1% F
modulated Pulse)
Sync Amplitude 75 to 600 mV ± 1.5 mV
Burst Amplitude 75 to 600 mV ± 3 mV
Burst Amplitude
±
2%
Difference
Burst Quadrature Error ± 1 deg
9

Unified Unweighted filter response curve per CCIR Recommendation 567.
0
–55
08
M
Hz
d
BV
–5
–
10
–
15
–20
–25
–30
–35
–40
–
45
–50
1234567
U
nified Luminance weighted filter response curve per CCIR Recommendation 567.
0
–
14
05
MHz
dBV
.5 1 1.5 2 3 4
–12
–
10
–8
–
6
–4
–
2
2.5 3.5 4.5
Chrominance Weighting filter response curve per CCIR Report 637-2.
0
–
5
–
10
–15
–20
–25
–30
–35
–40
0123456
FREQUENCY (MHz)
RELATIVE
INSERTION LOSS (dB)
10

Measur
ement r
esults are displayed in an easy-to-read format indicating the time, signal source, measurement, and whether the measured value exceeded caution (*) or alarm (**) limits.
11
VM700T Video Measurement Set
C
hannel A System Default 07-Aug-96 19:06:58
VM700T Video Measurement Set
System Default Violated Limits
Lower Upper
Source ID ---- Not Found
Luminance Bar Ampl 702.8 mV
Luminance Bar Ampl ------ % Carr ** 55.0 73.0 No Zero-C Pulse
Lum Bar Ampl Err 0.4 %
Line Time Distortion 0.1 % Bar
Bar Tilt (Rec 569) -0.2 % Bar
Bar Rise Time 194.5 ns
Baseline Distortion -0.1 % Bar
Blanking Level ------ % Carr ** 69.0 79.0 No Zero-C Pulse
Sync/Bar (Rel 3/7) 100.3 %
Sync to Bar Top 1004.4 mV
Pulse/Bar Ratio Err 0.1 % Bar
2T Pulse K-factor 0.3 % Kf
C/L Gn Err (Mod Bar) 0.4 % Bar
Chr/Lum Delay Ineq 4.8 ns
C/L Gn Err (Mod Pls) 0.8 % Bar
Lum. Nonlin. Dist. 0.2 % At 43% APL
Chrom Ref Ampl Err -0.1 %
Pk-Pk Diff Gain 0.2 % At 43% APL
Peak Diff Gain 0.1 % At 43% APL
Pk-Pk Diff Phase
0.8 Deg At 43% APL
Peak Diff Phase 0.8 Deg At 43% APL
Chr/Lum Intermod -0.0 % Bar At 43% APL
Sync Amplitude 302.1 mV
Sync Ampl Error 0.7 %
Residual Carrier ------ % Carr ** 7.5 15.0 No Zero-C Pulse
Sync-to-Burst Start 5.59 us
Burst Duration 2.26 us
Burst Duration 10.0 Cycles
Burst Amplitude 300.8 mV
Burst Ampl Error 0.3 %
Burst Ampl Diff 0.0 %
Burst Quad Error -0.1 Deg
SCH Phase -2.7 Deg
Sync Duration 4.70 us
Sync Rise Time 254.1 ns
Sync Fall Time 241.9 ns
Front Porch 1.73 us
Line Blanking 12.29 us
Broad Pulse Sep 4.70 us
Equalizing Pulse 2.35 us
Multiburst Flag 60.0 % Bar
Multiburst Flag
422.0 mV
MB Packet #1 100.2 % Flag
MB Packet #2 100.6 % Flag
MB Packet #3 101.0 % Flag
MB Packet #4 100.1 % Flag
MB Packet #5 100.0 % Flag
MB Packet #6 100.4 % Flag
CCIR LF Error
0.4 % Bar
50-550 Hz LF Error
0.6 % Bar
10-1000 Hz LF Error
0.3
% Bar
S/N Unweighted (567)
67.9
dB
S/N Lum-wgtd (567) 75.3 dB
S/N Chr-wgtd 72.5 dB
S/N Periodic ------ dB ** 40.0 ------ Random >> Periodic
S/N Unweighted (569) 68.8 dB
S/N Lum-wgtd (569) 76.9 dB
S/N.2 Unwgtd (567) 67.8 dB
S/N.2 Lum-wgtd (567) 73.6 dB
S/N.2 Chr-wgtd
72.3
dB
S/N.2 Unwgtd (569) 68.4 dB
S/N.2 Lum-wgtd (569)
76.3
dB
ICPM (Absolute)
------
Deg
**
-20.0
20.0 No Zero-C Pulse
ICPM (Rel Blanking) ------ Deg ** -20.0 20.0 No Zero-C Pulse
Field Time Dist ------ % ** -2.0 2.0 Not Found

Measurement methods
The following paragraphs specify
the methods for each Option 11
measurement. Where appropriate,
reference is made to the relevant
CCIR recommendation.
Line blanking timing measurements
Color Burst Duration: Measured
between the half-amplitude
points of the burst chrominance
envelope. Result expressed as
the number of cycles between
the half-amplitude points. See
duration “h’
’ in wavefor
m
diagram. CCIR Report 624-1.
Front Porch Duration: Measured
from the half-amplitude point
between peak white-level and
blanking to the half-amplitude
point of the leading edge of sync.
See duration “c’
’ in wavefor
m
diagram. CCIR Report 624-1.
L
ine Blanking Interval:
M
ea-
sured from the half-amplitude
point between peak white-level
and blanking at the front
p
orch to the half-amplitude
point between blanking-level
and peak white level at the
back porch. See duration “a’’
in waveform diagram. CCIR
R
eport 624-1.
Line Sync Rise and Fall Time
(
Build-up Times):
M
easured
between the 10% point and
the 90% point of the line-syn-
chronizing pulse leading edge
(Rise Time) and trailing edge
(Fall Time).
Line Sync Width: Measured
between the half-amplitude
points on the leading edge and
trailing edge of sync. See dura-
tion “d’
’ in waveform diagram.
CCIR Report 624-1.
Sync-to-Start of Burst: Mea-
sured from the half-amplitude
point of the leading edge of
sync to the half-amplitude
point of the leading edge of the
burst chrominance envelope.
See duration “g’’ in waveform
diagram. CCIR Report624-1.
Field blanking timing measurements
Equalizing Pulse Duration:
Measured between the
half-amplitude points of the
leading edge and trailing edge
of the equalizing pulse. See
duration “p’’ in waveform dia-
gram. CCIR Report 624-1,
Figure 2-1 (a), (b), and (c).
Broad Pulse Duration:
Measured between the
half-amplitude points of the
leading edge and trailing
edge of the br
oad pulse. See
duration “q’’ in waveform
diagram. CCIR Report 624-1,
Figur
e 2-1 (a), (b), and (c).
L
ine Blanking Timing Waveform Measurements.
Field Blanking Timing Waveform Measurements.
12

Other timing measurements
B
ar Rise Time:
M
easured
between the 10% and 90%
points on the leading edge of
bar. See element B2.
A
mplitude and phase measurements
Sync Amplitude Error:
Measured as the difference
b
etween the sampled sync
pulse amplitude and a nominal
300 mV amplitude. Result
expressed as a % of the nominal
3
00 mV. Sign is positive if the
s
ampled sync pulse amplitude
is greater than 300 mV.
Burst Amplitude Error:
Measured as the difference
between the sampled peak-to-
peak amplitude at the center of
burst and a nominal 300 mV
amplitude. Result expressed as
a % of the nominal 300 mV
amplitude. Sign is positive if
the sampled peak-to-peak burst
amplitude exceeds 300 mV.
Chrominance Reference
Amplitude Error:
Measured as
the difference between the sam-
pled peak-to-peak amplitude of
the blanking-level chrominance
packet and the normalized
value (0.4 of the measured bar
amplitude). Result expressed as
% of the normalized value. Sign
is positive if the sampled peak-
to-peak amplitude exceeds 280
mV. See element D2 and CCIR
Recommendation 569.
Luminance Bar Amplitude
Error:
Measured as the % devi-
ation of the sampled bar ampli-
tude from a nominal value of
700 mV. Sign is positive if the
sampled bar amplitude exceeds
700 mV. See element B2 and
CCIR Recommendation 569.
Luminance Bar Amplitude:
The absolute amplitude of sam-
pled bar. Result expressed as
mV and % of Carrier (if Carrier
is present). See element B2.
Bar Tilt Error: Measured as
the maximum departure of the
bar top from the sampled bar
amplitude at bar center, ex-
cluding the bar portion one
microsecond past the bar leading
edge half-amplitude point and
one microsecond before the bar
trailing edge half-amplitude
point. The sign of the difference
is always positive. Result
expressed as a % of sampled bar
amplitude. See element B2 and
CCIR Recommendation 567.
Blanking Level: Measured as
the mean level over 32 sampled
lines of 16 samples center
ed
around the back porch. Result
expr
essed as % of Car
rier. Not
measured if Carrier not present
in the vertical interval.
2T Pulse K-factor: Measured as
the greatest weighted amplitude
of a positive-going or negative-
going echo-term half-wave
which is within one microsec-
ond before the 2T pulse leading
edge half-amplitude point or
within one microsecond after
the 2T pulse trailing edge
half-amplitude point. Result
expressed as a K-factor, which
is the ratio of the weighted
amplitude of the echo-term
half-wave to the sampled
amplitude of the 2T pulse.
The weighting is based on the
graticule shown in Figure 29a
of CCIR Recommendation 567.
See element B1.
Elements B1 and B2 (CCIR Recommendation 567).
13

C/L Gain Inequality: Measured
as the difference between the
sampled peak-to-peak ampli-
tude of the 700 mV (nominal)
chrominance packet (G1 or G2)
and the sampled amplitude of
the luminance bar (also nomi-
nally 700 mV). Result expressed
as a % of sampled bar amplitude.
Sign is positive if the chromi-
nance amplitude is greater than
the luminance amplitude. See
element G1 or G2 and CCIR
Recommendation 569.
C/L Delay Inequality: Measured
as the time-difference between
the 10T or 20T composite pulse
chrominance component
center and the composite
pulse luminance component
center. Result expressed in
nanoseconds. The sign of the
result is positive if the
chrominance component lags
the luminance component.
See element F and CCIR
Recommendation 569.
C/L Intermodulation: Measured
on a 350 mV pedestal, part of
which has had chr
ominance
packet superimposed and part
of which has not. The result is
the dif
fer
ence between the
pedestal level under the
chrominance packet after
the chrominance has been
filtered out and the pedestal
level where no chrominance
pedestal was superimposed.
Result expressed as a % of
sampled bar amplitude. Sign
is positive if the level of the
pedestal which was under
the chrominance is greater
than the other level. See
e
lement G1 or G2 and CCIR
Recommendation 569.
Differential Gain: Measured
as peak-to-peak differential
gain. The 5-riser staircase
chrominance packet with the
greatest peak-to-peak amplitude
i
s found and the ratio of that
amplitude to the peak-to-peak
amplitude of the blanking
level chrominance packet is
determined and subtracted
from unity. A similar ratio is
determined using the packet
with the least peak-to-peak
amplitude and that ratio is
subtracted from unity. The
measurement result is the
sum of the two differences.
See element D2 and CCIR
Recommendation 569.
Differential Phase: Measured
as peak-to-peak differential
phase. The maximum phase
difference (absolute value)
between a 5-riser staircase
chrominance packet and the
blanking-level chrominance
packet is determined. Likewise,
the minimum phase difference
(absolute value) is determined.
The measurement result is the
sum of these two phase differ-
ences and is expressed in
degrees. See element D2 and
CCIR Recommendation 569.
Luminance Non-linear
Distortion:
Measured by com-
paring the differences between
adjacent pairs of the six lumi-
nance levels that make up the
5-riser staircase. The measure-
ment result is the largest %
deviation in adjacent step sizes.
The sign is always positive.
See element D1 and CCIR
Recommendation 569.
Element F, G1, and G2 (CCIR Recommendation 567).
Element D1 and D2 (CCIR Recommendation 569).
14

Frequency response measurements
M
ultiburst Flag Amplitude:
Measured from the center point
of the flag top to the ensuing
bottom of the flag. Result
e
xpressed as % of sampled bar
a
mplitude. See element C1 and
CCIR Recommendation 567.
M
ultiburst Amplitude (five
packets):
Measured as the
peak-to-peak amplitude of each
of the first five multiburst
p
ackets. The peak-to-peak
a
mplitude is measured over a
4.5 µsec window at the center
of the first two packets, and
over a 1.13 µsec window at the
center of the next three packets.
The last packet is not measured.
Results expressed as % of
sampled flag amplitude. See
elements C1 and C2 and CCIR
Recommendation 567.
Linear waveform distortion
measurements
Baseline Distortion: Measured
as the difference between the
signal level 400 nanoseconds
after the half-amplitude point
of the trailing edge of the bar,
and the signal level at blanking
reference. The signal is first
band-limited to 3.3 MHz. Result
expressed as a % of sampled
bar amplitude. Sign is positive
if level nearest bar is highest.
See CCIR Recommendation 569
(paragraph 2.4) and Figure 1.
2T Pulse/Bar Ratio Error: Meas-
ured as the difference between
the sampled amplitude of the
2T pulse and the sampled bar
amplitude. The sign is positive
if the 2T pulse amplitude is
greater. Result expressed as a
% of sampled bar amplitude.
See elements B1 and B2 and
CCIR Recommendation 569.
Low frequency error
Low Frequency Error: Measured
as the peak-to-peak amplitude
of the most extreme sampled
fluctuations from black-level
that are in the frequency band
between 10 Hz and 2 kHz.
Expressed as a % of sampled bar.
When ordering, please use the nomenclature given here. The standard instrument is shipped as a rack mount product.
Included Accessories
Instruction manual; 75 Ω terminators (3) 011-0102-00; power cord.
Options
Option 01 — NTSC Measurements
Option 01/11 — Dual Standard Measurements
Option 20 — Teletext Measurements
Option 21 — Camera Measurements
Option 30 — Component Measurements
Option 40 — Audio Measurement Module
Option 41 — 6 Channel Audio Measurement Module
Option 42 — Audio to Video Delay Measurement
Option 48 — GPIB Inter
face
Option 1C — Cabinet Version
Option 1G — Echo/Rounding Measurements
Option 1P — Printer
Option 1Z — Pr
obe Adapter (067-1429-00)
Option 3Z — Probe Adapter (3 each of 067-1429-00)
VM700T Software Utilities
VMBKUP — VM700T Backup Utility
VMREMGR — Remote Graphics Softwar
e for the VM700T
VMT — VM700T Remote Contr
ol Software
Optional Accessories
VM7FC1 — Field installable conversion kit to conver
t rackmount unit to cabinet.
VM7FR1 — Field installable conversion kit to conver
t cabinet to rackmount unit.
Ordering
Information
VM700T
Option 11
PAL Video
Measurement Set.
Elements C1 and C2 (CCIR Recommendation 569).
15

Contact Tektronix:
A
SEAN / Australasia / Pakistan
(
65) 6356 3900
A
ustria
+
41 52 675 3777
B
alkan, Israel, South Africa and other ISE Countries
+
41 52 675 3777
B
elgium
0
7 81 60166
B
razil & South America
5
5 (11) 3741-8360
Canada 1 (800) 661-5625
Central East Europe, Ukraine and Baltics +41 52 675 3777
Central Europe & Greece +41 52 675 3777
Denmark +45 80 88 1401
Finland +41 52 675 3777
F
rance & North Africa
+
33 (0) 1 69 86 81 81
G
ermany
+
49 (221) 94 77 400
H
ong Kong
(
852) 2585-6688
I
ndia
(
91) 80-22275577
I
taly
+
39 (02) 25086 1
J
apan
8
1 (3) 6714-3010
L
uxembourg
+
44 (0) 1344 392400
M
exico, Central America & Caribbean
5
2 (55) 56666-333
M
iddle East, Asia and North Africa
+
41 52 675 3777
T
he Netherlands
0
90 02 021797
N
orway
8
00 16098
P
eople’s Republic of China
8
6 (10) 6235 1230
Poland +41 52 675 3777
Portugal 80 08 12370
Republic of Korea 82 (2) 528-5299
Russia & CIS 7 095 775 1064
South Africa +27 11 254 8360
S
pain
(
+34) 901 988 054
S
weden
0
20 08 80371
Switzerland +41 52 675 3777
Taiwan 886 (2) 2722-9622
United Kingdom & Eire +44 (0) 1344 392400
USA 1 (800) 426-2200
For other areas contact Tektronix, Inc. at: 1 (503) 627-7111
Last Updated June 15 2005
For Further Inf
ormation
Tektronix maintains a comprehensive, constantly expanding collection
of application notes, technical briefs and other resources to help engi-
neers working on the cutting edge of technology. Please visit
www.tek-
tr
onix.com
Copyright © 2005, Tektronix, Inc. All rights reserved. Tektronix products are covered by U.S. and for-
eign
patents, issued and pending. Information in this publication supersedes that in all pr
eviously
published material. Specification and price change privileges reserved. TEKTRONIX and TEK are
registered trademarks of Tektronix, Inc. All other trade names referenced are the service marks,
trademarks or registered trademarks of their respective companies.
11/05 FLG/WOW
25W-11140-1
/