Page is loading ...

APOGEE INSTRUMENTS, INC. | 721 WEST 1800 NORTH, LOGAN, UTAH 84321, USA
TEL: (435) 792-4700 | FAX: (435) 787-8268 | WEB: APOGEEINSTRUMENTS.COM
Copyright © 2023 Apogee Instruments, Inc.
OWNER’S MANUAL
QUANTUM SENSOR
Model SQ-522
Rev: 17-Oct-2023

TABLE OF CONTENTS
Owner’s Manual ............................................................................................................................................................ 1
Certificates of Compliance ..................................................................................................................................... 3
Introduction ........................................................................................................................................................... 5
Sensor Models ....................................................................................................................................................... 6
Specifications ......................................................................................................................................................... 7
Deployment and Installation ............................................................................................................................... 10
Cable Connectors ................................................................................................................................................. 11
Operation and Measurement .............................................................................................................................. 11
Maintenance and Recalibration .......................................................................................................................... 21
Troubleshooting and Customer Support ............................................................................................................. 23
Return and Warranty Policy ................................................................................................................................ 24

CERTIFICATE OF COMPLIANCE
EU Declaration of Conformity
This declaration of conformity is issued under the sole responsibility of the manufacturer:
Apogee Instruments, Inc.
721 W 1800 N
Logan, Utah 84321
USA
for the following product(s):
Models: SQ-522
Type: Quantum Sensor
The object of the declaration described above is in conformity with the relevant Union harmonization legislation:
2014/30/EU Electromagnetic Compatibility (EMC) Directive
2011/65/EU Restriction of Hazardous Substances (RoHS 2) Directive
2015/863/EU Amending Annex II to Directive 2011/65/EU (RoHS 3)
Standards referenced during compliance assessment:
EN 61326-1:2013 Electrical equipment for measurement, control, and laboratory use – EMC requirements
EN 63000:2018 Technical documentation for the assessment of electrical and electronic products with
respect to the restriction of hazardous substances
Please be advised that based on the information available to us from our raw material suppliers, the products
manufactured by us do not contain, as intentional additives, any of the restricted materials including lead (see
note below), mercury, cadmium, hexavalent chromium, polybrominated biphenyls (PBB), polybrominated
diphenyls (PBDE), bis (2-ethylhexyl) phthalate (DEHP), butyl benzyl phthalate (BBP), dibutyl phthalate (DBP), and
diisobutyl phthalate (DIBP). However, please note that articles containing greater than 0.1 % lead concentration
are RoHS 3 compliant using exemption 6c.
Further note that Apogee Instruments does not specifically run any analysis on our raw materials or end products
for the presence of these substances, but we rely on the information provided to us by our material suppliers.
Signed for and on behalf of:
Apogee Instruments, October 2023
Bruce Bugbee
President
Apogee Instruments, Inc.

CERTIFICATE OF COMPLIANCE
UK Declaration of Conformity
This declaration of conformity is issued under the sole responsibility of the manufacturer:
Apogee Instruments, Inc.
721 W 1800 N
Logan, Utah 84321
USA
for the following product(s):
Models: SQ-522
Type: Quantum Sensor
The object of the declaration described above is in conformity with the relevant UK Statutory Instruments and
their amendments:
2016 No. 1091 The Electromagnetic Compatibility Regulations 2016
2012 No. 3032 The Restriction of the Use of Certain Hazardous Substances in Electrical and Electronic
Equipment Regulations 2012
Standards referenced during compliance assessment:
BS EN 61326-1:2013 Electrical equipment for measurement, control, and laboratory use – EMC requirements
BS EN 63000:2018 Technical documentation for the assessment of electrical and electronic products with
respect to the restriction of hazardous substances
Please be advised that based on the information available to us from our raw material suppliers, the products
manufactured by us do not contain, as intentional additives, any of the restricted materials including lead (see
note below), mercury, cadmium, hexavalent chromium, polybrominated biphenyls (PBB), polybrominated
diphenyls (PBDE), bis (2-ethylhexyl) phthalate (DEHP), butyl benzyl phthalate (BBP), dibutyl phthalate (DBP), and
diisobutyl phthalate (DIBP). However, please note that articles containing greater than 0.1 % lead concentration
are RoHS 3 compliant using exemption 6c.
Further note that Apogee Instruments does not specifically run any analysis on our raw materials or end products
for the presence of these substances, but we rely on the information provided to us by our material suppliers.
Signed for and on behalf of:
Apogee Instruments, October 2023
Bruce Bugbee
President
Apogee Instruments, Inc.

INTRODUCTION
Radiation that drives photosynthesis is called photosynthetically active radiation (PAR) and is typically defined as
total radiation across a range of 400 to 700 nm. PAR is almost universally quantified as photosynthetic photon flux
density (PPFD), the sum of photons from 400 to 700 nm in units of micromoles per square meter per second (µmol
m-2 s-1, equal to microEinsteins m-2 s-1). While microEinsteins and micromoles are equal (one Einstein = one mole of
photons), the Einstein is not an SI unit, so expressing PPFD as µmol m-2 s-1 is preferred. Daily total PPFD is typically
reported in units of moles of photons per square meter per day (mol m-2 d-1) and is often called daily light integral
(DLI).
The acronym PPF is also used and refers to the photosynthetic photon flux. The acronyms PPF and PPFD refer to
the same variable. Both terms are used because there is not a universal definition of the term flux. Flux is
sometimes defined as per unit area per unit time and sometimes defined as per unit time only. PPFD is used in this
manual.
Sensors that measure PPFD are often called quantum sensors due to the quantized nature of radiation. A quantum
refers to the minimum quantity of radiation, one photon, involved in physical interactions (e.g., absorption by
photosynthetic pigments). In other words, one photon is a single quantum of radiation.
Typical applications of quantum sensors include measurement of incident PPFD on plant canopies in outdoor
environments or in greenhouses and growth chambers, and reflected or under-canopy (transmitted) PPFD
measurement in the same environments.
Apogee Instruments SQ series quantum sensors consist of a cast acrylic diffuser (filter), photodiode, and signal
processing circuitry mounted in an anodized aluminum housing, and a cable to connect the sensor to a
measurement device. SQ-500 series quantum sensors are designed for continuous PPFD measurement in indoor or
outdoor environments. The SQ-522 sensors output a digital signal using Modbus RTU protocol over RS-232 or RS-
485.

SENSOR MODELS
This manual covers the Modbus RTU communication protocol, full-spectrum quantum sensor model SQ-522 (in
bold below). Additional models are covered in their respective manuals.
Model
Signal
SQ-522
Modbus
SQ-500
Self-powered
SQ-512
Amplified 0 to 2.5 V signal output
SQ-515
Amplified 0 to 5 V signal output
SQ-520
USB
SQ-521
SDI-12
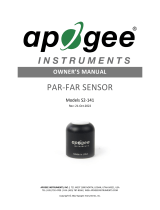
A sensor’s model number and serial number are
located on the bottom of the sensor. If you need
the manufacturing date of your sensor, please
contact Apogee Instruments with the serial
number of your sensor.

SPECIFICATIONS
Calibration Traceability
Apogee Instruments SQ-500 series quantum sensors are calibrated through side-by-side comparison to the mean
of four transfer standard quantum sensors under a reference lamp. The reference quantum sensors are
recalibrated with a quartz halogen lamp traceable to the National Institute of Standards and Technology (NIST).
SQ-522
Input Voltage
5.5 to 24 V DC
Average Max Current Draw
RS-232 37 mA;
RS-485 quiescent 37 mA, active 42 mA
Calibration Factor
Custom for each sensor and stored in the firmware
Calibration Uncertainty
± 5 % (see calibration Traceability below)
Measurement Repeatability
Less than 1 % (up to 4000 µmol m-2 s-1)
Long-term Drift
(Non-stability)
Less than 2 % per year
Non-linearity
Less than 1 % (up to 4000 µmol m-2 s-1)
Field of View
180°
Spectral Range
389 to 692 nm ± 5 nm (wavelengths where response is greater than 50 %)
Spectral Selectivity
Less than 10 % from 412 to 682 ± 5 nm (see Spectral Response below)
Directional (Cosine) Response
± 2 % at 45° zenith angle, ± 5 % at 75° zenith angle (see Directional Response below)
Azimuth Error
Less than 0.5 %
Tilt Error
Less than 0.5 %
Temperature Response
-0.11 ± 0.04 % per C (see Temperature Response below)
Uncertainty in Daily Total
Less than 5 %
Detector
Blue-enhanced silicon photodiode
Housing
Anodized aluminum body with acrylic diffuser
IP Rating
IP68
Operating Environment
-40 to 70 C; 0 to 100 % relative humidity; can be submerged in water up to depths of 30 m
Dimensions
30.5 mm diameter, 37 mm height
Mass (with 5 m of cable)
140 g
Cable
5 m of shielded, twisted-pair wire; TPR jacket (high water resistance, high UV stability,
flexibility in cold conditions); pigtail lead wires; stainless steel (316), M8 connector

Spectral Response
Temperature Response
Mean temperature response of ten SQ-500
series quantum sensors (errors bars
represent two standard deviations above
and below mean). Temperature response
measurements were made at 10 C intervals
across a temperature range of
approximately -10 to 40 C in a temperature
controlled chamber under a fixed, broad
spectrum, electric lamp. At each
temperature set point, a
spectroradiometer was used to measure
light intensity from the lamp and all
quantum sensors were compared to the
spectroradiometer. The spectroradiometer
was mounted external to the temperature
control chamber and remained at room
temperature during the experiment.
Mean spectral response measurements
of six replicate Apogee SQ-100 (original)
and SQ-500 (full-spectrum) series
quantum sensors. Spectral response
measurements were made at 10 nm
increments across a wavelength range of
300 to 800 nm with a monochromator
and an attached electric light source.
Measured spectral data from each
quantum sensor were normalized by the
measured spectral response of the
monochromator/electric light
combination, which was measured with a
spectroradiometer.

Cosine Response
Mean directional (cosine) response of
seven apogee SQ-500 series quantum
sensors. Directional response
measurements were made on the
rooftop of the Apogee building in
Logan, Utah. Directional response was
calculated as the relative difference of
SQ-500 quantum sensors from the
mean of replicate reference quantum
sensors (LI-COR models LI-190 and LI-
190R, Kipp & Zonen model PQS 1). Data
were also collected in the laboratory
using a reference lamp and positioning
the sensor at varying angles.
Directional (cosine) response is defined as the
measurement error at a specific angle of radiation
incidence. Error for Apogee SQ-500 series quantum
sensors is approximately ± 2 % and ± 5 % at solar
zenith angles of 45° and 75°, respectively.

Important: Only use the nylon screw provided
when mounting to insulate the non-anodized
threads of the aluminum sensor head from the
base to help prevent galvanic corrosion. For
extended submersion applications, more insulation
may be necessary. Contact Apogee tech support for
details.
DEPLOYMENT AND INSTALLATION
Mount the sensor to a solid surface with the nylon mounting screw provided. To accurately measure PPFD incident
on a horizontal surface, the sensor must be level. An Apogee Instruments model AL-100 leveling plate is
recommended for this purpose. To facilitate mounting on a cross arm, an Apogee Instruments model AL-120
mounting bracket is recommended.
To minimize azimuth error, the sensor should be mounted with the cable pointing toward true north in the
northern hemisphere or true south in the southern hemisphere. Azimuth error is typically less than 0.5 %, but it is
easy to minimize by proper cable orientation.
In addition to orienting the cable to point toward the nearest pole, the sensor should also be mounted such that
obstructions (e.g., weather station tripod/tower or other instrumentation) do not shade the sensor. Once
mounted, the blue cap should be removed from the sensor. The blue cap can be used as a protective covering for
the sensor when it is not in use.
Nylon Screw: 10-32 x 3/8
Model: AL-100
Model: AL-120
Nylon Screw: 10-32 x 3/8

CABLE CONNECTORS
Apogee started offering cable connectors on some
bare-lead sensors in March 2018 to simplify the
process of removing sensors from weather stations
for calibration (the entire cable does not have to be
removed from the station and shipped with the
sensor).
The ruggedized M8 connectors are rated IP68,
made of corrosion-resistant marine-grade stainless-
steel, and designed for extended use in harsh
environmental conditions.
Cable connectors are attached directly to the head.
Instructions
Pins and Wiring Colors: All Apogee connectors have
six pins, but not all pins are used for every sensor.
There may also be unused wire colors inside the
cable. To simplify datalogger connection, we remove
the unused pigtail lead colors at the datalogger end
of the cable.
If a replacement cable is required, please contact
Apogee directly to ensure ordering the proper pigtail
configuration.
Alignment: When reconnecting a sensor, arrows on
the connector jacket and an aligning notch ensure
proper orientation.
Disconnection for extended periods: When
disconnecting the sensor for an extended period of
time from a station, protect the remaining half of the
connector still on the station from water and dirt
with electrical tape or other method.
A reference notch inside the connector ensures
proper alignment before tightening.
When sending sensors in for calibration, only send the
sensor head.
Tightening: Connectors are designed to be firmly
finger-tightened only. There is an o-ring inside the
connector that can be overly compressed if a wrench
is used. Pay attention to thread alignment to avoid
cross-threading. When fully tightened, 1-2 threads
may still be visible.
WARNING: Do not tighten the connector by twisting
the black cable or sensor head, only twist the metal
connector (yellow arrows).
Finger-tighten firmly

OPERATION AND MEASUREMENT
The SQ-522 quantum sensor has a Modbus output, where photosynthetic photon flux density (PPFD) is returned in
digital format. Measurement of SQ-522 quantum sensors requires a measurement device with a Modbus interface
that supports the Read Holding Registers (0x03) function.
Wiring
The Green wire should be connected to Ground to enable RS-485 communication, or it should be connected to 12
V power for RS-232 communication. Text for the White and Blue wires above refers to the port that the wires
should be connected to.
Sensor Calibration
All Apogee Modbus quantum sensors (model SQ-522) have sensor-specific calibration coefficients determined
during the custom calibration process. Coefficients are programmed into the sensors at the factory.
Modbus Interface
The following is a brief explanation of the Modbus protocol instructions used in Apogee SQ-522 quantum sensors.
For questions on the implementation of this protocol, please refer to the official serial line implementation of the
Modbus protocol: http://www.modbus.org/docs/Modbus_over_serial_line_V1_02.pdf (2006) and the general
Modbus protocol specification: http://www.modbus.org/docs/Modbus_Application_Protocol_V1_1b3.pdf (2012).
Further information can be found at: http://www.modbus.org/specs.php
Overview
The primary idea of the Modbus interface is that each sensor exists at an address and appears as a table of values.
These values are called Registers. Each value in the table has an associated index, and that index is used to identify
which value in the table is being accessed.
Sensor addresses
Each sensor is given an address from 1 to 247. Apogee sensors are shipped with a default address of 1. If using
multiple sensors on the same Modbus line, the sensor’s address will have to be changed by writing the Slave
Address register.
White: RS-232 RX / RS-485 Positive
Blue: RS-232 TX / RS-485 Negative
Green: Select (Switch between RS-232 and RS-485)
Black: Ground
Red: Power +12 V

Register Index
Each register in a sensor represents a value in the sensor, such as a measurement or a configuration parameter.
Some registers can only be read, some registers can only be written, and some can be both read and written. Each
register exists at a specified index in the table for the sensor. Often this index is called an address, which is a
separate address than the sensor address, but can be easily confused with the sensor address.
However, there are two different indexing schemes used for Modbus sensors, though translating between them is
simple. One indexing scheme is called one-based numbering, where the first register is given the index of 1, and is
thereby accessed by requesting access to regis er 1. The other indexing scheme is called zero-based numbering,
where the first register is given the index 0, and is thereby accessed by requesting access to register 0. Apogee
Sensors use zero-based numbering. However, if using the sensor in a system that uses one-based numbering, such
as using a CR1000X logger, adding 1 to the zero-based address will produce the one-based address for the register.
Register Format:
According to the Modbus protocol specification, Holding Registers (the type registers Apogee sensors contain) are
defined to be 16 bits wide. However, when making scientific measurements, it is desirable to obtain a more precise
value than 16 bits allows. Thus, several Modbus implementations will use two 16-bit registers to act as one 32-bit
register. Apogee Modbus sensors use this 32-bit implementation to provide measurement values as 32-bit IEEE
754 floating point numbers.
Apogee Modbus sensors also contain a redundant, duplicate set of registers that use 16-bit signed integers to
represent values as decimal-shifted numbers. It is recommended to use the 32-bit values, if possible, as they
contain more precise values.
Communication Parameters:
Apogee Sensors communicate using the Modbus RTU variant of the Modbus protocol. The default communication
parameters are as follows:
Slave address: 1
Baudrate: 19200
Data bits: 8
Stop bits: 1
Parity: Even
Byte Order: Big-Endian (most significant byte sent first)
The baudrate and slave address are user configurable. Valid slave addresses are 1 to 247. Since the address 0 is
reserve as the broadcast address, setting the slave address to 0 will actually set the slave address to 1. (This will
also reset factory-calibrated values and should NOT be done by the user unless otherwise instructed.)

Read only registers (function code 0x3).
Float Registers
0
1
calibrated output µmol m⁻² s⁻¹
2
3
detector millivolts
4
5
immersed output µmol m⁻² s⁻¹
6
7
solar output µmol m⁻² s⁻¹
8
9
Reserved for Future Use
10
11
device status
(1 means device is busy, 0 otherwise)
12
13
firmware version
Integer Registers
40
calibrated output µmol m⁻² s⁻¹ (shifted one decimal point to the left)
41
detector millivolts (shifted one decimal point to the left)
42
immersed output µmol m⁻² s⁻¹ (shifted one decimal point to the left)
43
solar output µmol m⁻² s⁻¹ (shifted one decimal point to the left)
44
Reserved for Future Use
45
device status (1 means device is busy, 0 otherwise)
46
firmware version (shifted one decimal point to the left)
Read/Write registers (function codes 0x3 and 0x10).
Float Registers
16
17
slave address
18
19
model number*
20
21
serial number*
22
23
baudrate (0 = 115200, 1 = 57600, 2 = 38400, 3 = 19200, 4 = 9600, writes of
any number other than 0, 1, 2, 3, or 4 are ignored
24
25
parity (0 = none, 1 = odd, 2 = even)
26
27
number of stopbits
28
29
multiplier*
30
31
offset*
32
33
immersion factor*
34
35
solar multiplier*
36
37
running average

38
39
heater status
Integer Registers
48
slave address
49
model number*
50
serial number*
51
baudrate (0 = 115200, 1 = 57600, 2 = 38400, 3 = 19200, 4 = 9600, writes of
any number other than 0, 1, 2, 3, or 4 are ignored
52
parity (0 = none, 1 = odd, 2 = even)
53
number of stopbits
54
multiplier (shifted two decimal points to the left)*
55
offset (shifted two decimal points to the left)*
56
immersion factor (shifted two decimal points to the left)*
57
solar multiplier (shifted two decimal points to the left)*
58
running average
59
heater status
*Registers marked with an asterisk (*) cannot be written to unless a specific procedure is followed. Contact
Apogee Instruments to receive the procedure for writing these registers

Packet Framing:
Apogee sensors use Modbus RTU packets and tend to adhere to the following pattern:
Slave Address (1 byte), Function Code (1 byte), Starting Address (2 bytes), Number of Registers (2 bytes), Data
Length (1 byte, optional) Data (n bytes, optional)
Modbus RTU packets use the zero-based address when addressing registers.
For information on Modbus RTU framing, see the official documentation at
http://www.modbus.org/docs/Modbus_Application_Protocol_V1_1b3.pdf
Example Packets:
An example of a data packet sent from the controller to the sensor using function code 0x3 reading register
address 0. Each pair of square brackets indicates one byte.
[Slave Address][Function][Starting Address High Byte][Starting Address Low Byte][No of Registers High Byte][No of
Registers Low Byte][CRC High Byte][CRC Low Byte]
0x01 0x03 0x00 0x00 0x00 0x02 0xC4 0x0B
An example of a data packet sent from the controller to the sensor using function code 0x10 writing a 1 to register
26. Each pair of square brackets indicates one byte.
[Slave Address][Function][Starting Address High Byte][Starting Address Low Byte][No of Registers High Byte][No of
Registers Low Byte][Byte Count][Data High Byte][Data Low Byte][Data High Byte][Data Low Byte][CRC High
Byte][CRC Low Byte]
0x01 0x10 0x00 0x1A 0x00 0x02 0x04 0x3f 0x80 0x00 0x00 0x7f 0x20.

Spectral Error
The combination of diffuser transmittance, interference filter transmittance, and photodetector sensitivity yields
spectral response of a quantum sensor. A perfect photodetector/filter/diffuser combination would exactly match
the defined plant photosynthetic response to photons (equal weighting to all photons between 400 and 700 nm,
no weighting of photons outside this range), but this is challenging in practice. Mismatch between the defined
plant photosynthetic response and sensor spectral response results in spectral error when the sensor is used to
measure radiation from sources with a different spectrum than the radiation source used to calibrate the sensor
(Federer and Tanner, 1966; Ross and Sulev, 2000).
Spectral errors for PPFD measurements made under common radiation sources for growing plants were calculated
for Apogee SQ-100 and SQ-500 series quantum sensors using the method of Federer and Tanner (1966). This
method requires PPFD weighting factors (defined plant photosynthetic response), measured sensor spectral
response (shown in Spectral Response section on page 7), and radiation source spectral outputs (measured with a
spectroradiometer). Note, this method calculates spectral error only and does not consider calibration, directional
(cosine), temperature, and stability/drift errors. Spectral error data (listed in table below) indicate errors less than
5 % for sunlight in different conditions (clear, cloudy, reflected from plant canopies, transmitted below plant
canopies) and common broad spectrum electric lamps (cool white fluorescent, metal halide, high pressure
sodium), but larger errors for different mixtures of light emitting diodes (LEDs) for the SQ-100 series sensors.
Spectral errors for the SQ-500 series sensors are smaller than those for SQ-100 series sensors because the spectral
response of SQ-500 series sensors is a closer match to the defined plant photosynthetic response.
Quantum sensors are the most common instrument for measuring PPFD, because they are about an order of
magnitude lower cost the spectroradiometers, but spectral errors must be considered. The spectral errors in the
table below can be used as correction factors for individual radiation sources.
Spectral Errors for PPFD Measurements with Apogee SQ-100 and SQ-500 Series Quantum Sensors
Radiation Source (Error Calculated Relative to Sun, Clear Sky)
SQ-100 Series
PPFD Error [%]
SQ-500 Series
PPFD Error [%]
Sun (Clear Sky)
0.0
0.0
Sun (Cloudy Sky)
0.2
0.1
Reflected from Grass Canopy
3.8
-0.3
Transmitted below Wheat Canopy
4.5
0.1
Cool White Fluorescent (T5)
0.0
0.1
Metal Halide
-2.8
0.9
Ceramic Metal Halide
-16.1
0.3
High Pressure Sodium
0.2
0.1
Blue LED (448 nm peak, 20 nm full-width half-maximum)
-10.5
-0.7
Green LED (524 nm peak, 30 nm full-width half-maximum)
8.8
3.2
Red LED (635 nm peak, 20 nm full-width half-maximum)
2.6
0.8
Red LED (667 nm peak, 20 nm full-width half-maximum)
-62.1
2.8
Red, Blue LED Mixture (80 % Red, 20 % Blue)
-72.8
-3.9
Red, Blue, White LED Mixture (60 % Red, 25 % White, 15 % Blue)
-35.5
-2.0
Cool White LED
-3.3
0.5
Warm White LED
-8.9
0.2
Federer, C.A., and C.B. Tanner, 1966. Sensors for measuring light available for photosynthesis. Ecology 47:654-657.
Ross, J., and M. Sulev, 2000. Sources of errors in measurements of PAR. Agricultural and Forest Meteorology
100:103-125.

Yield Photon Flux Density (YPFD) Measurements
Photosynthesis in plants does not respond equally to all photons. Relative quantum yield (plant photosynthetic
efficiency) is dependent on wavelength (green line in figure below) (McCree, 1972a; Inada, 1976). This is due to the
combination of spectral absorptivity of plant leaves (absorptivity is higher for blue and red photons than green
photons) and absorption by non-photosynthetic pigments. As a result, photons in the wavelength range of
approximately 600-630 nm are the most efficient.
One potential definition of PAR is weighting photon flux density in units of mol m-2 s-1 at each wavelength
between 300 and 800 nm by measured relative quantum yield and summing the result. This is defined as yield
photon flux density (YPFD, units of mol m-2 s-1) (Sager et al., 1988). There are uncertainties and challenges
associated with this definition of PAR. Measurements used to generate the relative quantum yield data were made
on single leaves under low radiation levels and at short time scales (McCree, 1972a; Inada, 1976). Whole plants
and plant canopies typically have multiple leaf layers and are generally grown in the field or greenhouse over the
course of an entire growing season. Thus, actual conditions plants are subject to are likely different than those the
single leaves were in when measurements were made by McCree (1972a) and Inada (1976). In addition, relative
quantum yield shown in the figure above is the mean from twenty-two species grown in the field (McCree, 1972a).
Mean relative quantum yield for the same species grown in growth chambers was similar, but there were
differences, particularly at shorter wavelengths (less than 450 nm). There was also some variability between
species (McCree, 1972a; Inada, 1976).
McCree (1972b) found that equally weighting all photons between 400 and 700 nm and summing the result,
defined as photosynthetic photon flux density (PPFD, in units of mol m-2 s-1), was well correlated to
photosynthesis, and very similar to correlation between YPFD and photosynthesis. As a matter of practicality, PPFD
is a simpler definition of PAR. At the same time as McCree’s work, others had proposed PPFD as an accurate
measure of PAR and built sensors that approximated the PPFD weighting factors (Biggs et al., 1971; Federer and
Tanner, 1966). Correlation between PPFD and YPFD measurements for several radiation sources is very high (figure
below), as an approximation, YPFD = 0.9PPFD. As a result, almost universally PAR is defined as PPFD rather than
YPFD, although YPFD has been used in some studies. The only radiation sources shown (figure below) that don’t
fall on the regression line are the high pressure sodium (HPS) lamp, reflection from a plant canopy, and
transmission below a plant canopy. A large fraction of radiation from HPS lamps is in the red range of wavelengths
where the YPFD weighting factors (measured relative quantum yield) are at or near one. The factor for converting
PPFD to YPFD for HPS lamps is 0.95, rather than 0.90. The factor for converting PPFD to YPFD for reflected and
transmitted photons is 1.00.
Defined plant response to
photons (black line, weighting
factors used to calculate PPFD),
measured plant response to
photons (green line, weighting
factors used to calculate YPFD),
and SQ-500 series quantum
sensor response to photons
(sensor spectral response).

Underwater Measurements and Immersion Effect
When a quantum sensor that was calibrated in air is used to make underwater measurements, the sensor reads
Correlation between
photosynthetic photon flux
density (PPFD) and yield photon
flux density (YPFD) for multiple
different radiation sources. YPFD
is approximately 90 % of PPFD.
Measurements were made with
a spectroradiometer (Apogee
Instruments model PS-200) and
weighting factors shown in the
previous figure were used to
calculate PPFD and YPFD.
Biggs, W., A.R. Edison, J.D. Eastin, K.W. Brown, J.W. Maranville, and M.D. Clegg, 1971. Photosynthesis light sensor
and meter. Ecology 52:125-131.
Federer, C.A., and C.B. Tanner, 1966. Sensors for measuring light available for photosynthesis. Ecology 47:654-657.
Inada, K., 1976. Action spectra for photosynthesis in higher plants. Plant and Cell Physiology 17:355-365.
McCree, K.J., 1972a. The action spectrum, absorptance and quantum yield of photosynthesis in crop plants.
Agricultural Meteorology 9:191-216.
McCree, K.J., 1972b. Test of current definitions of photosynthetically active radiation against leaf photosynthesis
data. Agricultural Meteorology 10:443-453.
Sager, J.C., W.O. Smith, J.L. Edwards, and K.L. Cyr, 1988. Photosynthetic efficiency and phytochrome photoequilibria
determination using spectral data. Transactions of the ASAE 31:1882-1889.

Immersion Effect Correction Factor
When a radiation sensor is submerged in water, more of the incident radiation is backscattered out of the diffuser
than when the sensor is in air (Smith, 1969; Tyler and Smith, 1970). This phenomenon is caused by the difference
in the refractive index for air (1.00) and water (1.33), and is called the immersion effect. Without correction for the
immersion effect, radiation sensors calibrated in air can only provide relative values underwater (Smith, 1969;
Tyler and Smith, 1970). Immersion effect correction factors can be derived by making measurements in air and at
multiple water depths at a constant distance from a lamp in a controlled laboratory setting.
Apogee SQ-500 series quantum sensors have an immersion effect correction factor of 1.25. This correction factor
should be multiplied by PPFD measurements made underwater to yield accurate PPFD.
Further information on underwater measurements and the immersion effect can be found on the Apogee
webpage (http://www.apogeeinstruments.com/underwater-par-measurements/).
Smith, R.C., 1969. An underwater spectral irradiance collector. Journal of Marine Research 27:341-351.
Tyler, J.E., and R.C. Smith, 1970. Measurements of Spectral Irradiance Underwater. Gordon and Breach, New York,
New York. 103 pages
/