Page is loading ...

Users Manual
• Mode d’emploi
• Bedienungshandbuch
• Manual d’Uso
• Manual de uso
SOLAR-600
Solar Analyzer


SOLAR-600
Solar Analyzer
Users Manual
May 2010, Rev.1
©2010 Amprobe Test Tools.
All rights reserved. Printed in Taiwan
English

Limited Warranty and Limitation of Liability
Your Amprobe product will be free from defects in material and workmanship for 1 year from the
date of purchase. This warranty does not cover fuses, disposable batteries or damage from accident,
neglect, misuse, alteration, contamination, or abnormal conditions of operation or handling. Resellers
are not authorized to extend any other warranty on Amprobe’s behalf. To obtain service during the
warranty period, return the product with proof of purchase to an authorized Amprobe Test Tools
Service Center or to an Amprobe dealer or distributor. See Repair Section for details. THIS WARRANTY
IS YOUR ONLY REMEDY. ALL OTHER WARRANTIES - WHETHER EXPRESS, IMPLIED OR STAUTORY -
INCLUDING IMPLIED WARRANTIES OF FITNESS FOR A PARTICULAR PURPOSE OR MERCHANTABILITY,
ARE HEREBY DISCLAIMED. MANUFACTURER SHALL NOT BE LIABLE FOR ANY SPECIAL, INDIRECT,
INCIDENTAL OR CONSEQUENTIAL DAMAGES OR LOSSES, ARISING FROM ANY CAUSE OR THEORY.
Since some states or countries do not allow the exclusion or limitation of an implied warranty or of
incidental or consequential damages, this limitation of liability may not apply to you.
Repair
All test tools returned for warranty or non-warranty repair or for calibration should be accompanied
by the following: your name, company’s name, address, telephone number, and proof of purchase.
Additionally, please include a brief description of the problem or the service requested and include
the test leads with the meter. Non-warranty repair or replacement charges should be remitted in the
form of a check, a money order, credit card with expiration date, or a purchase order made payable to
Amprobe® Test Tools.
In-Warranty Repairs and Replacement – All Countries
Please read the warranty statement and check your battery before requesting repair. During the
warranty period any defective test tool can be returned to your Amprobe® Test Tools distributor
for an exchange for the same or like product. Please check the “Where to Buy” section on www.
amprobe.com for a list of distributors near you. Additionally, in the United States and Canada In-
Warranty repair and replacement units can also be sent to a Amprobe® Test Tools Service Center
(see address below).
Non-Warranty Repairs and Replacement – US and Canada
Non-warranty repairs in the United States and Canada should be sent to a Amprobe® Test Tools
Service Center. Call Amprobe® Test Tools or inquire at your point of purchase for current repair
and replacement rates.
In USA In Canada
Amprobe Test Tools Amprobe Test Tools
Everett, WA 98203 Mississauga, ON L4Z 1X9
Tel: 877-AMPROBE (267-7623) Tel: 905-890-7600
Non-Warranty Repairs and Replacement – Europe
European non-warranty units can be replaced by your Amprobe® Test Tools distributor for a
nominalv charge. Please check the “Where to Buy” section on www.amprobe.com for a list of
distributors near you.
European Correspondence Address*
Amprobe® Test Tools Europe
In den Engematten 14
79286 Glottertal, Germany
Tel.: +49 (0) 7684 8009 - 0
*(Correspondence only – no repair or replacement available from this address. European
customers please contact your distributor.)

SOLAR-600
Solar Analyzer
1
2
3
4
5
7
9
11
12
13
14
15
16
17
18
19
20
10
6
8
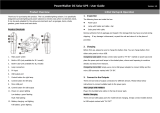
A) Front Panel

1) F1Button: (Reserved)
2)
F2 Button: (Reserved)
3)
ZERO CAL
Zero calibration of voltage and current.
Connect (short) the two Kelvin clips
together and press this button. Regular
calibration of zero would maintain the
accuracy of the instruments.
4) (Buzzer) Button
Press this button to turn on/off the
beeper (low Power) alarm function
5) I/V/P Select Button
Select display of I-V/ V-I curve, P-V/P-I
curve, or both curves
6) Test Button
Single point I-V test based up specified
value
7) Scan Button
Manual scan I-V curve test based upon
specified value
8) Auto Scan Button
Auto scan I-V curve test
9) LCD
LCD displays measurement data and
curves
10) Setup Button
Enter/Exit SETUP menu
11) Button
(1) In a curve, press it to move the
cursor left
(2) In SETUP menu, press it to
decrement value by 1
SOLAR-600
Solar Analyzer
12) Button
In the SETUP menu, press p button to
select previous item
13) Button
In the SETUP menu, press qbutton to
select next item
14) Button
(1) In a curve, press it to move the cursor
right
(2) In SETUP menu, press it to increment
value by 1
15) Begin Button
Start scanning point (current) setting
16) End Button
Stop scanning point (current) setting
17) Rec Button
(1) Record the present measurement data
(2) How to clear recorded data: keep
pressing REC button and turn on the
analyzer, then all the data recorded in
the analyzer will be deleted
18) Graph Grid Button
Display/Cancel graph grid
19) I/V Curve Button
Select I or V as horizontal coordinate
20) Power Button
Turn on/off the power of Solar Analyzer

SOLAR-600
Solar Analyzer
B) Rear Panel
C) TOP Panel (Connectors)
1) V+ Terminal
2 ) I+ Terminal
3) V- Terminal
4) I- Terminal
1) Communication Window
To connect Solar Analyzer
with PC via USB cable
2) Stand
3) Battery Cover
4) Screw of battery cover
5) AC to DC adaptor input
1
3
4
5
2
21
3 4

1
SOLAR-600 Solar Analyzer
CONTENTS
SYMBOLS, WARNINGS AND PREPARATION ........................................................ 2
UNPACKING AND INSPECTION ............................................................................ 3
INTRODUCTION .................................................................................................... 4
OPERATION ........................................................................................................... 7
Selected Condition of Auto Scan, Manual Scan, or Test ................................ 8
Connecting Diagram ........................................................................................10
Auto Scan .........................................................................................................11
Manual Scan .....................................................................................................12
Single Point Test ...............................................................................................13
Data Logging ....................................................................................................14
Zero Calibration ...............................................................................................15
Clear recorded testing data .............................................................................16
SPECIFICATION ......................................................................................................18
Electrical Specifications ....................................................................................18
Electrical Specification .....................................................................................29
MAINTENANCE AND REPAIR ............................................................................... 20
Fuse Replacement ..........................................................................................21
Maintenance & Cleaning ...............................................................................22
PC CONNECTION, SOFTWARE INSTALLATION AND OPERATION ....................... 23
INTROODUCTION ................................................................................................. 23
Operating Environment ...................................................................................23
Hardware ..........................................................................................................23
Connecting Procedures ....................................................................................23
SOFTWARE INSTALLATION 24 ............................................................................24
Install Software ................................................................................................24
Install USB Driver ..............................................................................................24
SOFTWARE OPERATION ....................................................................................... 25
Start Executing Program ..................................................................................25
Working Window before Communication .....................................................25
Working Window after Communication ........................................................26
Communication ................................................................................................26
Tool Bar ............................................................................................................27
Information, Parameter, Overall .........................................................................29

2
SYMBOLS, WARNINGS AND PREPARATION
Symbols and Warnings: Please read the statement thoroughly to prevent
injury or loss of life, and prevent damage to this product.
Caution: 1. The ventilation openings on the unit should not be
blocked.
2. Please pay attention to polarity of DC input, follow the polarity info
by the input jack.
Caution, Risk of Electric Shock
This equipment is not for measurements performed for CAT II, III, and IV
Please remove all the test leads before performing maintenance,
cleaning, battery replacement, fuse replacement, etc
Earth (Ground)
DC--Direct Current
Conforms to relevant Australian standards
Complies with European Directives
Do not dispose of this clamp meter as unsorted municipal waste.
Contact a qualified recycler for disposal
WARNING!
Do not operate this instrument in the presence of gasoline, natural gas,
propane, or in other combustible atmospheres.

3
UNPACKING AND INSPECTION
Your shipping carton should include:
1 SOLAR 600 Solar Analyzer
1 Carrying Bag
1 Users Manual
1 AC Adaptor
1 RS232C (to USB Bridge) Cable
1 Rechargeable Lithium Battery Pack
1 Software CD
1 Software Manual
1 Kelvin Clips (12A max, 1 pair)
If any of the items are damaged or missing, return the complete package to
the place of purchase for an exchange.
FEATURES
• I-V Curve Test for solar module.
• 60V and 12A Capability.
• Maximum Solar Power (Pmax) search by auto-scan.
• Maximum Voltage (Vmaxp) at Pmax.
• Maximum Current (Imaxp) at Pmax.
• Voltage at open circuit (Vopen).
• Current at short circuit (Ishort).
• I-V curve with cursor.
• Data logging function to analyze solar power characteristics over a
period of time.
• Efciency (%) calculation of solar panel.
• Scan delay setting. (0 ~ 3000 mS)
• Solar panel area setting. (0.001 m2 ~ 9999 m2)
• Standard light source setting. (10 W/m2 ~ 1000 W/m2)
• Min. power setting for alarm function.
• Built-in Calendar Clock.
• Rechargeable lithium battery with built-in charging circuit.
• Optical USB cable for PC.

4
INTRODUCTION
The SOLAR-500 can be used in Quality Control for Production Line, Warehouse
or Site of Installation.
Manufacturers of solar panels can test the characteristics for quality control
purpose in the production line. Due to the advantage of portability of the
unit, quality inspectors can randomly pick samples of solar panels and test
them in the warehouse to assure quality before shipment.
Installation engineer can randomly test samples of solar panels at site to verify
the quality of solar panels used at site of installation.
Example A: Identify the Solar Power System Requirement
Measure the actual maximum power (Pmax), voltage (Vmaxp), and current
(Imaxp) at maximum power. Instead of using the rated maximum power, the
system designer needs to be aware of the actual solar power from the solar
panel under actual operating condition. So designer can actual know how
many pieces of solar panels are required to generate specific power.
The voltage and current under actual operating condition (in the morning, at
noon, and in the afternoon) are required for system designer to design the
optimal charging system, so most of the solar power can be absorbed and
stored in the battery.
Users can test the characteristics of solar panel at different time of day
and store the data. Then design can know if the solar system can generate
appropriate power at any time.

5
Example B: Maintenance of Solar Panels
Abnormal I-V Curve (Cells at the corner of solar panel are defected)

6
Abnormal I-V Curve (defected cells scattered over the solar panel)
The technicians or maintenance engineers can store the characteristics data
of solar panels in the beginning. And compare the characteristics data in the
weekly, monthly or yearly maintenance. If the characteristics of any solar
panels are different from the previous data, technicians or maintenance
engineers can further identify the problems of solar panels.
For example, if any cells of solar panels are damaged, the I-V curve would
be very different from a typical curve. If the solar panels are covers by a lot
of dust, the I-V curve or the maximum power would be much lower than
previously stored data. Once defected panels are found, technicians or
maintenance engineers can replace them with new panels
Example C: Verify the Best Installation Angle of Solar Panels
Engineers can collect data of installation angle at different date and time
by using the unit at site of installation. The data can be used as reference to
design automated angle adjustment system. Or the data can be used to select
an optimal angle for a fixed angle installation.

7
OPERATION
WARNING!
when users see “Overheated” warning shown in LCD
1. Users must wait during this “Overheated: cooling” period before they
start next simulation.
2. And if users would like to turn the unit off, they must wait for another 3
min. (at least) for the cooling fan to cool off the internal components.
WARNING!
When using a lithium battery as the power source, please do not plug in
an AC adaptor. Or the power source will be stopped and the data will
disappear
Note: When pressing any button, users will hear a sound of buzzer. When
keeping pressing it for more than 2 seconds, users will hear another sound
of buzzer

8
Selected Condition of Auto Scan, Manual Scan, or Test
Users should first select AUTO SCAN ( ) to obtain a general idea of
characteristics of a solar panel.
1. Press
button to turn on the Analyzer. Properly connect the pair of
Kelvin clips to the solar panel and the Analyzer. The red Kelvin clip is for
positive pole and the black Kelvin clip for negative pole.
2. Press
button to start AUTO SCAN. After the scanning is finished,
the result will come out like below.
Afterward, if users are interested in a specific operating range, they can enter
the beginning and ending values of scan in the setup menu.
Press SCAN (
) button to test the specific range.
1. Press
button to turn on the Analyzer. Properly connect the pair of
Kelvin clips to the solar panel and the Analyzer. The red Kelvin clip is for
positive pole and the black Kelvin clip for negative pole.
2. Press
button to enter the SETUP menu: (Type in the current range
for scanning)
Current Range of Scan begin: 200mA
Current Range of Scan end: 548mA
After setting up the current range, press
button again to exit the
SETUP menu.
Note: If the “Current Range of Scan begin” is over “Ishort”, then the
scanning will not be performed and no result will come out.

9
3. Press button to start MANUAL SCAN. After the scanning is
finished, the result will come out like below.
If users are interested in a specific point of test current, users can enter
the current value for a Single Test Point. Press TEST (
) to test the
characteristics at the current.
1. Press
button to turn on the Analyzer. Properly connect the pair of
Kelvin clips to the solar panel and the Analyzer. The red Kelvin clip is for
positive pole and the black Kelvin clip for negative pole.
2. Press
button to enter the SETUP menu: (Type in the testing current)
Single Test Point: 609mA
After setting up the current range, press
button again to exit the
SETUP menu.
3. Press
button to start Testing a Single Test. After the testing is
finished, theresult will come out like below. The result (P, V, I) is shown in
reverse video as below.

10
Connecting Diagram
Kelvin Clip Connecting Diagram
Alligator Clip Connecting Diagram

11
Auto Scan
1. Press button to turn on the Analyzer.
2. Properly connect the pair of Kelvin clips to the solar panel and the
Analyzer. The red Kelvin clip is for positive pole and the black Kelvin clip
for negative pole. (refer to above Connecting Diagram).
3. Turn on any available light source (e.g. halogen lamp, xenon lamp,
tungsten lamp, …) and let it illuminates solar panel uniformly.
Or place the solar panel under the sun.
4. Press
(AUTO SCAN) button to perform Auto-scan. After the
scanning is finished, the result will come out like below.
5. The unit automatically measures the followings parameters: Vopen,
Ishort, Pmax, Vmaxp, and Imaxp. Based upon those parameters, the unit
run simulation and draw I-V / V-I curve and P-V / P-I curves in LCD.
6. Users can move the cursor to review each individual values along the
curve.
WARNING!
There is a time delay before the unit performs the “Auto Scan”. This time
delay allows the light source to be turned on before “Auto Scan” starts.
Time delay can be set in the SETUP menu
Note: If the short circuit current (Ishort) exceeds 12A, Auto Scan will not be
performed. Please select Manual Scan and limit the ending value of Scan
to be less than 12A.

12
Manual Scan
1. Press button to turn on the Analyzer.
2. Properly connect the pair of Kelvin clips to the solar panel and the
Analyzer. The red Kelvin clip is for positive pole and the black Kelvin clip
for negative pole.
3. Press
button to enter the SETUP menu: (Type in the current range
for scanning)
Current Range of Scan begin: 200mA
Current Range of Scan end: 548mA
After setting up the current range, press
button again to exit the
SETUP menu.
Note: If the “Current Range of Scan begin” is over “Ishort”, then the
scanning will not be performed and no result will come out.
4. Press
(SCAN) button to start MANUAL SCAN. The analyzer run
simulation from the BEGIN value to END value, and draw I-V / V-I curve
and P-V / P-I curve in LCD. Users can move the cursor to review each
individual values along the curve.
After the scanning is finished, the result will come out like below.
WARNING!
There is a time delay before the unit performs the “Manual Scan”. This
time delay allows the light source to be turned on before “Manual Scan”
starts. Time delay can be set in the SETUP menu.

13
Single Point Test
1. Press button to turn on the Analyzer.
2. Properly connect the pair of Kelvin clips to the solar panel and the
Analyzer. The red Kelvin clip is for positive pole and the black Kelvin clip
for negative pole.
3. Press
button to enter the SETUP menu: (Type in the current range
for scanning)
Single Test Point: 609mA
After setting up the current range, press
button again to exit the
SETUP menu.
4. Press
button to start Testing a Single Test. After the testing is
finished, the result will come out like below. The result (P, V, I) is shown
in reverse video as below.
WARNING!
Time delay in the “Single Point Test” allows the current simulation to last
longer. Though the max. value is 9.999 sec., the time delay is changed to
10 msec. if power is over 100 W. The time delay is extended to 3 seconds
if power is less than 100 mW.
/