Page is loading ...

APOGEE INSTRUMENTS, INC. | 721 WEST 1800 NORTH, LOGAN, UTAH 84321, USA
TEL: (435) 792-4700 | FAX: (435) 787-8268 | WEB: APOGEEINSTRUMENTS.COM
Copyright © 2016 Apogee Instruments, Inc.
OWNER’S MANUAL
UNDERWATER QUANTUM METER
Models MQ-510

2
TABLE OF CONTENTS
Owner’s Manual ................................................................................................................................................................................................................ 1
Certificate of Compliance .................................................................................................................................................................................... 3
Introduction ............................................................................................................................................................................................................. 4
Sensor Models ......................................................................................................................................................................................................... 5
Specifications ........................................................................................................................................................................................................... 6
Deployment and Installation .............................................................................................................................................................................. 9
Operation and Measurement ........................................................................................................................................................................... 10
Maintenance and Recalibration ....................................................................................................................................................................... 14
Troubleshooting and Customer Support...................................................................................................................................................... 15
Return and Warranty Policy .............................................................................................................................................................................. 17

3
CERTIFICATE OF COMPLIANCE
EU Declaration of Conformity
This declaration of conformity is issued under the sole responsibility of the manufacturer:
Apogee Instruments, Inc.
721 W 1800 N
Logan, Utah 84321
USA
for the following product(s):
Models: MQ-510
Type: Quantum Meter
The object of the declaration described above is in conformity with the relevant Union harmonization legislation:
2014/30/EU Electromagnetic Compatibility (EMC) Directive
2011/65/EU Restriction of Hazardous Substances (RoHS 2) Directive
Standards referenced during compliance assessment:
EN 61326-1:2013 Electrical equipment for measurement, control and laboratory use – EMC requirements
EN 50581:2012 Technical documentation for the assessment of electrical and electronic products with respect to the
restriction of hazardous substances
Please be advised that based on the information available to us from our raw material suppliers, the products manufactured
by us do not contain, as intentional additives, any of the restricted materials including cadmium, hexavalent chromium, lead,
mercury, polybrominated biphenyls (PBB), polybrominated diphenyls (PBDE).
Further note that Apogee Instruments does not specifically run any analysis on our raw materials or end products for the
presence of these substances, but rely on the information provided to us by our material suppliers.
Signed for and on behalf of:
Apogee Instruments, May 2016
Bruce Bugbee
President
Apogee Instruments, Inc.

4
INTRODUCTION
Radiation that drives photosynthesis is called photosynthetically active radiation (PAR) and is typically defined as total
radiation across a range of 400 to 700 nm. PAR is often expressed as photosynthetic photon flux density (PPFD): photon flux
in units of micromoles per square meter per second (µmol m-2 s-1, equal to microEinsteins per square meter per second)
summed from 400 to 700 nm (total number of photons from 400 to 700 nm). While Einsteins and micromoles are equal (one
Einstein = one mole of photons), the Einstein is not an SI unit, so expressing PPFD as µmol m-2 s-1 is preferred.
The acronym PPF is also widely used and refers to the photosynthetic photon flux. The acronyms PPF and PPFD refer to the
same parameter. The two terms have co-evolved because there is not a universal definition of the term “flux”. Some
physicists define flux as per unit area per unit time. Others define flux only as per unit time. We have used PPFD in this
manual because we feel that it is better to be more complete and possibly redundant.
Sensors that measure PPFD are often called quantum sensors due to the quantized nature of radiation. A quantum refers to
the minimum quantity of radiation, one photon, involved in physical interactions (e.g., absorption by photosynthetic
pigments). In other words, one photon is a single quantum of radiation.
Quantum sensors are increasingly used to measure PPFD underwater, which is important for biological, chemical, and
physical processes in natural waters and in aquariums. When a quantum sensor that was calibrated in air is used to make
underwater measurements, the sensor reads low. This phenomenon is called the immersion effect and happens because the
refractive index of water (1.33) is greater than air (1.00). The higher refractive index of water causes more light to be
backscattered (or reflected) out of the sensor in water than in air (Smith,1969; Tyler and Smith,1970). As more light is
reflected, less light is transmitted through the diffuser to the detector, which causes the sensor to read low. Without
correcting for this effect, underwater measurements are only relative, which makes it difficult to compare light in different
environments. The immersion effect correction factor for Apogee full-spectrum quantum sensors (model MQ-500 and SQ-
500 series) is 1.32. The MQ-510 quantum meter is designed for underwater measurements, and already applies the
immersion effect correction factor to the meter’s readings through firmware. The meter consists of a waterproof quantum
sensors attached via waterproof cable to a handheld meter. Note: The handheld meter is not waterproof, only the sensor
and cable are waterproof.
MQ meters consist of a handheld meter and a dedicated quantum sensor that is connected by cable to an anodized
aluminum housing. Sensors consist of a cast acrylic diffuser (filter), photodiode, and are potted solid with no internal air
space. MQ series quantum meters provide a real-time PPFD reading on the LCD display, that determine the radiation incident
on a planar surface (does not have to be horizontal), where the radiation emanates from all angles of a hemisphere. MQ
series quantum meters include manual and automatic data logging features for making spot-check measurements or
calculating daily light integral (DLI).

5
SENSOR MODELS
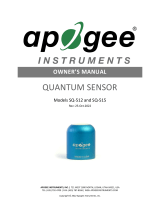
Apogee MQ series quantum meters covered in this manual are self-contained and come complete with handheld meter and
sensor.
Sensor model number and serial number are located on a
label on the backside of the handheld meter.

6
SPECIFICATIONS
Calibration Traceability
Apogee MQ series quantum meters are calibrated through side-by-side comparison to the mean of four Apogee model SQ-
110 or SQ-120 transfer standard quantum sensors under high output T5 cool white fluorescent lamps. The transfer standard
quantum sensors are calibrated through side-by-side comparison to the mean of at least three LI-COR model LI-190 reference
quantum sensors under high output T5 cool white fluorescent lamps. The reference quantum sensors are recalibrated on a
biannual schedule with a LI-COR model 1800-02 Optical Radiation Calibrator using a 200 W quartz halogen lamp. The 1800-
02 and quartz halogen lamp are traceable to the National Institute of Standards and Technology (NIST).
MQ-510
Calibration Uncertainty ± 5 % (see calibration Traceability below)
Measurement Range 0 to 4000 µmol m-2 s-1
Measurement Repeatability Less than 0.5 %
Long-term Drift
(Non-stability)
Less than 2 % per year
Non-linearity Less than 1 % (up to 4000 µmol m-2 s-1)
Response Time Less than 1 ms
Field of View 180º
Spectral Range 389 to 692 nm ± 5 nm (wavelengths where response is greater than 50 %)
Spectral Selectivity Less than 10 % from 412 to 682 nm ± 5 nm (see Spectral Response below)
Directional (Cosine)
Response
± 5 % at 75º zenith angle (see Cosine Response below)
Azimuth Error Less than 0.5 %
Tilt Error Less than 0.5 %
Temperature Response -0.11 ± 0.04 % C-1 (see Temperature Response below)
Uncertainty in Daily Total Less than 5 %
Detector Blue-enhanced silicon photodidode
Housing Anodized aluminum body with acrylic diffuser
IP Rating IP68
Operating Environment
0 to 50 C; less than 90 % non-condensing relative humidity up to 30 C; less than 70 % non-condensing
relativity humidity from 30 to 50 C; separate sensors can be submerged in water up to depth of 30 m
Meter Dimension 126 mm length; 70 mm width; 24 mm height
Sensor Dimensions 24 mm diameter; 37 mm height
Mass 100 g (with 5 m of lead wire)
Cable 2 m of two conductor, shielded, twisted-pair wire; additional cable available; santoprene rubber jacket

7
Spectral Response
Temperature Response
Mean temperature response of ten SQ-500 series
quantum sensors (errors bars represent two
standard deviations above and below mean).
Temperature response measurements were
made at 10 C intervals across a temperature
range of approximately -20 to 50 C in a
temperature controlled chamber under a fixed,
broad spectrum, electric lamp. At each
temperature set point, a spectroradiometer was
used to measure light intensity from the lamp
and all quantum sensors were compared to the
spectroradiometer. The spectroradiometer was
mounted external to the temperature control
chamber and remained at room temperature
during the experiment.
Mean spectral response measurements of six
replicate Apogee SQ-100 and SQ-500 series
quantum sensor. Spectral response
measurements were made at 10 nm increments
across a wavelength range of 300 to 800 nm in a
monochromator with an attached electric light
source. Measured spectral data from each
quantum sensor were normalized by the
measured spectral response of the
monochromator/electric light combination,
which was measured with a spectroradiometer.

8
Cosine Response
Directional, or cosine, response is defined as the measurement error at a
specific angle of radiation incidence. Error for Apogee SQ series quantum
sensors is approximately ± 2 % and ± 5 % at solar zenith angles of 45° and
75°, respectively.
Mean cosine response of seven apogee
SQ-500 quantum sensors. Cosine response
measurements were made on the rooftop
of the Apogee building in Logan, UT.
Cosine response was calculated as the
relative difference of SQ-500 quantum
sensors from the mean of replicate
reference quantum sensors (LI-COR
models LI-190 and LI-190R, Kipp & Zonen
model PQS 1).

9
MQ-510 sensor attach to AL-100 leveling
plate.
AM-320 Saltwater Submersible
Sensor Wand
DEPLOYMENT AND INSTALLATION
Apogee MQ series quantum meters are designed for spot-check measurements, and calculation of daily light integral (DLI;
total number of photons incident on a planar surface over the course of a day) through the built-in logging feature. To
accurately measure PFFD incident on a horizontal surface, the sensor must be level. The AL-100 accessory leveling plate is
recommended for use with the MQ-510 to ensure the sensor is level when attached to a cross-arm. The bubble-level in the
plate makes leveling simple and accurate.
The AM-320 Saltwater Submersible Sensor Wand accessory incorporates a mounting fixture at the end of a 40 inch
segmented fiberglass wand and is well-suited for saltwater use. The wand allows the user to place the sensor in hard reach
areas such as aquariums.

10
OPERATION AND MEASUREMENT
MQ series quantum meters are designed with a user-friendly interface allowing quick and easy measurements.
To power the meter, slide the included battery (CR2320) into the battery holder, after removing the battery door
from the meter’s back panel. The positive side (designated by a “+” sign) should be facing out from the meter circuit board.
Press the power button to activate the LCD display. After two minutes of non-activity the meter will revert
to sleep mode and the display will shut off to conserve battery life.
Press the mode button to access the main menu, where manual or automatic logging are selected, and
where the meter can be reset.
Press the sample button to log a reading while taking manual measurements.
Press the up button to make selections in the main menu. This button is also used to view and scroll through the logged
measurements on the LCD display.
Press the down button to make selections in the main menu. This button is also used to view and scroll
through the logged measurements on the LCD display.
Logging: To choose between manual or automatic logging, push the mode button twice and use the up/down buttons to
make the appropriate selection (SMPL or LOG). Once the desired mode is blinking, press the mode button two more times to
exit the menu. When in SMPL mode press the sample button to record up to 99 manual measurements (a counter in the
The LCD display consists of the total number of logged
measurements in the upper right hand corner, the real-time PPFD
value in the center, and the selected menu options along the
bottom.

11
upper right hand corner of the LCD display indicates the total number of saved measurements). When in LOG mode the
meter will power on/off to make a measurement every 30 seconds. Every 30 minutes the meter will average the sixty 30
second measurements and record the averaged value to memory. The meter can store up to 99 averages and will start to
overwrite the oldest measurement once there are 99 measurements. Every 48 averaged measurements (making a 24 hour
period), the meter will also store an integrated daily total in moles per meter squared per day (mol m-2 d-1).
Reset: To reset the meter, in either SMPL or LOG mode, push the mode button three times (RUN should be blinking), then
while pressing the down button, press the mode button once. This will erase all of the saved measurements in memory, but
only for the selected mode. That is, performing a reset when in SMPL mode will only erase the manual measurements and
performing a reset when in LOG mode will only erase the automatic measurements.
Review/Download Data: Each of the logged measurements in either SMPL or LOG mode can be reviewed on the LCD
display by pressing the up/down buttons. To exit and return to the real-time readings, press the sample button. Note that the
integrated daily total values are not accessible through the LCD and can only be viewed by downloading to a computer.
Downloading the stored measurements will require the AC-100 communication cable and software (sold separately). The
meter outputs data using the UART protocol and requires the AC-100 to convert from UART to USB, so standard USB cables
will not work. Set up instructions and software can be downloaded from the Apogee website
(http://www.apogeeinstruments.com/ac-100-communcation-cable/).
Spectral Error
The combination of diffuser transmittance, interference filter transmittance, and photodetector sensitivity yields spectral
response of a quantum sensor. A perfect photodetector/filter/diffuser combination would exactly reproduce the defined
plant photosynthetic response to photons (equal weighting to all photons between 400 and 700 nm), but this is challenging
in practice. Mismatch between the defined plant photosynthetic response and sensor spectral response results in spectral
error when the sensor is used to measure radiation from sources with a different spectrum than the radiation source used to
calibrate the sensor (Federer and Tanner, 1966; Ross and Sulev, 2000).
Spectral errors for PPFD measurements made under different radiation sources were calculated for the SQ-100 and SQ-500
series quantum sensors using the method of Federer and Tanner (1966). This method requires PPFD weighting factors
(defined plant photosynthetic response), measured sensor spectral response (shown in Spectral Response section on page 7),
and radiation source spectral outputs (measured with a spectroradiometer). Note, this method calculates spectral error only
and does not consider calibration, cosine, and temperature errors. Spectral error data (listed in table below) indicate errors
typically less than 5 % for sunlight in different conditions (clear, cloudy, reflected from plant canopies, transmitted below
plant canopies) and common broad spectrum electric lamps (cool white fluorescent, metal halide, high pressure sodium), but
larger errors for different mixtures of light emitting diodes (LEDs) for the SQ-100 series. Spectral errors for the SQ-500 series
sensors are smaller than those for SQ-100 series sensors because the SQ-500 spectral response is a closer match to the
defined plant photosynthetic response.
Spectral Errors for PPFD and YPFD Measurements with Apogee SQ Series Quantum Sensors
Radiation Source (Error Calculated Relative to Sun, Clear Sky)
SQ-100 Series
PPFD Error [%]
SQ-500 Series
PPFD Error [%]
Sun (Clear Sky)
0.0
0.0
Sun (Cloudy Sky) 1.4 0.5
Reflected from Grass Canopy
5.7
0.0
Transmitted below Wheat Canopy
6.4
1.1
Cool White Fluorescent (T5)
0.0
2.2
Metal Halide
-3.7
3.1
Ceramic Metal Halide
-6.0
1.9

12
High Pressure Sodium
0.8
2.2
Blue LED (448 nm peak, 20 nm full-width half-maximum)
-12.7
3.0
Green LED (524 nm peak, 30 nm full-width half-maximum)
8.0
5.2
Red LED (635 nm peak, 20 nm full-width half-maximum)
4.8
0.2
Red LED (668 nm peak, 20 nm full-width half-maximum)
-79.1
-1.9
Red, Blue LED Mixture (84 % Red, 16 % Blue)
-65.3
-1.2
Red, White LED Mixture (79 % Red, 21 % Blue)
-60.3
-0.8
Cool White Fluorescent LED -4.6 2.2
Quantum sensors can be a very practical means of measuring PPFD and YPFD from multiple radiation sources, but spectral
errors must be considered. The spectral errors in the table above can be used as correction factors for individual radiation
sources.
Federer, C.A., and C.B. Tanner, 1966. Sensors for measuring light available for photosynthesis. Ecology 47:654-657.
Ross, J., and M. Sulev, 2000. Sources of errors in measurements of PAR. Agricultural and Forest Meteorology 100:103-125.
Yield Photon Flux Measurements
Photosynthesis in plants does not respond equally to all photons. Relative quantum yield (photosynthetic efficiency) is
dependent on wavelength (blue line in figure below) (McCree, 1972a; Inada, 1976). This is due to the combination of spectral
absorptivity of plant leaves (absorptivity is higher for blue and red photons than green photons) and absorption by non-
photosynthetic pigments. As a result, photons in the wavelength range of approximately 600-630 nm are the most efficient.
One potential definition of PAR is weighting photon flux density [µmol m-2 s-1] at each wavelength between 300 and 800 nm
by relative quantum yield and summing the result. This is defined as yield photon flux density (YPFD) [µmol m-2 s-1] (Sager et
al., 1988). There are uncertainties and challenges associated with this definition of PAR. Measurements used to generate the
relative quantum yield data were made on single leaves under low radiation levels and at short time scales (McCree, 1972a;
Inada, 1976). Whole plants and plant canopies typically have multiple leaf layers and are generally grown in the field or
greenhouse over the course of an entire growing season. Thus, actual conditions plants are subject to are likely different than
those the single leaves were in when measurements were made by McCree (1972a) and Inada (1976). In addition, relative
quantum yield (shown in figure above) is the mean from twenty-two species grown in the field (McCree, 1972a). Mean
relative quantum yield for the same species grown in growth chambers was similar, but there were differences, particularly at
shorter wavelengths (less than 450 nm). There was also some variability between species (McCree, 1972a; Inada, 1976).
McCree (1972b) found that equally weighting all photons between 400 and 700 nm and summing the result, defined as
photosynthetic photon flux density (PPFD) [µmol m-2 s-1], was well correlated to photosynthesis, very similar to correlation
between YPFD and photosynthesis. As a matter of practicality, PPFD is a simpler definition of PAR. At the same time as
McCree’s work, others had proposed PPFD as an accurate measure of PAR and built sensors that approximated the PPFD
weighting factors (Biggs et al., 1971; Federer and Tanner, 1966). Correlation between PPFD and YPFD measurements for
several radiation sources is very high (figure below). As an approximation, YPFD = 0.9PPFD. As a result, almost universally PAR
is defined as PPFD rather than YPFD, although YPFD has been used in some studies. The only radiation sources shown (figure
Radiation weighting factors for PPFD
(black line, defined plant response to
radiation), YPFD (blue line, measured
plant response to radiation), and
Apogee SQ-500 Series Quantum Sensors
(green line, sensor sensitivity to
different wavelengths of radiation).

13
below) that don’t fall on the regression line are the high pressure sodium (HPS) lamp, reflection from a plant canopy, and
transmission below a plant canopy. A large fraction of radiation from HPS lamps is in the red range of wavelengths where the
YPFD weighting factors are at or near one. The factor for converting PPFD to YPFD for HPS lamps is 0.95, rather than 0.90. The
factor for converting PPFD to YPFD for reflected and transmitted photons is 1.00.
Biggs, W., A.R. Edison, J.D. Eastin, K.W. Brown, J.W. Maranville, and M.D. Clegg, 1971. Photosynthesis light sensor and meter.
Ecology 52:125-131.
Federer, C.A., and C.B. Tanner, 1966. Sensors for measuring light available for photosynthesis. Ecology 47:654-657.
Inada, K., 1976. Action spectra for photosynthesis in higher plants. Plant and Cell Physiology 17:355-365.
McCree, K.J., 1972a. The action spectrum, absorptance and quantum yield of photosynthesis in crop plants. Agricultural
Meteorology 9:191-216.
McCree, K.J., 1972b. Test of current definitions of photosynthetically active radiation against leaf photosynthesis data.
Agricultural Meteorology 10:443-453.
Sager, J.C., W.O. Smith, J.L. Edwards, and K.L. Cyr, 1988. Photosynthetic efficiency and phytochrome photoequilibria
determination using spectral data. Transactions of the ASAE 31:1882-1889.
Underwater Measurements and Immersion Effect
When a quantum sensor that was calibrated in air is used to make underwater measurements, the sensor reads low. This
phenomenon is called the immersion effect and happens because the refractive index of water (1.33) is greater than air
(1.00). The higher refractive index of water causes more light to be backscattered (or reflected) out of the sensor in water
than in air (Smith,1969; Tyler and Smith,1970). As more light is reflected, less light is transmitted through the diffuser to the
detector, which causes the sensor to read low. Without correcting for this effect, underwater measurements are only relative,
which makes it difficult to compare light in different environments.
The MQ-510 sensor has an immersion effect correction factor of 1.32. The immersion effect correction factor is already
accounted for in the MQ-510 meter firmware so there is no need to apply the correction factor to your measurements. If you
wish to use your meter to make measurements in air, simply divide the measured number by the immersion effect (1.32).
When making underwater measurements, only the sensor and cable can go in the water. The handheld meter is not
waterproof and must not get wet. If the meter might get wet from splashing, we recommend placing it in a plastic bag or
other container to help protect it from accidentally getting wet.
Further information on underwater measurements and the immersion effect can be found at
http://www.apogeeinstruments.com/underwater-par-measurements/.
Correlation between photosynthetic
photon flux density (PPFD) and yield
photon flux density (YPFD) for multiple
different radiation sources. YPFD is
approximately 90 % of PPFD.
Measurements were made with a
spectroradiometer (Apogee Instruments
model PS-200) and weighting factors
shown in previous figure were used to
calculate PPFD and YPFD.

14
MAINTENANCE AND RECALIBRATION
Moisture or debris on the diffuser is a common cause of low readings. The sensor has a domed diffuser and housing for
improved self-cleaning, but materials can accumulate on the diffuser (e.g., dust, salt deposits) and partially block the optical
path. Dust or organic deposits are best removed using water, or window cleaner and a soft cloth or cotton swab. Salt
deposits should be dissolved with vinegar and removed with a soft cloth or cotton swab. Never use an abrasive material or
cleaner on the diffuser.
The Clear Sky Calculator (www.clearskycalculator.com) can be used to determine the need for quantum meter recalibration.
It determines PPFD incident on a horizontal surface at any time of day at any location in the world. It is most accurate when
used near solar noon in spring and summer months, where accuracy over multiple clear and unpolluted days is estimated to
be ± 4 % in all climates and locations around the world. For best accuracy, the sky must be completely clear, as reflected
radiation from clouds causes incoming radiation to increase above the value predicted by the clear sky calculator. Measured
values of PPFD can exceed values predicted by the Clear Sky Calculator due to reflection from the sides and edges of clouds.
This reflection increases the incoming radiation. The influence of high clouds typically shows up as spikes above clear sky
values, not a constant offset greater than clear sky values.
To determine recalibration need, input site conditions into the calculator and compare PPFD measurements to calculated
PPFD values for a clear sky. If sensor PPFD measurements over multiple days near solar noon are consistently different than
calculated values (by more than 6 %), the sensor should be cleaned and re-leveled. If PPFD measurements are still different
after a second test, email calibration@apogeeinstruments.com to discuss test results and possible return of meter(s) for
recalibration.
Homepage of the Clear Sky Calculator. Two calculators are
available: one for quantum sensors (PPFD) and one for
pyranometers (total shortwave radiation).
Clear Sky Calculator for quantum sensors. Site data are input
in blue cells in middle of page and an estimate of PPFD is
returned on right-hand side of page.

15
TROUBLESHOOTING AND CUSTOMER SUPPORT
Verify Functionality
Pressing the power button should activate the LCD and provide a real-time PPFD reading. Direct the sensor head toward a
light source and verify the PPFD reading responds. Increase and decrease the distance from the sensor to the light source to
verify that the reading changes proportionally (decreasing PPFD with increasing distance and increasing PPFD with
decreasing distance). Blocking all radiation from the sensor should force the PPFD reading to zero.
Battery Life
When the meter is maintained properly the coin cell battery (CR2320) should last for many months, even after continuous
use. The low battery indicator will appear in the upper left hand corner of the LCD display when the battery voltage drops
below 2.8 V DC. The meter will still function correctly for some time, but once the battery is drained the pushbuttons will no
longer respond and any logged measurements will be lost.
Pressing the power button to turn off the meter will actually put it in sleep mode, where there is still a slight amount of
current draw. This is necessary to maintain the logged measurements in memory. Therefore, it is recommended to remove
the battery when storing the meter for many months at a time, in order to preserve battery life.
Master Reset
If a meter ever becomes non-responsive or experiences anomalies, such as a low battery indicator even after replacing the
old battery, a master reset can be performed that may correct the problem. Note that a master reset will erase all logged
measurements from memory.
First press the power button so that the LCD display is activated. While still powered, slide the battery out of the holder,
which will cause the LCD display to fade out. After a few seconds, slide the battery back into the holder. The LCD display will
flash all segments and then show a revision number (e.g. “R1.0”). This indicates the master reset was performed and the
display should return to normal.
Error Codes and Fixes
Error codes will appear in place of the real-time reading on the LCD display and will continue to flash until the problem is
corrected. Contact Apogee if the following fixes do not rectify the problem.
Err 1: battery voltage out of range. Fix: replace CR2320 battery and perform master reset.
Err 2: sensor voltage out of range. Fix: perform master reset.
Err 3: not calibrated. Fix: perform master reset.
Err 4: CPU voltage below minimum. Fix: replace CR2320 battery and perform master reset.
Modifying Cable Length
Although it is possible to splice additional cable to the separate sensor of the appropriate MQ model, note that the cable
wires are soldered directly into the circuit board of the meter. Care should be taken to remove the back panel of the meter in
order to access the board and splice on the additional cable, otherwise two splices would need to be made between the
meter and sensor head. See Apogee webpage for further details on how to extend sensor cable length:
(http://www.apogeeinstruments.com/how-to-make-a-weatherproof-cable-splice/).
Unit Conversion Charts
Apogee MQ series quantum sensors are calibrated to measure PPFD in units of µmol m-2 s-1. Units other than photon flux
density (e.g., energy flux density, illuminance) may be required for certain applications. It is possible to convert the PPFD

16
value from a quantum sensor to other units, but it requires spectral output of the radiation source of interest. Conversion
factors for common radiation sources can be found on the Unit Conversions page in the Support Center on the Apogee
website (http://www.apogeeinstruments.com/unit-conversions/). A spreadsheet to convert PPFD to energy flux density or
illuminance is also provided on the Unit Conversions page in the Support Center on the Apogee website
(http://www.apogeeinstruments.com/content/PPFD-to-Illuminance-Calculator.xls).

17
RETURN AND WARRANTY POLICY
RETURN POLICY
Apogee Instruments will accept returns within 30 days of purchase as long as the product is in new condition (to be
determined by Apogee). Returns are subject to a 10 % restocking fee.
WARRANTY POLICY
What is Covered
All products manufactured by Apogee Instruments are warranted to be free from defects in materials and craftsmanship for a
period of four (4) years from the date of shipment from our factory. To be considered for warranty coverage an item must be
evaluated either at our factory or by an authorized distributor.
Products not manufactured by Apogee (spectroradiometers, chlorophyll content meters) are covered for a period of one (1)
year.
What is Not Covered
The customer is responsible for all costs associated with the removal, reinstallation, and shipping of suspected warranty
items to our factory.
The warranty does not cover equipment that has been damaged due to the following conditions:
1. Improper installation or abuse.
2. Operation of the instrument outside of its specified operating range.
3. Natural occurrences such as lightning, fire, etc.
4. Unauthorized modification.
5. Improper or unauthorized repair.
Please note that nominal accuracy drift is normal over time. Routine recalibration of sensors/meters is considered part of
proper maintenance and is not covered under warranty.
Who is Covered
This warranty covers the original purchaser of the product or other party who may own it during the warranty period.
What We Will Do
At no charge we will:
1. Either repair or replace (at our discretion) the item under warranty.
2. Ship the item back to the customer by the carrier of our choice.
Different or expedited shipping methods will be at the customer’s expense.
How To Return An Item
1. Please do not send any products back to Apogee Instruments until you have received a Return Merchandise Authorization
(RMA) number from our technical support department by calling (435) 792-4700 or by submitting an online RMA form at
www.apogeeinstruments.com/tech-support-recalibration-repairs/. We will use your RMA number for tracking of the service
item.

18
2. Send all RMA sensors and meters back in the following condition: Clean the sensor’s exterior and cord. Do not modify the
sensors or wires, including splicing, cutting wire leads, etc. If a connector has been attached to the cable end, please include
the mating connector – otherwise the sensor connector will be removed in order to complete the repair/recalibration.
3. Please write the RMA number on the outside of the shipping container.
4. Return the item with freight pre-paid and fully insured to our factory address shown below. We are not responsible for any
costs associated with the transportation of products across international borders.
5. Upon receipt, Apogee Instruments will determine the cause of failure. If the product is found to be defective in terms of
operation to the published specifications due to a failure of product materials or craftsmanship, Apogee Instruments will
repair or replace the items free of charge. If it is determined that your product is not covered under warranty, you will be
informed and given an estimated repair/replacement cost.
Apogee Instruments, Inc.
721 West 1800 North Logan, UT
84321, USA
OTHER TERMS
The available remedy of defects under this warranty is for the repair or replacement of the original product, and Apogee
Instruments is not responsible for any direct, indirect, incidental, or consequential damages, including but not limited to loss
of income, loss of revenue, loss of profit, loss of wages, loss of time, loss of sales, accruement of debts or expenses, injury to
personal property, or injury to any person or any other type of damage or loss.
This limited warranty and any disputes arising out of or in connection with this limited warranty ("Disputes") shall be
governed by the laws of the State of Utah, USA, excluding conflicts of law principles and excluding the Convention for the
International Sale of Goods. The courts located in the State of Utah, USA, shall have exclusive jurisdiction over any Disputes.
This limited warranty gives you specific legal rights, and you may also have other rights, which vary from state to state and
jurisdiction to jurisdiction, and which shall not be affected by this limited warranty. This warranty extends only to you and
cannot by transferred or assigned. If any provision of this limited warranty is unlawful, void or unenforceable, that provision
shall be deemed severable and shall not affect any remaining provisions. In case of any inconsistency between the English
and other versions of this limited warranty, the English version shall prevail.
This warranty cannot be changed, assumed, or amended by any other person or agreement.
APOGEE INSTRUMENTS, INC. | 721 WEST 1800 NORTH, LOGAN, UTAH 84321, USA
TEL: (435) 792-4700 | FAX: (435) 787-8268 | WEB: APOGEEINSTRUMENTS.COM
Copyright © 2016 Apogee Instruments, Inc.
/