Page is loading ...

30 Amp
Solar Charge
Controller
SCC-30AB
Owner's
Manual
Please read this
manual before
operating your
charge controller.

2
1. Safety Instructions .............................................................................................. 3
2. General Description of Solar System ................................................................ 5
3. General information - Batteries ........................................................................ 8
4. Principle of Operation & Features ................................................................... 21
5. Construction, Layout and Controls .................................................................. 33
6. Installation and Operation .............................................................................. 38
7. Troubleshooting ............................................................................................... 47
8. Specications .................................................................................................... 49
9. Warranty ........................................................................................................... 51
INDEX
Disclaimer of Liability
UNLESS SPECIFICALLY AGREED TO IN WRITING, SAMLEX AMERICA, INC.:
1. MAKES NO WARRANTY AS TO THE ACCURACY, SUFFICIENCY OR SUITABILITY OF ANY TECHNICAL OR OTHER INFORMATION PROVIDED
IN ITS MANUALS OR OTHER DOCUMENTATION.
2. ASSUMES NO RESPONSIBILITY OR LIABILITY FOR LOSSES, DAMAGES, COSTS OR EXPENSES, WHETHER SPECIAL, DIRECT, INDIRECT,
CONSEQUENTIAL OR INCIDENTAL, WHICH MIGHT ARISE OUT OF THE USE OF SUCH INFORMATION. THE USE OF ANY SUCH
INFORMATION WILL BE ENTIRELY AT THE USERS RISK.
Samlex America reserves the right to revise this document and to periodically make changes to the content hereof without
obligation or organization of such revisions or changes.
Copyright Notice/Notice of Copyright
Copyright © 2016 by Samlex America, Inc. All rights reserved. Permission to copy, distribute and/or modify this document is
prohibited without express written permission by Samlex America, Inc.

3
1
SAFETY INSTRUCTIONS
Please read these instructions before installing or operating the Charge Controller to prevent personal
injury or damage to the Charge Controller.
General
Installation and wiring compliance
• Installation and wiring must comply with the local and National Electrical Codes and must be
done by a certied electrician.
Preventing electrical shock
• The negative system conductor should be properly grounded. Grounding should comply with
local codes.
• Disassembly / repair should be carried out by qualied personnel only.
• Disconnect all input and output side connections before working on any circuits associated
with the Charge Controller. Turning the on/off control on the Charge Controller to off
position may not entirely remove dangerousVoltages.
• Be careful when touching bare terminals of capacitors. The capacitors may retain high
lethalVoltages even after the power has been removed. Discharge the capacitors before
working on the circuits.
Installation environment
• The Charge Controller should be installed indoor only in a well ventilated, cool, dry
environment.
• Do not expose to moisture, rain, snow or liquids of any type.
Preventing re and explosion hazards
• Working with the Charge Controller may produce arcs or sparks. Thus, the Charge Controller
should not be used in areas where there are inammable materials or gases requiring
ignition protected equip ment. These areas may include spaces containing gasoline powered
machinery, fuel tanks, battery compartments.
Precautions when working with batteries
• Batteries contain very corrosive, diluted sulphuric acid as electrolyte. Precautions should be
taken to prevent contact with skin, eyes or clothing.
• Batteries generate hydrogen and oxygen during charging, resulting in evolution of explosive
gas mixture. Care should be taken to ventilate the battery area and follow the battery
manufacturer’s recommendations.
• Never smoke or allow a spark or ame near the batteries.
• Use caution to reduce the risk of dropping a metal tool on the battery. It could spark or short
circuit the battery or other electrical parts and could cause an explosion.
• Remove metal items like rings, bracelets and watches when working with batteries. The

4
1
SAFETY INSTRUCTIONS
batteries can produce a short circuit current high enough to weld a ring or the like to metal
and cause a severe burn.
• If you need to remove a battery, always remove the ground terminal from the battery rst.
Make sure that all the accessories are off so that you do not cause a spark.
Charge Controller related
• Please ensure the inputVoltage fed to the Charge Controller does not exceed 50 VDC to
prevent permanent damage to the Charge Controller. Ensure that the maximum Open Circuit
Voltage Voc of the 12V nominal Solar Panel / Solar Array is less than 50V. If two 12V nominal
Solar Panels are being used in series to make a 24 V nominal Solar Array, make sure that the
maximum Open Circuit Voltage Voc of each of the 12 V Panels is less than 25V.
• Do not exceed the maximum current rating of 30 A. The Short Circuit Current of the Solar
Array should be less than 30A.
• Do not exceed a Battery Voltage of 24V (nominal) . Do not use a battery less than 12V.
• Charge only 12 or 24V Lead-Acid batteries when using the standard battery charging
programs or Ni-Cd batteries when DIP Switch number 2~4 is in the ON position.
• DO NOT short circuit the PV array or load while connected to the controller. This will damage
the controller.
• The controller should be protected from direct sunlight. Ensure adequate space for air ow
around the controller’s face plate.
• Do not install in a sealed compartment with batteries.
• Never allow the solar array to be connected to the controller with the battery disconnected.
This can be a dangerous condition with high open-circuit solarVoltage present at the
terminals.
• Use only copper wire with minimum 75°C insulation rating, and between 10 AWG (5.2 mm
2
)
and 14 AWG (2.1 mm
2
) gauge.
• The Negative system conductor should be properly grounded. Grounding should comply with
local codes.

5
2
General Description of solar system
Current (I),Voltage (V) and Power (P) Curves of a Solar Panel and how
the Solar Panel is rated - V
oc
, Vmp , I
sc ,
Imp , Pmax
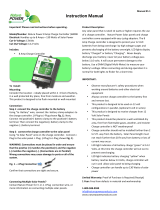
Fig. 2.1. Current (I),Voltage (V) and Power (P) Curves
A Current (I) versus Voltage (V) Curve of a Solar Panel (“I-V” Curve) shows the possible
combinations of its current and Voltage outputs. A typical I-V curve for a 12V Panel is
shown in Fig. 2.1.
The power in a DC electrical circuit is the product of the Voltage and the current.
Mathematically,
• Power (P) in Watts (W) = The Current (I) in Amperes (A) X the Voltage (V) in Volts (V)
i.e. W = V x A
A Solar Panel produces its maximum current when there is no resistance in the circuit,
i.e. when there is a short circuit between its Positive and Negative terminals. This
maximum current is known as the Short Circuit Current and is abbreviated as I
sc
. When
the Panel is shorted, the Voltage in the circuit is zero.
Conversely, the maximum Voltage occurs when there is a break in the circuit. This is
called the Open Circuit Voltage (V
oc
). Under this condition, the resistance is innitely
high and there is no current, since the circuit is incomplete. Typical value of the open-
circuit Voltage is located about 0.5 – 0.6V per cell for Crystalline Cells and 0.6 – 0.9V
for Amorphous Cells. Normally, 12V nominal panel consists of 36 cells in series and a
24V nominal panel consists of 72 cells in series. Hence, the Open Circuit Voltage (V
oc
)
of panels with crystalline cells will be as follows:
- 12V panel: 36 cells x (0.5 to 0.6V per cell) = 18V to 21.6V
- 24V panel: 72 cells x (0.5 to 0.6V per cell) = 36V to 43.2V
These two extremes in load resistance, and the whole range of conditions in between
them, are depicted on the I-V Curve. Current, expressed in Amps, is on the vertical
Y-axis.Voltage, inV, is on the horizontal X-axis.

6
2
General Description of solar system
The power available from a photovoltaic device at any point along the curve is just the
product of Current (I) in Amps (A) and voltages (V) at that point and is expressed in
Watts. At the short circuit current point, the power output is zero, since the voltage is
zero. At the open Circuit Voltage point, the power output is also zero, but this time it
is because the current is zero.
Maximum Power Point and Rated Power of Solar Panel
There is a point on the knee of the I-V Curve where the maximum power output is
located and this point is called the Maximum Power Point (MPP). The voltage and
current at this Maximum Power Point are designated as Vmp and Imp.
The values of Vmp and Imp can be estimated from V
oc
and I
sc
as follows:
Vmp ≈ (0.75 – 0.9) V
oc
Imp ≈ (0.85 – 0.95) I
sc
The rated power of the Solar Panel in Watts (Pmax) is derived from the above values
of voltage Vmp and current Imp at this Maximum Power Point (MPP):
• Rated power in Watts, Pmax = Vmp X Imp
Example of I-V Curve and Ratings of a 12V Solar Panel
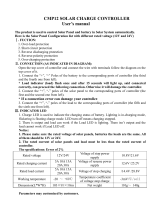
Fig. 2.2. Example of I-V Curve and Ratings of a 12V PV / Solar Panel
= 2.5A
= 17A
=
=
= 2.7A
= 21V

7
2
General Description of solar system
I-V Curve for a typical 12V Solar Panel is shown in Fig. 2.2. The Open Circuit Voltage
V
oc
is 21V and the Short Circuit Current I
sc
= 2.7V.
Maximum Power Point in the example curve given above is where Vmp is 17V, and the
current Imp is 2.5A. Therefore, the rated or the maximum power Pmax in watts is 17V
times 2.5A, or 42.5 Watts.
Standard Test Conditions (STC) for Specifying Solar Panels
The I-V curve is also used to compare the performance of Solar Panel. The curve is,
therefore, generated based on the performance under Standard Test Conditions (STC)
of sunlight and device temperature of 25°C. It assumes there is no shading on the
device. Standard sunlight conditions on a clear day are assumed to be 1,000 Watts of
solar energy per square meter (1000 W/m
2
or 1 kW/m
2
). This is sometimes called one
sun, or a peak sun. Less than one sun will reduce the current output of the PV device
by a proportional amount. For example, if only one-half sun: (500 W/m
2
) is available,
the amount of output current is roughly cut in half.
Factors Affecting Voltage and Current Output of Solar Cell
The amount of electric current generated by photon excitation in a Solar Cell at a
given temperature is affected by the incident light in two ways:
• By the intensity of the incident light.
• By the wavelength of the incident rays.
The materials used in Solar Cells have different spectral responses to incident light,
and exhibit a varying sensitivity with respect to the absorption of photons at given
wavelengths.Each semiconductor material will have an incident radiation threshold
frequency, below which no electrons will be subjected to the photovoltaic effect.
Above the threshold frequency, the kinetic energy of the emitted photoelectron
varies according to the wavelength of the incident radiation, but has no relation
to the light intensity. Increasing light intensity will proportionally increase the rate
of photoelectron emission in the photovoltaic material. In actual applications, the
light absorbed by a solar cell will be a combination of direct solar radiation, as well
as diffused light bounced off of surrounding surfaces. Solar Cells are usually coated
with anti-reective material so that they absorb the maximum amount of radiation
possible.
The output current of the Solar Panel can increase due to what is known as the “Edge
of the Cloud Effect”. As the sun moves into a hole between the clouds, your solar
panels will see full direct sunlight combined with reected light from the clouds! They
will absorb more energy than they could on a cloudless day! Thus, a factor of 1.25
times the Short Circuit Current Isc is recommended when sizing the current capacity
of the Charge Controller.

8
2
General Description of solar system
The output current of the Solar Cell has a Positive Temperature Coefcient – the
output current increases with the rise of temperature. However, it is negligible – less
than 0.1 % / °C of the Short Circuit Current Isc.
The output Voltage of the Solar Cell has a Negative Temperature Coefcient – The
output Voltage increases with decrease in temperature. For example, a Silicon Cell has
a Temperature Coefcient of – 2.3 mV / °C / Cell. Hence, during cold winter days, the
voltage will rise.
As a Rule of Thumb, the voltage rating of the Charge Controller should be
sized as 1.25 times the Open Circuit Voltage rating Voc of the Solar Panel to ensure that the
Charge Controller is not damaged due to over voltage.
Battery Types
There are several different types of battery chemistries like Lead-Acid, Nickel-Iron
(Ni-Fe), Nickel-Cadmium (Ni-Cad) etc. Batteries consist of individual cells connected in
series to obtain the required Battery Voltage. Batteries are either sealed (also called
Valve Regulated Lead Acid - VRLA) or non-sealed / vented / ooded / wet cell.
Nickel-Iron (Ni-Fe) and Nickel-Cadmium (Ni-Cad) Battery
Nickel-Iron (Ni-Fe) and Nickel-Cadmium (Ni-Cad) (also called alkaline batteries) have a
nominal cell Voltage of 1.2V per cell. The nominalVoltage of a Ni-Cad / Ni-Fe battery
bank can be made the same as a lead acid bank just by juggling the number of cells
(10 cells for 12V, 20 cells for 24V and 40 cells for 48V systems). However, the Ni-Cad /
Ni-Fe battery bank must be charged to a higherVoltage to fully recharge and will drop
to a lower voltage during discharging compared to a similarly sized lead acid type
battery.
Lead Acid Battery
A Lead Acid battery consists of a number of 2V nominal cells (actual voltage of the
cell is 2.105V) that are connected in series e.g. a 12V nominal battery will have six, 2V
nominal cells in series (actual voltage of the 6 cells will be 2.105 x 6 = 12.63 ).
Each 2V nominal cell in this battery consists of an independent enclosed compartment
that has Positive and Negative Plates (also called Electrodes) dipped in electrolyte
that is composed of diluted Sulphuric Acid – solution of 33.5% v/v Sulphuric Acid and
water. *The Positive and Negative electrodes may be made of at plates, or may be made in a
spiral roll form to make cyclindrical/tubular cells. In a fully charged battery, the Positive Plate is in
the form of Lead Dioxide, the Negative Plate is in the form of Lead and the Sulphuric Acid in the
electrolyte has the maximum concentration of 33.5% v/v.
Construction of Battery Cell Plates -
Lead Antimony and Lead Calcium Batteries
During construction, both the Positive and the Negative plates are similar.
3
GENERAL INFORMATION: BATTERIEs

9
3
GENERAL INFORMATION: BATTERIEs
Both the plates consist of a rectangular grid made out of alloyed Lead with
rectangular holes in it as shown in Fig 3.1 below:
Fig 3.1. Grid structure of Positive and Negative Plates in a Lead Acid Battery
The holes in the grid of the plates are lled with a paste of active material made out
of a mixture of Red Lead and 33% dilute Sulphuric Acid (different manufacturers
use modied mixtures). The paste is pressed into the holes in the grid. This paste
remains porous and allows the Sulphuric Acid in the electrolyte to react with the
lead inside the plate increasing the surface area many fold. At this stage, the Positive
and Negative plates are identical. Once dry, the plates are then stacked together
with suitable separators and inserted in the battery container. After the electrolyte
has been added to the cell, the cell is given its rst “Forming Charge”. During this
“Forming Charge”, the Lead paste in the Positive plate gradually turns to Lead
Dioxide (chocolate brown color), and the Lead paste in the Negative plate turns to
Sponge Lead (slate gray color). Such charged cell is ready to be used.
The above grid structure of the plates is made from a Lead alloy. A pure Lead grid
structure is not strong enough by itself to stand vertically while supporting the active
material. Other metals in small quantities are alloyed with Lead for added strength
and improved electrical properties. The most commonly alloyed metals are Antimony,
Calcium, Tin, and Selenium.
The two most common alloys used today to harden the grid are Antimony and
Calcium. Batteries with these types of grids are sometimes called “Lead-Antimony”
and & “Lead-Calcium” batteries. Tin is added to Lead-Calcium grids to improve
cyclability
The major differences between batteries with Lead-Antimony and Lead-Calcium grids
are as follows:
• Lead-Antimony batteries can be deep cycled more times than Lead-Calcium batteries.
• Flooded Lead-Antimony batteries require more frequent maintenance as they near end-of-
life since they use an increasing amount of water and require periodic equalization charges.

10
3
GENERAL INFORMATION: BATTERIEs
• Lead-Calcium batteries have lower self-discharge rates and therefore, will draw less current
while kept in storage
Electrochemical Reactions during Charging and Discharging
of Lead Acid Battery
Electrical power in the Lead Acid Battery is produced by reversible electrochemical
reactions as follows:
During discharging, the Sulphuric Acid in the electrolyte reacts with the Positive and
Negative plates resulting in conversion of the active materials in the two plates to
Lead Sulphate. At the same time, electrons are released that create the electrical
current that ows to the load. The concentration of Sulphuric Acid in the electrolyte is
reduced as the battery gets discharged (the electrolyte becomes pure water when the
battery is fully discharged).
During charging, reverse electrochemical reactions take place. Under the inuence
of the charging voltage fed to the battery by the external battery charger / charge
controller, electrons are fed back to the battery and the Lead Sulphate at the Positive
and Negative Plates is converted back to Lead Dioxide at the Positive Plate and Lead
at the Negative Plate and the concentration of Sulphuric Acid is restored (will revert to
33.5% v/v when the battery is fully charged).
Gassing Due to Excessive Overcharging
During charging, the battery is required to be charged in a controlled manner in the
nal Absorption Stage (2.4V per cell at 25ºC / 77ºF or 14.4V for a 12V battery at 25ºC
/ 77ºF) that restores the last 20% to 30% of the capacity. On completion of this stage
of charging, the Lead Sulphate at the Positive and Negative Plates is fully converted
back to Lead Dioxide at the Positive Plate and Lead at the Negative Plate. Any further
charging at this voltage or higher than this voltage results in electrolysis of water in
the electrolyte to Hydrogen and Oxygen and this undesirable condition contributes to
waste of energy. This process is known as “gassing”. Gassing is also produced during
the timed Equalization Stage (normally performed only for vented /ooded / wet
cell batteries) when the battery is intentionally overcharged (2.5 to 2.6V per cell / 15
to 15.6V for 12V batteries and 30 to 31.2V for 24V batteries) so that weaker cells are
brought up to the full charge too (equalized).
Non-sealed / vented / ooded / wet cell batteries have open vents to release Hydrogen
and Oxygen produced during gassing. The above un-intentional electrolysis of water
during overcharging results in loss of water and reduces the level of the electrolyte in
this type of batteries. When the level of the electrolyte is reduced, the upper portion
of the plates in the cells will not be immersed in the electrolyte and will result in loss
of battery capacity. Hence, these types of batteries are required to be topped up with
distilled water periodically to ensure that the plates in the cells are fully immersed
in the electrolyte. Some non-sealed / vented / ooded / wet cell batteries come with
catalytic caps to recombine any emitted Hydrogen and Oxygen.

11
3
GENERAL INFORMATION: BATTERIEs
Sealed / VRLA batteries are designed to recombine the Hydrogen and Oxygen back
into water and hence, Sealed / VRLA batteries are not required to be topped up with
distilled water. That is why, these batteries are also called maintenance free batteries.
Sealed / VRLA batteries use safety valves to release any excessive gas pressure built
up inside the battery due to malfunction or overheating. If this happens (e.g.,
by overcharging) the valve vents the gas and normalizes the pressure, producing
a characteristic acid smell. Valves can sometimes fail however, if dirt and debris
accumulate, allowing pressure to build up that will result in damage to the battery.
Sealed Lead Acid (SLA) or Valve regulated Lead Acid (VRLA) Batteries
Sealed Lead Acid (SLA) batteries or Valve Regulated Lead Acid (VRLA) batteries can
either be Gel Cell or AGM (Absorbed Glass Mat). In a Gel Cell battery, the electrolyte
is in the form of a gel. In AGM (Absorbed Glass Mat) battery, the electrolyte is soaked
in Glass Mat. In both these types, the electrolyte is immobile. There are no rell caps
and the battery is totally sealed. Hydrogen and Oxygen released during the charging
process are not allowed to escape and are recombined inside the battery. Hence, there
is no water loss and the batteries are maintenance free. These batteries have safety
valves on each cell to release excessive pressure that may be built up inside the cell.
The Gel Cell is the least affected by temperature extremes, storage at low state of
charge and has a low rate of self discharge. An AGM battery will handle overcharging
slightly better than the Gel Cell.
Non Sealed (Vented / Flooded / Wet Cell) Lead Acid Batteries
In a non-sealed / vented / ooded / wet cell battery, each individual cell compartment
has a rell cap that is used to top up the cell with distilled water and to measure
the specic gravity of the electrolyte using a hydrometer. When fully charged, each
individual cell has a voltage of approximately 2.105V and electrolyte specic gravity
of 1.265. As the cell discharges, its voltage and specic gravity drop. Thus, a healthy,
fully charged, 12V nominal battery with each of the 6 cells fully charged to 2.105V
will measure a Standing Voltage of 12.63V at 25ºC / 77ºF. Also, in a healthy battery,
all the individual cells will have the same voltage and same specic gravity. If there is
a substantial difference in the voltages (0.2V or higher) and specic gravities of the
individual cells, the cells will require equalization.
sLI (starting, Lighting, Ignition) Batteries
Everybody is familiar with the SLI batteries that are used for automotive starting,
lighting, ignition and powering vehicular accessories. SLI batteries are designed to
produce high power in short bursts for cranking. SLI batteries use lots of thin plates
to maximize the surface area of the battery for providing very large bursts of current
(also specied as Cranking Amps). This allows very high starting current but causes
the plates to warp when the battery is cycled. Vehicle starting typically discharges 1%-
3% of a healthy SLI battery’s capacity. The automotive SLI battery is not designed for
repeated deep discharge where up to 80% of the battery capacity is discharged and

12
3
GENERAL INFORMATION: BATTERIEs
then recharged. If an SLI battery is used for this type of deep discharge application,
its useful service life will be drastically reduced.
This type of battery is not recommended for the storage of energy for DC powered
devices like lighting, radios, inverters, etc. However, they are recommended as
starting battery for the back-up generator.
Deep Cycle Lead Acid Batteries
Deep cycle batteries are designed with thick-plate electrodes to serve as primary
power sources, to have a constant discharge rate, to have the capability to be
deeply discharged up to 80% capacity and to repeatedly accept recharging. They are
marketed for use in recreation vehicles (RV), boats and electric golf carts – so they may
be referred to as RV batteries, marine batteries or golf cart batteries.
Units of Battery Capacity – Ampere Hours (Ah) and Reserve Minutes (RC)
Battery capacity is the measure of electrical energy the battery can store and deliver
to a load. It is determined by the amount of current any given battery can deliver
over a stipulated period of time. The energy rating is expressed in Ampere Hours (Ah).
Normally, Ah capacity is rated at 20 Hour discharge rate i.e., the number of Amperes of
current the battery can deliver for 20 Hours at 80ºF (26.7ºC) till the voltage drops to 10.5V
for 12V battery and 21V for 24V battery. For example, a 100 Ah battery will deliver 5
Amperes for 20 Hours.
Battery capacity is also expressed as Reserve Capacity (RC) in minutes. Reserve capacity
is the time in minutes for which the battery can deliver 25 Amperes at 80ºF (26.7ºC)
till the voltage drops to 10.5V for 12V battery and 21V for 24V battery. Approximate
relationship between the two units is as follows:
Capacity in Ah = Reserve Capacity in RC minutes x 0.6
Typical Battery Sizes
The Table below shows details of some popular battery sizes:
BCI* GROUP BATTERY VOLTAGE, V BATTERY CAPACITY, Ah
27 / 31 12 105
4 D 12 160
8D 12 225
GC2** 6 220
* Battery Council International ** Golf Cart
Table 3.1. Popular Battery Sizes

13
3
GENERAL INFORMATION: BATTERIEs
Reduction in Usable Capacity at Higher Discharge Rates
As stated above, the rated capacity of the battery in Ah is normally applicable at a
discharge rate of 20 Hours. As the discharge rate is increased, the usable capacity
reduces due to “Peukert Effect”. This relationship is not linear but is more or less
according to the Table below:
HOURS OF
DISCHARGE
DISCHARGE
RATE
DISCHARGE RATE
FOR 100Ah BATTERY
USABLE
CAPACITY
20 Hrs. C/20 A 5A 100 %
10 Hrs. C/10 A 10A 87 %
8 Hrs. C/8 A 12.5A 83 %
6 Hrs. C/6 A 16.7A 75 %
5 Hrs. C/5 A 20A 70 %
3 Hrs. C/3 A 33.3A 60 %
2 Hrs. C/2 A 50A 50 %
1 Hrs. C A 100A 40 %
Table 3.2. Battery Capacity versus Rate of Discharge
Using the above Table will show that a 100 Ah capacity battery will deliver 100% (i.e.
full 100 Ah) capacity if it is slowly discharged over 20 hours at the rate of C/20 A or 5A.
However, if it is discharged at a rate of 2 Hrs. (C/2A or 50A) then theoretically, it should
provide 100 Ah ÷ 50A = 2 Hours. However, the Table above shows that for 2 Hours
discharge rate (C/2A or 50A), the capacity is reduced to 50% (i.e. 50 Ah). Therefore, at
50 Ampere discharge rate the battery will actually last for 50 Ah ÷ 50A = 1 Hour.
State of Charge (SOC) of a Battery
The “Standing Voltage” of a battery can approximately indicate the State of Charge
(SOC) of the battery. The “Standing Voltage” is measured after disconnecting any
charging device(s) and the battery load(s) and letting the battery “stand” idle for
3 to 8 hours before the voltage measurement is taken. Table 3.3 shows the State of
Charge versus Standing Voltage for a 12V battery system (6 cells in series) at around
80ºF (26.7ºC). For 24-volt systems, multiply by 2 (12 cells in series); for 48-volt systems,
multiply by 4 (24 cells in series).

14
3
GENERAL INFORMATION: BATTERIEs
PERCENTAGE OF
FULL CHARGE
STANDING VOLTAGE OF
12V NOMINAL BATTERY
Cell Voltage (12V BATTERY
HAS 6 CELLS IN SERIES)
100% 12.63V 2.105V
90% 12.6V 2.10V
80% 12.5V 2.08V
70% 12.3V 2.05V
60% 12.2V 2.03V
50% 12.1V 2.02V
40%
12.0V 2.00V
30% 11.8V 1.97V
20% 11.7V 1.95V
10% 11.6V 1.93V
0% = / < 11.6V = / < 1.93V
Table 3.3. State of Charge versus Standing Voltage – 12V Battery
Check the individual cell Voltages. If the inter cell Voltage difference is more than a
0.2V, the battery will have to be equalized. Please note that only the non-sealed /
vented / ooded / wet cell batteries are equalized. Do not equalize sealed / VRLA type
of AGM or Gel Cell Batteries (unless allowed by the manufacturer).
Battery Efciency
A lead-acid battery has an efciency of only 75% - 85%. The energy lost appears as
heat and warms the battery. This means that the Ampere Hour (Ah) energy required
to charge a battery to its full rated capacity will be approximately 120% to 130%
higher than the Ah capacity rating of the battery.
Depth of Discharge and Battery Life
The more deeply a battery is discharged on each cycle, the shorter the battery life.
Using more batteries than the minimum required will result in longer life for the
battery bank. A typical life cycle chart is given in the Table below:
Table 3.4. Typical Cycle Life Chart
DEPTH OF DISCHARGE
% OF Ah CAPACITY
CYCLE LIFE OF
GROUP 27 / 31
CYCLE LIFE OF
GROUP 8D
CYCLE LIFE OF
GROUP GC2
10 1000 1500 3800
50 320 480 1100
80 200 300 675
100 150 225 550
It is recommended that the depth of discharge should be limited to 50%.

15
3
GENERAL INFORMATION: BATTERIEs
Effect of Temperature on Battery Voltage
The temperature of the electrolyte affects the rate of chemical reactions in the
batteries as well as the rate of diffusion and the resistivity of the electrolyte.
Therefore, the charging characteristics of the battery will vary with temperature. This
is nearly linear and the Voltage Coefcient of Temperature Change is normally taken
as -3 mV to -5 mV / ºC / Cell. Please note that the Voltage Coefcient of Temperature
Change is negative. This means that as the temperature rises, the charging voltage is
required to be reduced and as the temperature is decreased, the charging voltage has
to be increased.
All charging voltage set points are normally specied at 25ºC / 77ºF. In solar
systems, battery temperatures often vary up to 15ºC from the 25ºC reference. The
Absorption, Float and Equalization Voltages must then be adjusted or a controller
with Temperature Sensor should be used. Table below shows example of adjustments
for Absorption Voltage of say 14.4V for 12V battery, (based on Voltage Coefcient of
Temperature Change as -5 mV / ºC / Cell or -30mV (.03V) for a 6 cell, 12V battery).
BATTERY TEMPERATURE ABSORPTION VOLTAGE (12V BATTERY)
40ºC 13.95V
25ºC (Reference) 14.4V (Reference)
10ºC
14.85V
In case temperature compensation is not provided, the warmer battery at 40ºC will
begin to heat and outgas at 13.95V and will continue to overcharge until the non-
compensated Absorption Voltage set point is reached (14.4V). In cooler temperatures,
the 10ºC battery will experience severe undercharging, resulting in sulfation.
It is recommended that a battery charger / charge controller with a provision for
temperature sensing and compensation should be used if the battery electrolyte
temperature varies more than 5ºC to 10ºC (9ºF to 18ºF).
Self-discharge
The battery discharges itself even without any load connected to it. This effect is
caused by secondary reactions at its electrodes and proceeds faster with higher
temperature or in older batteries. Thermodynamic instability of the active materials
and electrolytes as well as internal and external short-circuits lead to capacity losses,
which are dened as self-discharge. This loss should be small, particularly in respect of
annual storage. Self discharge (% of loss of capacity per month) for various types of
batteries is as follows:
• Lead Acid 3% to 4%
• Ni-Cd 6% to 20%
• Ni-Fe 40%

16
3
GENERAL INFORMATION: BATTERIEs
Loss of Battery Capacity at Low Temperatures
Batteries lose capacity in low temperatures. At 32ºF (0ºC), a battery will deliver about
70 to 80% of its rated capacity at 80ºF (26.7ºC). If the electrolyte temperature of
the battery bank is lower than 80ºF (26.7ºC), additional batteries will be needed to
provide the same usable capacity. For very cold climates, an insulated / heated battery
compartment is recommended.
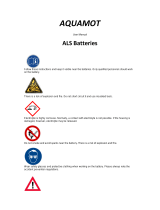
Freezing of Electrolyte
For applications with low ambient temperature, the lead-acid battery must also be
protected against freezing of the electrolyte. The risk of freezing depends on the state
of charge. The chart given below illustrates the freezing limit as a function of the state
of charge.
- 80°
- 60°
- 40°
- 20°
0°
0 20 40 60 80 100
State of charge [%]
Temperature [° C]
slushy until hard
- 80°
- 60°
- 40°
- 20°
0°
0 20 40 60 80 100
State of charge [%]
Temperature [° C]
slushy until hard
Series and Parallel Connection of Batteries
Series Connection
Solar Charge Controller
SCC30-AB (rear view)
PV +
PV -
BAT +
BAT -
6V Battery 6V Battery
Battery 4 Battery 3
6V Battery
Battery 2
6V Battery
Battery 1
6V Battery
Cable “A”
Cable “B”
Fig. 3.2. Series Connection
When two or more batteries are connected in series, their voltages add up, but their
Ah capacity remains the same. Fig. 3.2 above shows 4 pieces of 6V, 200 Ah batteries
connected in series to form a battery bank of 24V with a capacity of 200 Ah. The
Positive terminal of Battery 4 becomes the Positive terminal of the 24V bank. The
Negative terminal of Battery 4 is connected to the Positive terminal of Battery 3. The
State of Charge (%)
Temperature (ºC)

17
3
GENERAL INFORMATION: BATTERIEs
Negative terminal of Battery 3 is connected to the Positive terminal of Battery 2. The
Negative terminal of Battery 2 is connected to the Positive terminal of Battery 1. The
Negative terminal of Battery 1 becomes the Negative terminal of the 24V battery
bank.
Parallel Connection
Solar Charge Controller
SCC30-AB (rear view)
PV +
PV -
BAT +
BAT -
12V Battery 12V Battery 12V Battery 12V Battery
Battery 1 Battery 3Battery 2 Battery 4
Cable “A”
Cable “B”
Fig. 3.3. Parallel Connection
When two or more batteries are connected in parallel, their voltage remains the same
but their Ah capacities add up. Fig. 3.3 above shows 4 pieces of 12V, 100 Ah batteries
connected in parallel to form a battery bank of 12V with a capacity of 400 Ah. The
four Positive terminals of Batteries 1 to 4 are paralleled (connected together) and this
common Positive connection becomes the Positive terminal of the 12V bank. Similarly,
the four Negative terminals of Batteries 1 to 4 are paralleled (connected together)
and this common Negative connection becomes the Negative terminal of the 12V
battery bank.
Series – Parallel Connection
Solar Charge Controller
SCC30-AB (rear view)
PV +
PV -
BAT +
BAT -
6V Battery 6V Battery 6V Battery 6V Battery
String 1 String 2
Battery 1 Battery 3Battery 2 Battery 4
Cable “A”
Cable “B”
Fig. 3.4. Series-Parallel Connection
Figure 3.4 above shows a series – parallel connection consisting of four 6V, 200 Ah
batteries to form a 12V, 400 Ah battery bank. Two 6V, 200 Ah batteries, Batteries 1
and 2 are connected in series to form a 12V, 200 Ah battery (String 1). Similarly, two
6V, 200 Ah batteries, Batteries 3 and 4 are connected in series to form a 12V, 200 Ah
battery (String 2). These two 12V, 200 Ah Strings 1 and 2 are connected in parallel to
form a 12V, 400 Ah bank.

18
3
GENERAL INFORMATION: BATTERIEs
Caution!
When 2 or more batteries / battery strings are connected in parallel and are then
connected to a charger (See Fig. 3.3 and 3.4), attention should be paid to the
manner in which the charger is connected to the battery bank. Please ensure that
if the Positive output cable of the battery charger (Cable “A”) is connected to the
Positive battery post of the rst battery (Battery 1 in Fig. 3.3) or to the Positive
battery post of the rst battery string (Battery 1 of String 1 in Fig. 3.4), then the
Negative output cable of the battery charger (Cable “B”) should be connected
to the Negative battery post of the last battery (Battery 4 as in Fig. 3.3) or to the
Negative Post of the last battery string (Battery 4 of Battery String 2 as in Fig.
3.4). This connection ensures the following:
• The resistances of the interconnecting cables will be balanced.
• All the individual batteries / battery strings will see the same series resistance.
• All the individual batteries will charge at the same charging current and thus, will be
charged to the same state at the same time.
• None of the batteries will see an overcharge condition.
If the Positive output cable of the battery charger (Cable “A”) is connected to the
Positive battery post of the rst battery (Battery 1 in Fig. 3.3) or to the Positive
battery post of the rst battery string (Battery 1 of String 1 in Fig. 3.4), and the
Negative output cable of the battery charger (Cable “B”) is connected to the
Negative battery post of the rst battery (Battery 1 as in Fig. 3.3) or to
the Negative Post of the rst battery string (Battery 1 of Battery String 1 as in
Fig. 3.4), the following abnormal conditions will result:
• The resistances of the connecting cables will not be balanced.
• The individual batteries will see different series resistances.
• All the individual batteries will be charged at different charging current and thus, will
reach fully charged state at different times.
• The battery with lower series resistance will take shorter time to charge as compared to
the battery which sees higher series resistance and hence, will experience over charging
and its life will be reduced.
Sizing the Battery Bank
The capacity of the battery bank in Ampere Hours (Ah) is determined based on the
amount of energy that is required to be provided for operating the desired DC and AC
loads for desired span of time in hours.

19
3
GENERAL INFORMATION: BATTERIEs
For example, backup energy may be required for say 4 hours or 1 day (24 Hours) or 3
days (72 Hours). In this connection, the following formulae will be applicable:
FORMULA 1 DC Power in Watts (W) DC Volts (V) x DC Current (A)
FORMULA 2 AC Power in Watts (W)
AC Volts (V) x AC Current (A) x Power
Factor (0.8 Typical)
FORMULA 3
DC Power drawn from the
battery by DC load fed
directly from the battery
Power of DC load in Watts (W)
FORMULA 4
DC Power drawn from the
Battery by AC load fed from
DC-AC inverter
1.2 x Power of AC load in Watts (W)
(Assuming typical efciency of
inverter = 84%)
FORMULA 5
Energy consumption from
the battery in Watt Hour
(Wh)
Power in Watts (W) x Time in Hours (h)
FORMULA 6
Energy consumption from
the battery in Ampere Hour
(Ah)
12V
Battery
Energy consumption in
Watt-Hour (Wh) ÷ 12
24V
Battery
Energy consumption in
Watt-Hour (Wh) ÷ 24
Determining Total Battery Energy Consumption – First step is to determine the total
battery energy consumption in Ampere Hours for running the desired AC and DC
loads during the desired span of backup time:
a) Find out the power rating of each AC and DC device in Watts (W). If Watt rating is not available,
calculate the Watt rating using Formulae 1 or 2.
b) Determine / calculate the power drawn from the battery in Watts (W) by each of the AC and DC
devices. For DC devices, this will be the same as its DC Power rating (Formula 3). For AC devices
powered from DC to AC inverter, use Formula 4 to calculate the power drawn in Watts (W) from
the battery.
c) Calculate the energy consumption in Watt-Hours (Wh) for each load using Formula 5 based on
the number of hours each load is expected to run during the desired span of backup time. Add
all to get the total energy in Watt Hours (Wh).
d) Calculate the total battery energy consumption in Ampere Hours (Ah) for the combined DC and
AC loads using Formula 6.
Determining Actual Ah Capacity of Battery Bank – Actual Ah capacity of the battery
bank is determined based on the following considerations:
e) As pointed out under heading “Reduction in Usable Capacity at Higher Discharge Rates”
on page 13, the Ah capacity of a battery is normally specied at slower C/20 A i.e. 20 Hour
discharge rate. However, in backup applications, batteries get discharged at much higher
discharge
rates. Normally, 3 Hour i.e. C/3 A Discharge Rate is considered for this

20
3
GENERAL INFORMATION: BATTERIEs
application. As per Table 3.2 on page 13, the usable capacity at this higher discharge
rate will be reduced to 60%. The actual capacity of the battery will have to be
increased by 1.66 times.
f) Further, for longer battery life, the battery should not be discharged deeply (Please refer to
heading “Depth of Discharge and Battery Life” on page 14). Normally, depth of discharge
should be limited to 80%. Hence, the actual battery capacity will have to be increased to 1.25
times the backup energy consumption to compensate for this limitation.
g) The actual battery capacity will, therefore, be equal to 1.66 x 1.25 = 2.07 times or say 2 times.
h) For example, if the total battery energy consumption as per the above calculation at (d) is say
200 Ah, the capacity of the battery bank will be 2 x 200Ah = 400Ah..
Battery Charging Stages and Charging Currents
It is recommended that the batteries may be charged at 10% to 13 % of the Ampere
Hour capacity of the battery (20 Hour Discharge Rate). Also, for complete charging
(return of 100 % capacity), it is recommended that a 4 stage charger may be used:
• Constant Current Bulk Charging, followed by;
• Constant Voltage Boost / Absorption Charging, followed by;
• Constant Voltage Float Charging, followed by;
• Constant Voltage Equalization. Equalization is carried out only when some cells do not
charge fully and the individual cell Voltages differ by more than 0.2V cell. Also, equalization
is carried out only for non-sealed / vented / ooded / wet cell batteries.
Requirements of Battery Charging in Solar Systems
Batteries in Solar Systems are commonly subject to abusive conditions that are
generally due to:
• Under charging due to low sun peak hours
• Excessive charging in high sun peak hours
• Inappropriate or ineffective charge control for the battery technology
The individual or combined effects of sun peak hour changes, poor charge control and
the daily load changes can be potentially damaging to the battery. Cheaper charge
control strategies such as simple ON/OFF PV array shedding (Non PWM control) will
generally provide the battery with sufcient charging current to complete the Bulk
Charge Phase which will return the battery to 80% State of Charge. After the Bulk
Charge Phase, the Taper or Absorption Charge Phase is very important in preventing
stratication, hard sulfation and pre-mature capacity loss.
/