3M Hearing Protection DL DPR Operating instructions

Type
Operating instructions

3M Hearing Protection DL DPR provides a reliable solution for protecting your hearing in noisy environments. Engineered with advanced technology, it effectively reduces harmful noise levels while enhancing speech intelligibility. Ideal for industrial workplaces, construction sites, or any setting with excessive noise, it offers a comfortable and customized fit for optimal protection.

3M Hearing Protection DL DPR provides a reliable solution for protecting your hearing in noisy environments. Engineered with advanced technology, it effectively reduces harmful noise levels while enhancing speech intelligibility. Ideal for industrial workplaces, construction sites, or any setting with excessive noise, it offers a comfortable and customized fit for optimal protection.

Fourth in a comprehensive series of technical monographs covering topics related to hearing and hearing protection.
The Performance of Hearing Protectors in
Industrial Noise Environments
BY ELLIOTT H. BERGER
Senior Scientist, Auditory Research
Characterization of the attenuation prop-
erties of hearing protection devices
(HPDs) is most often accomplished in the
laboratory
1
by examining the perfor-
mance of trained and motivated subjects
using optimally fitted HPDs. The crucial
question is - How does this relate to the
real world? And the obvious answer -
poorly. Employees are seldom ad-
equately instructed in the correct utiliza-
tion of HPDs and even less often prop-
erly motivated to wear them. And if de-
vices come in multiple sizes or are un-
comfortable to wear, the problem is com-
pounded.
In the past few years a number of stud-
ies have been conducted that shed some
light on the matter of real world (RW)
performance, i.e. performance for em-
ployees in industrial noise environments.
In this, EARLog #4, we will discuss some
of the more significant findings, and inte-
grate the data to yield some interesting
conclusions.
Laboratory Approximations of Real
World Performance
When a HPD is tested in a laboratory,
the procedures, if modeled after actual
usage conditions, can yield results indica-
tive of RW performance. Waugh, of the
National Acoustic Laboratories (NAL) in
Australia, has attempted to do just that.
In a recent publication
2
, the NAL reports
attenuation data for 75 earmuffs and 19
inserts that were all tested at that facility.
The NAL has a subject pool consisting
of 35-40 of its employees. The HPDs are
tested on 15 people, 1 time each. Devices
undergo a series of physical tests (vibra-
tion, impact, temperature cycling, etc.)
prior to being tested for attenuation. Sub-
jects are given the manufacturers’ in-
structions and very little experimenter su-
pervision. The test procedure is an ab-
solute threshold shift method similar in
detail to the ANSI Z24.22
3
standard, with
the data corrected
4
to 1/3 octave-band
values.
The NAL tests yield lower mean attenu-
ations and higher standard deviations
than data gathered for manufacturers in
U.S. testing laboratories. As the follow-
ing discussion will show, the data from
NAL can be used to make good engineer-
ing approximations of the RW perfor-
mance of HPDs.
In-Field Measurements of Real
World Performance
An alternative approach to answering the
question of how well HPDs actually per-
form in use, is to take the threshold shift
experiment to the subject. At least three
experimenters have done this
5-9
by set-
ting up their measurement facilities at in-
dustrial plant sites and using noise ex-
posed employees as their subjects. Al-
though the employees were aware that
they would be subjects, they were not
aware of the exact times of their tests and
were carefully monitored to assure that
they did not readjust their protectors once
they had been notified to proceed to the
test booth.
The three studies that will be considered
included 613 subjects at 7 different plant
sites using 5 inserts and 1 earmuff. Al-
though the 3 studies varied in their exact
measurement techniques, appropriate
controls were incorporated to insure the
validity of the results.
In Figures 1-4 mean attenuation data for
4 devices as measured via different meth-
ods is presented. In Figure 1 we see very
good agreement between the NIOSH
5,6
and Padilla
9
field studies at 500 Hz
(Padilla only measured at 500 Hz). We
see that the field attenuation data are only
about 40-60% of the decibel values of the
manufacturer’s reported attenuation data.
NALs data fall between these two data
FREQUENCY in Hz (Cycles per Second)
REAL-EAR ATTENUATION (dB)
50
125
250
500
1000
2000
3000
4000
6000
8000
40
30
20
10
0
ATTENUATION DATA
FOR V-51R INSERT PROTECTOR
BY FOUR METHODS
Figure 1
MANUFACTURER'S DATA
NATIONAL ACOUSTIC LABORATORY
IN-FIELD DATA (NIOSH)
IN-FIELD DATA (PADILLA)
10
15
84
183
Subjects
FREQUENCY in Hz (Cycles per Second)
REAL-EAR ATTENUATION (dB)
50
125
250
500
1000
2000
3000
4000
6000
8000
40
30
20
10
0
ATTENUATION DATA FOR
SWEDISH WOOL INSERT PROTECTOR
BY THREE METHODS
Figure 2
MANUFACTURER'S DATA
NATIONAL ACOUSTIC LABORATORY
IN-FIELD DATA (NIOSH)
10
15
56
Subjects
sets, only about 5 dB above the field data,
except at the two highest frequencies.
Remember, although NAL uses very
minimal subject instruction, they do fit
multi-sized plugs correctly whereas it is
likely that missizing often occurs in the
field.
Figure 2 shows similar results, this time
for Swedish wool, with very good agree-
ment between NAL and field data, except
again at 4 kHz and 8 kHz.
Figure 3 compares Regans
7,8
field data
for an earmuff to NAL data. This time,
agreement is again good (within 4 dB)
except at 500 Hz where NAL data are
low. It is important to note that this result
shows that standard laboratory data also
overestimate the RW performance of
earmuffs. This has also been confirmed
in a soon to be released MSHA
10
study
that used miniature microphones to mea-
sure earmuff performance in the field. The
results indicated performance at only 20-
75% of the decibel values of the labora-
tory data with larger discrepancies at
lower frequencies.
Figure 4 shows comparison data for foam
earplugs (E-A-R
®
Plugs). The field data,
from Regan, are for foam earplugs that
were early prototypes, sold in limited
quantities, and considerably more diffi-
cult to use than the present model, avail-
able since 1974. His data were corrected
by 1 to 5 dB, by using laboratory data
comparing the prototype and current
model foam plugs. The corrected foam
data agree well with NAL data and dem-
onstrate attenuation of 60-90% of the
manufacturers reported data. Also of in-
terest in Figure 4, are the three points
marked by diamonds. These are prelimi-
nary data for 30 subjects from the E-A-R
Division Acoustics Laboratory. The data
were gathered in strict accordance with
ANSI S3.19,
11
procedures but with in-
structions and subject selection intended
to simulate RW conditions. Note the ex-
cellent agreement with the NAL data and
very good agreement with Regans field
data.
Figures 5 and 6 depict standard devia-
tion data for the various devices mea-
sured via the four test methods. The gen-
eral trend is for the field and NAL data to
be in reasonable agreement and both
somewhat higher than manufacturers
laboratory data. That this is not always
the case, is partially explained by the fact
FREQUENCY in Hz (Cycles per Second)
REAL-EAR ATTENUATION (dB)
50
125
250
500
1000
2000
3000
4000
6000
8000
40
30
20
10
0
ATTENUATION DATA
FOR EARMUFF PROTECTOR
BY THREE METHODS
Figure 3
MANUFACTURER'S DATA
NATIONAL ACOUSTIC LABORATORY
IN-FIELD DATA (REGAN)
10
15
5
Subjects
FREQUENCY in Hz (Cycles per Second)
REAL-EAR ATTENUATION (dB)
50
125
250
500
1000
2000
3000
4000
6000
8000
40
30
20
10
0
ATTENUATION DATA
FOR FOAM INSERT PROTECTOR
BY FOUR METHODS
Figure 4
MANUFACTURER'S DATA
NATIONAL ACOUSTIC LABORATORY
IN-FIELD* (REGAN)
E-A-R DIV. ACOUSTIC LABORATORY
IN-FIELD ESTIMATE
10
15
15
30
Subjects
*These data have been "corrected" See text.
FREQUENCY in Hz (Cycles per Second)
STANDARD DEVIATION OF THE
REAL-EAR ATTENUATION (dB)
20
125
250
500
1000
2000
3000
4000
6000
8000
10
0
20
10
0
STANDARD DEVIATION DATA
FOR TWO INSERT PROTECTORS
BY FOUR METHODS
Figure 5
MANUFACTURER'S DATA
NATIONAL ACOUSTIC LABORATORY
IN-FIELD (NIOSH)
IN-FIELD (PADILLA)
V-51R
SWEDISH WOOL
FREQUENCY in Hz (Cycles per Second)
STANDARD DEVIATION OF THE
REAL-EAR ATTENUATION (dB)
20
125
250
500
1000
2000
3000
4000
6000
8000
10
0
20
10
0
STANDARD DEVIATION DATA
FOR AN EARMUFF AND AN
INSERT BY FOUR METHODS
Figure 6
MANUFACTURER'S DATA
NATIONAL ACOUSTIC LABORATORY
IN-FIELD (REGAN)
E-A-R DIV. ACOUSTIC LABORATORY
IN-FIELD ESTIMATE
FOAM INSERT
EARMUFF
that the standard deviation tends to vary
in proportion to the mean attenuation, so
that devices with lower mean attenua-
tions have a reduced expected range of
attenuation values as well.
All subjects participating in the study had
been wearing the pre-molded inserts for
at least 4 years as part of the ongoing
hearing conservation programs at these
two companies. On the day of the test,
the subjects that were selected to wear
E-A-R® Plugs instead of their standard
HPDs, were handed the plugs and given
only 15-30 seconds of instruction on uti-
lization of the device.
A comparison of the measured change
in mean hearing level over an 8 hour shift
[i.e. temporary threshold shift (TTS)] for
Population A for the two HPDs is shown
in Figure 7. The comparison for Popula-
tion B is shown in Figure 8, this time us-
ing data for a 4 hour shift. Notice the dif-
ferences between the performance of the
foam plug and the pre-molded inserts,
which are significant at 2, 3, and 6 kHz
for Population A and at 2, 3, 4, and 6 kHz
for Population B (P<.05). The fact that
Population B employees who used the
foam ear plug show improved hearing
levels at many frequencies may be par-
tially due to the elimination of TTS. This
small residual TTS could be due to the
inadequate protection received from the
3-flange inserts combined with the un-
protected 4 hour afternoon exposures
which these employees received.
Royster concluded from this data that the
V-51R and 3-flange inserts were unac-
ceptable for use in noise environments
with daily A-weighted L
eq
s equal to or
greater than 95 dB. Analysis of the exist-
ing 4-9 years of audiometric data for
these two populations supported this
contention.
13,14
Furthermore, Royster de-
termined that the foam earplug would be
acceptable for use in these 95 dB envi-
ronments and is currently conducting a
longitudinal survey at one of the plants
to verify this supposition.
Single Number Ratings Applied to
Real World Data
In EARLog #2,
15
the concept of single
number HPD ratings was discussed and
an explanation of the EPA proposed
16
NRR values was presented. The NRR
incorporates a 2 standard deviation(2
s)
correction and a 3 dB spectral safety fac-
tor. These corrections are intended to in-
sure protection for 98% of the population
who correctly wear the HPD in 98% of
the environments where the devices will
be used. By correctly we mean, wear
the HPD in the same manner as did the
subjects who were used to generate the
test results.
FREQUENCY, kHz
CHANGE IN MEAN HL, (dB)
HEARING LEVEL CHANGE
BETWEEN THE BEGINNING AND END
OF AN 8-HOUR WORK SHIFT
Figure 7
+3
0.512346
+2
+1
-1
-2
-3
-4
-5
-6
0
-7
POPULATION A
Group 1, tested = 8 min. post-exposure
n = 9 for each device
FOAM INSERT
V-51R INSERT
(+) HEARING IMPROVED
FREQUENCY, kHz
CHANGE IN MEAN HL, (dB)
HEARING LEVEL CHANGE
BETWEEN THE BEGINNING AND END
OF A 4-HOUR WORK SHIFT
Figure 8
+3
+2
+1
-1
-2
-3
-4
-5
-6
0
-7
0.5 1 2 3 4 6 8
POPULATION B
Tested = 12 min. post-exposure
n = 16 (3-Flange) and n = 15 (Foam)
FOAM INSERT
3-FLANGE INSERT
(+) HEARING IMPROVED
Another Estimate of Real World
Performance
Another method of investigating the ac-
tual protection afforded employees by the
HPDs that they are using, is to measure
their hearing levels before and after a
workdays noise exposure. Royster
12,13
has just completed and reported on such
work. His subject population consisted of
101 employees in two very different
acoustical environments at two different
plant sites. Seventy of the subjects (Popu-
lation A) worked in a textile plant with
steady noise levels at an L
eq
= 95 dBA.
The other thirty-one subjects (Population
B) worked in a steel plant with intermit-
tent noise levels, but the same L
eq
= 95
dBA. During the experiments, the textile
workers wore either a V-51R type insert
(American Optical) or a foam plug
(E-A-R® Plugs). The steelworkers wore
either a 3-flange plug (Norton) or a foam
plug (E-A-R® Plugs) for the first four hours
of each work shift. Population B employ-
ees wore no hearing protection in the af-
ternoons as per company policy.
Observations
1. Manufacturers laboratory data over-
rate the RW performance of HPDs. For
a comfortable protector, this data can
indicate the protection that conscien-
tious, well-trained users will receive.
For an uncomfortable device it is vir-
tually meaningless.
2. Manufacturers laboratory data are
useful for research and development
and may yield an indication of the rank
ordering of various HPDs.
3. Laboratory experiments, such as the
NAL work, which are designed to
simulate RW performance can provide
useful indications of the actual attenu-
ation typically provided by HPDs.
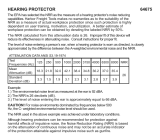
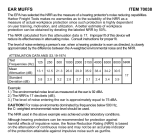
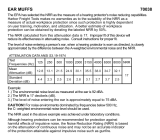
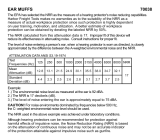
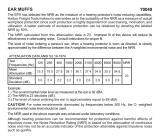
In Table 1, the NRRs for the four HPDs
that have been discussed, are presented.
These NRRs were calculated using the
manufacturers laboratory data as well as
the NAL data. Note that for two devices
the NRR based on the NAL data is <1.
This simply says that if we wish to exam-
ine the least possible protection we are
likely to find (i.e. only 2% of the popula-
tion will receive less protection than this)
that the overall protection provided by
these two devices is virtually zero.
It may be that with RW or estimated RW
data, a 2
s
correction is too severe and
that we should examine a 1
s
correction
(84% protection, i.e. 16% will get less
than this number). These values are also
shown in Table 1. (In fact, the single num-
ber rating listed in the NAL report is the
SLC
80
, which is very similar in concept
15,17
to the NRR, except that it uses a 1
s
cor-
rection and lacks a spectral safety fac-
tor.) Even these more optimistic values
demonstrate that certain insert protectors
may be suitable for noise exposures only
slightly greater than 90 dBA, a supposi-
tion substantiated by the Royster study
cited above.
Conclusions
There appears to be a less than ad-
equate correlation between manufactur-
ers (laboratory) attenuation data and the
RW performance of HPDs. Suitably de-
signed laboratory tests, such as the work
performed by the NAL, can provide rea-
sonable estimates of RW performance.
Comparison between NAL data and in-
field data from three authors substanti-
ates this fact. This is an important point,
because it suggests that existing HPD
test methodologies, such as ANSI S3.19-
1974
11
, can be effectively utilized with
only simple modifications regarding sub-
ject selection, training, fitting and HPD
preparation procedures.
The NAL and in-field data suggest, for
example, that the E-A-R foam earplug
should be more effective in use than other
insert hearing protectors. This was con-
firmed independently by an in-field TTS
study which found that E-A-R Plugs per-
formed significantly better than V-51R
and 3-flange inserts in a 95 dBA noise
environment.
Finally, if a single number rating is to be
used with RW type data, such as the
NAL data, perhaps a 1
s
instead of a 2
s
correction is more appropriate. This
suggestion is reasonable, since an
attempted 98% protection criterion may
be feasible if unrealistically high
laboratory data are utilized, but is
certainly extreme if RW estimated data
are developed and used for NRR
calculations.
References and Footnotes
1. Berger, E.H. - The EARLog series is available upon
request from Aearo Company.
2. National Acoustic Laboratories (1979). Attenuation of
Hearing Protectors (2nd Edition) Commonwealth
Department of Health, Australia.
3. American National Standards Institute (1957). Method
for the Measurement of Real-Ear Attenuation of Ear
Protectors at Threshold Standard Z24. 22-1957
(R1971), New York, NY.
4. Waugh, E. (1974). Pure-Tone, Third-Octave, and
Octave Band Attenuation of Ear Protectors J. Acoust.
Soc. Am, Vol. 56, No. 6, 1866-1869.
5. Edwards, R.G., Hauser, W.P., Moiseev, N.A.,
Broderson, A.B., and Green, W.W. (1978) Effectiveness
of Earplugs as Worn in the Workplace. Sound and
Vibration, Vol. 12, No. 1, 12-22.
6. National Institute for Occupational Safety and Health
(1978) A Field Investigation of Noise Reduction
Afforded by Insert-Type Hearing Protectors, U.S. Dept.
of HEW, Report No 79-115, Cincinnati, OH.
7. Regan, D. E. (1977). Real Ear Attenuation of Personal
Ear Protective Devices Worn in Industry. Audiology and
Hearing Education, Vol. 3, No. 1, 16-17
8. Regan, D.E. (1975). Real Ear Attenuation of Personal
Ear Protective Devices Worn in Industry. Doctoral
Thesis at Kent State University.
9. Padilla, M. (1976). Ear Plug Performance in Industrial
Field Conditions Sound and Vibration, Vol. l0, No. 5, 33-
36.
10. MSHA Denver Technical Support Center - Field
evaluation of earmuffs, to be published 1980.
11. Acoustical Society of America (1975). Method for the
Measurement of Real-Ear Protection of Hearing
Protectors and Physical Attenuation ol Earmuffs
Standard ASA STD1-1975 (ANSI S3.19- 1974). New
York, NY.
12. Royster, L.H. (1979). Effectiveness of Three Different
Types of Ear Protectors in Preventing TTS J. Acoust
Soc. Am., Vol. 66, Supp. 1, paper DD 16.
13. Royster, L.H. (1980). An Evaluation of the Effective-
ness of Two Different Insert Types of Ear Protection in
Preventing TTS in an Industrial Environment. Am. Ind.
Hyg. Assoc. J., Vol. 41, No. 3, 161-169.
14. Royster, L.H., Lilley, D.T., and Thomas, W.G. (1980)
Recommended Criteria for Evaluating the Effective-
ness of Hearing Conservation Programs. Am. Ind. Hyg.
Assoc. J., Vol. 41, No. 1, 40-48.
15. Berger, E.H. (1979). EARLog #2 - Single Number
Measures of Hearing Protector Noise Reduction.
Available upon request from Aearo Company.
16. EPA (1979). Noise Labeling Requirements for Hearing
Protectors Federal Register, Vol. 42, No. 190, 40 CFR
Part 211, 56139-56147.
17. Waugh, R. (1976). Calculated In-Ear A-Weighted
Sound Levels Resulting from Two Methods of Hearing
Protector Selection. Annals of Occupational
Hygiene,Vol. 19, 193-202.
TABLE 1
NRR VALUES BASED ON MANUFACTURERS’ LABORATORY
DATA AND NAL DAT
A
HEARING PROTECTOR
V-51R
Swedish Wool
Earmuff
Foam Insert
NRR*
MFG
18
16
25
29
NRR**
NAL
NRR***
NAL, 1s
0
1
6
14
9
6
13
19
* NRR based on manufacturers laboratory data with 2s correction.
** NRR based on NAL data with 2
s
correction.
*** NRR based on NAL data with 1
s
correction.
NOTE: For more current information on
real-world performance and
NRR-related issues see
EARLog #20,
The Naked Truth
About NRRs.
EARLog® is a registered trademark of Aearo Company. Copyright 1996. First printing 1980.
LIT. CODE 30295 2/99 AG
  • Page 1 1
  • Page 2 2
  • Page 3 3
  • Page 4 4

3M Hearing Protection DL DPR Operating instructions

Type
Operating instructions

3M Hearing Protection DL DPR provides a reliable solution for protecting your hearing in noisy environments. Engineered with advanced technology, it effectively reduces harmful noise levels while enhancing speech intelligibility. Ideal for industrial workplaces, construction sites, or any setting with excessive noise, it offers a comfortable and customized fit for optimal protection.

Ask a question and I''ll find the answer in the document

Finding information in a document is now easier with AI