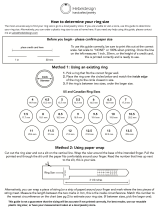
Compaq BL10e - ProLiant - G2 Introduction Manual

Type
Introduction Manual
Dynamic Power Capping TCO and Best
Practices White Paper
Executive Summary .............................................................................................................................. 2
Introduction......................................................................................................................................... 2
Poor Power Planning Results in Trapped Power Capacity.......................................................................... 2
Thermal Logic and Dynamic Power Capping Reclaim Trapped Power Capacity .......................................... 3
At the Rack Level.............................................................................................................................. 4
At Blade Enclosure Level ................................................................................................................... 5
The results of the data-gathering exercise appear in the following section. .............................................. 6
Case 1. HP ProLiant DL380 G5 Server .............................................................................................. 6
Case 2. HP ProLiant BL460c G1 and G5 Servers................................................................................ 7
Best Practices for Implementing Dynamic Power Capping ......................................................................... 8
Setting Dynamic Power Caps for rack-mount servers ............................................................................. 8
Setting Dynamic Power Cap with HP BladeSystem infrastructure .......................................................... 10
Conclusion........................................................................................................................................ 12
Appendix: TCO Test Configurations and Supported Servers................................................................... 13
Test Configuration 1—HP ProLiant DL380 G5 Server.......................................................................... 13
Test Configuration 2—HP ProLiant BL460c G1 Server ........................................................................ 13
Test Configuration 3—HP ProLiant BL460c G5 Server ........................................................................ 14
Supported Servers and Enclosures.................................................................................................... 14
For more information.......................................................................................................................... 15
Feedback.......................................................................................................................................... 15
Executive Summary
Today, more than ever, companies must focus on optimizing their usage of power and cooling
resources. The capital cost of constructing data center infrastructure as well as the ongoing
expense of powering IT equipment have risen significantly over the past decade. Data center
managers also may encounter limitations, imposed by local utilities, on the amount of power
capacity available for IT operations. Gone are the days when the IT staff could assume that they
had the power and cooling they required to meet the growing demand for IT services.
The Hewlett-Packard Thermal Logic portfolio helps customers reduce data center power
consumption, reclaim a large portion of trapped data center power and cooling capacity, and
extend the life of existing data center facilities. This paper will focus on an important new
component of the Thermal Logic portfolio called Dynamic Power Capping. Delivered only with HP
ProLiant and HP BladeSystem, Dynamic Power Capping helps customers reclaim trapped power
capacity by safely limiting peak power consumption without impacting system performance. This
paper explores how power allocation typically works in the data center, outlines expected
Dynamic Power Capping total cost of ownership benefits and outlines best practices for Dynamic
Power Capping implementation.
Introduction
HP offers Dynamic Power Capping to help customers reclaim stranded power in existing data
centers or to optimize use of power and cooling capacity in new data centers. Dynamic Power
Capping allows the data center manager to cap power, limiting peak power consumption without
impacting performance and without risk of over-subscribing data center branch circuits
This paper:
Describes how Dynamic Power Capping functions and helps reclaim trapped power and
cooling capacity.
Examines the TCO benefits that can be expected when implementing Dynamic Power
Capping
Lays out the best approach to implementing Dynamic Power Capping
The Dilemma of Trapped Power Capacity
As information technology continues to evolve from a tool for enhancing workforce productivity to
an engine for innovation and competitive advantage, IT organizations find themselves under
increasing pressure to deliver IT services with close to 100% uptime. At the same time, the cost of
delivering IT infrastructure continues to rise. Today’s Tier IV data centers may cost as much as $25
million for a 1 megawatt of power and cooling capacity.
1
The requirement to provide continuous access to IT services with almost no downtime, coupled
with significant increases in the cost of IT infrastructure delivery presents a dilemma for many IT
organizations. On the one hand, an inability to effectively monitor and control power
consumption and an emphasis on uptime and performance optimization encourage a
conservative data center management culture. Based on the available tools, power and cooling
capacity typically is budgeted to account for theoretical worst-case power usage, even though
excess capacity may never be used.
According to the Green Grid, “the cost of power and cooling the IT infrastructure approaches and
even exceeds the cost of acquiring the assets themselves.”
2
This increase in cost has captured the
1
Cost Model: Dollars per kW plus Dollars per Square Foot of Computer Floor, W. Pitt Turner IV, P.E. with Kenneth G. Brill.
2
The Green Grid, "The Green Grid Opportunity Decreasing Datacenter and Other IT Energy Usage Patterns," February 2007.
2
attention of the CIO, and many organizations are now being asked to find creative ways to
reduce power consumption and better utilize existing facilities while maintaining or improving the
quality of IT service delivery. Faced with half-filled racks, a lack of power and cooling capacity
and no budget to increase capacity, IT organizations and their facilities counterparts are forced to
abandon traditional power-budgeting techniques, such as budgeting to power supply faceplate
levels. They must find more precise ways to measure actual power requirements and the means to
control the power that those devices consume.
Dynamic Power Capping Reclaims Trapped Power
Capacity
The Thermal Logic portfolio of products and technology provides an answer to the dilemma posed
by increasing data center power and cooling costs. First, HP energy-efficient servers deliver
maximum performance per watt, helping reduce the amount of power required to deliver IT
services. Also, starting in mid-December, 2008, HP will deliver Dynamic Power Capping, a
solution that allows systems administrators to reclaim trapped power and cooling capacity by
safely limiting the amount of power consumed by one or more ProLiant servers or HP BladeSystem
c7000 enclosures without impacting server performance.
Figure 1 illustrates the benefit of Dynamic Power Capping. Power consumption of IT equipment
within the data center is represented by the curve at the bottom of the diagram. The amount of
power consumed will vary over time as workload intensity varies. The amount of power budgeted
for the same equipment is represented by the “Allocated power capacity (per faceplate)” or
“Allocated power capacity (per power calculator)” lines. The “Actual peak power usage” line
represents the maximum power used by equipment in the data center over time. By using
Dynamic Power Capping and setting server or blade enclosure power caps to the actual peak
power usage, IT departments are able to reclaim the amount of power capacity represented by
the distance between the allocated power capacity lines and the actual peak power usage line.
Companies that currently budget to faceplate will see the greatest power-capacity benefit.
Companies that budget power using tools such as the HP Power Calculator also stand to reclaim
significant power capacity. By setting the Dynamic Power Cap at the actual peak-power usage,
power is reclaimed without impacting performance.
3
Figure 1. Data Center with Dynamic Power Capping
Time (hrs)
Power (KW)
Allocated power capacity (per faceplate)
Hard cap of aggregate power
with Dynamic Power Capping
Allocated power capacity (per power calculator)
Actual aggregate
power usage over time
A
l
l
o
c
a
t
e
d
p
o
w
e
r
r
e
c
l
a
i
m
e
d
Time (hrs)
Power (KW)
Allocated power capacity (per faceplate)
Hard cap of aggregate power
with Dynamic Power Capping
Allocated power capacity (per power calculator)
Actual aggregate
power usage over time
A
l
l
o
c
a
t
e
d
p
o
w
e
r
r
e
c
l
a
i
m
e
d
At the Rack Level
Dynamic Power Capping operates within each HP ProLiant server. In an HP BladeSystem
environment, it also functions at the enclosure level. Within individual rack-mount servers, the HP
Integrated Lights-Out (iLO 2) management processor works in conjunction with a power
microprocessor both to measure and control power usage. When enforcing the Dynamic Power
Cap, the power microcontroller first will lower the CPU p-state.
3
If the required reduction in
power has not been reached, the power microprocessor will continue to reduce CPU clock speed
to prevent peak power consumption from exceeding the user-defined cap. This process is
illustrated in Figure 2 below. Dynamic Power Caps for individual servers can be set from within
the iLO 2 Advanced user interface. Dynamic Power Caps for multiple rack-mount servers may be
set from the power management module within HP Insight Control Environment.
Since Dynamic Power Capping can impact server performance if set too aggressively, HP
recommends that Dynamic Power Caps be set at values that match or exceed the highest
observed power consumption over a representative server workload sample. Best practices for
setting Dynamic Power Caps will be discussed later in this paper.
3
A CPU p-state is a CPU frequency/voltage pair. By increase the P-state from P0 to P1 to P2, etc. both CPU frequency and voltage are
decreased. When computers operate at a lower p-state, they consume less power.
4
Figure 2. Rapid response of Dynamic Power Capping avoids circuit breaker trips
Time
Capacity
Time(seconds)
NoDynamicPowerCapping
0
5
10
Totalcircuitcapacity
Deratedcircuitcapacity
DynamicPowerCappingEnabled
05
10
Circuit
trips
Circuit
Safe
Time(seconds)
Totalcircuitcapacity
Deratedcircuitcapacity
Totalcircuitcapacity
Deratedcircuitcapacity
Time
Capacity
DynamicPowerCap
Deratedcircuitcapacity
Totalcircuitcapacity
DynamicPowerCap
Time
Capacity
Time(seconds)
NoDynamicPowerCapping
0
5
10
Totalcircuitcapacity
Deratedcircuitcapacity
DynamicPowerCappingEnabled
05
10
Circuit
trips
Circuit
Safe
Time(seconds)
Totalcircuitcapacity
Deratedcircuitcapacity
Totalcircuitcapacity
Deratedcircuitcapacity
Time
Capacity
DynamicPowerCap
Deratedcircuitcapacity
Totalcircuitcapacity
DynamicPowerCap
At Blade Enclosure Level
When applied at the enclosure level, Dynamic Power Capping takes on additional attributes that
enable more effective power by spreading the Dynamic Power Cap across multiple servers..
Instead of setting the Dynamic Power Cap for individual servers, the IT administrator sets a cap for
the entire HP BladeSystem c7000 enclosure. The Onboard Administrator, working in conjunction
with the iLO 2 management processor, will adjust power caps dynamically based on workload
intensity. Blades running lighter workloads will have their power caps reduced; blades running
more intense workloads will have their power caps increased. Since workload intensity will peak
and subside at different times in most environments, the ability to adjust power caps dynamically
enables IT administrators to set the enclosure-level Dynamic Power Cap below the sum of peak
power consumption for each blade without impacting blade performance.
The first release of Dynamic Power Capping requires N+N power redundancy for the enclosure
and redundant Onboard Administrator (OA) modules. The Dynamic Power Cap for the enclosure
can be set within the OA or from the power management module within HP Insight Control
Environment.
Dynamic Power Capping TCO analysis
This section discusses the TCO benefits customers can anticipate following a successful
implementation of Dynamic Power Capping. The analysis compares the number of servers that
can be allocated to a typical 30Amp 3-phase circuit (208V) when budgeting power via three
methods: power supply faceplate, HP Power Calculator or HP BladeSystem Sizer, and Dynamic
Power Capping. Comparisons were run using the three power budgeting methods for the ProLiant
DL 380 G5 server, ProLiant BL460c G1 server, and ProLiant BL460c G5 server. The difference in
5
the number of servers budgeted using faceplate, power calculator, and Dynamic Power Capping
represents the capital cost recovery potential of the Dynamic Power Capping solution. The
SpecJBB benchmark was used to generate load for the Dynamic Power Capping portion of the
TCO analysis.
4
Data for the analysis was gathered in the following fashion:
1. Document Faceplate Values: The maximum power in Watts (faceplate power) was
taken from the QuickSpecs for each of the server models discussed above. Faceplate
value represents the maximum possible input power required for a given server model.
The value describes an extreme condition where the server is configured with a maximum
number of CPUs, memory, drives, and internal peripherals operating at maximum
performance on a continuous basis.
2. Generate Power Calculator/BladeSystem Sizer Estimates: HP Power
Calculator and HP BladeSystem Sizer allow customers to size server power requirements
more accurately based on the configuration of the server and the anticipated intensity of
the server workload as measured by CPU utilization. For the purposes of this paper, the
default settings of 100% CPU utilization have been used. The server configurations tested
represent those typically found in enterprise computing environments.
3. Measure Peak Power Consumption and Cap: Server power consumption was
measured at 100% CPU utilization running the SPECjbb benchmark with the same
configuration used for the power calculator estimate. A Dynamic Power Cap was then
applied to the test servers and test enclosures to verify that applying the cap at the 100%
SPECjbb load did not impact performance.
The results of the data-gathering exercise appear in the following section.
Case 1. HP ProLiant DL380 G5 Server
Comparisons of faceplate, power calculator, and SPECjbb benchmark with Dynamic Power
Capping for the DL380 G5 are listed below (Table 1). By leveraging Dynamic Power Capping at
100% load, test results showed that, for a typical DL380 G5 configuration, users can potentially
increase the number of servers deployed per circuit from 7servers, using faceplate, to 23 servers,
using Dynamic Power Capping at max power, an increase of nearly 230%. Using the Uptime
Institute estimate of $25,000 per kW of redundant power infrastructure, Dynamic Power Capping
causes per server power infrastructure cost to drop from $30,714 per server to $9,348 per
server, a decrease of 69%.
Table 1. HP ProLiant DL 380 G5 Power and Costs Projections
Faceplate Power Calculator Load Testing and
Dynamic Power Capping
Server Power
1,193 W 435 W 368 W
Maximum Number of
Servers in Circuit
7 19 23
Power Provisioning
Cost Per Server
@ $25k per kW
$29,825 $11,316 $9,348
HP Note
Tests assume a 30AMP, 208V 3-phase circuit for a usable
total of 8.6kW of capacity.
4
The Standard Performance Evaluation Corporation develops SpecJBB. More information can be found at the following URL:
http://www.spec.org/.
6
While customers who use faceplate as their primary means of budgeting server power will see the
most dramatic increase in servers per circuit and the most dramatic decrease in power
provisioning cost per server, most customers will gain the ability to reclaim trapped power
capacity at some level. In addition, while these measurements were calculated at 100% CPU
load, most enterprise workloads do not consistently run at 100% CPU utilization. Customers
running applications at typical CPU loads may be able to set Dynamic Power Cap levels lower
than those shown in this exercise, and reclaim an even larger percentage of trapped power
capacity than shown here.
Case 2. HP ProLiant BL460c G1 and G5 Servers
Comparisons of faceplate, power calculator, and SPECjbb benchmark with Dynamic Power
Capping for the BL460c G1 server and c7000 as well as the BL460c G5 server and c7000
enclosure are listed below (Tables 2 and 3). By leveraging Dynamic Power Capping at 100%
load, test results showed that, for a typical BL460c G1 configuration, users can potentially
increase the number of blade servers deployed per circuit from 16 servers using faceplate to 28
servers using Dynamic Power Capping at max power, an increase of nearly 75%. For the
ProLiant BL460c G5 server, the results are even more dramatic. Users can potentially increase the
number of blade servers deployed per circuit from 16 servers using faceplate to 32 servers using
Dynamic Power Capping at max power, an increase of 100%.
Once again, using the Uptime Institute estimate of $25,000 per kW of redundant power
infrastructure, Dynamic Power Capping causes per server power infrastructure cost to drop from
$13,438 per server to $7,679 per server, a decrease of 39%. For the ProLiant BL460c G5
server, Dynamic Power Capping causes the per server power infrastructure cost to drop from
$13,438 per server to $6,719 per server, a decrease of 49%.
Table 2. HP ProLiant BL460c G1 Server Power and Costs Projections
Faceplate Blade System Sizer
(Enclosure)
Load Testing and
Dynamic Power Capping
Enclosure Power
w/16 Blade Servers
7,836 W 6,000 W 4,790 W
Maximum Number of
Blade Servers and
Enclosures in Circuit
16 Blade Servers*
1 Enclosure
20 Blade Servers
2 Enclosures
28 Blade Servers
2 Enclosures
Power Provisioning
Cost Per Server
@ $25k per kW
$13,438 $9,733 $7,679
* While technically more than 16 blade servers will fit, the number of incremental servers does
not justify the purchase of an additional enclosure.
HP Note
Tests assume a 30 AMP, 208V 3-phase circuit for a usable
total of 8.6 kW of capacity.
Table 3. HP ProLiant BL460c G5 Server Power and Costs Projections
Faceplate Blade System Sizer
(Enclosure)
Load Testing and
Dynamic Power Capping
Enclosure Power
w/16 Blade Servers
8,340 W 4,722W 4,257 W
Maximum Number of 16Blade Server* 28 Blade Servers 32 Blade Servers
7
Blade Servers and
Enclosures in Circuit
1 Enclosures 2 Enclosures 2 Enclosures
Power Provisioning
Cost Per Server
@ $25k per kW
$13,438 $7,679 $6,719
* While technically more than 16 blade servers will fit, the number of incremental servers does
not justify the purchase of an additional enclosure.
HP Note
Tests assume a 30 AMP, 208 V 3-phase circuit for a usable
total of 8.6 kW of capacity.
As with rack-mounted servers, customers who have used faceplate as their primary means of
budgeting server power will see the most dramatic increase in servers per circuit and the most
dramatic decrease in power provisioning cost per server. Since Dynamic Power Capping for
blades is implemented within the blade enclosure and power budgets can be adjusted
dynamically in response to workload requirements, many end-users will be able to reclaim
additional power capacity by setting caps lower than the values suggested by the SpecJBB
benchmark. In addition, because server workloads within the enclosure peak and decline at
different rates, setting a cap below SpecJBB benchmark levels will probably result in little to no
performance loss.
There are a couple of other important observations to make when looking at the data in tables 1,
2, and 3. First, while the increase in number of server per circuit is very dramatic with the
ProLiant DL380 G5, the overall number of blade servers deployed per circuit is still larger (32
blades for the BL460 G5 vs. 28 blades for the BL460 G1 vs. 23 servers for the DL380 G5).
Power efficiency built into the c-Class blades in the form of pooled power, means that more
blades can fit on a circuit even when Dynamic Power Capping is not used. Also, power
reclamation potential is different based on different blade server models. Customers leveraging
the 2 x 220 blade or the BL260c blade may find that they can reclaim more power and more
dramatically increase server capacity than the numbers shown in this analysis might indicate.
Best Practices for Implementing Dynamic Power Capping
Establishing the dynamic power capping settings for your HP servers is an interactive process. It
starts by leveraging tools such as the HP Power Calculator or HP BladeSystem Sizer to set
Dynamic Power Capping baselines and culminates with refinement of Dynamic Power Capping
settings based on actual power usage. The first portion of this section describes the Dynamic
Power Capping configuration process for rack-mount servers using the ProLiant DL380 G5 server
as an example. The second portion of this section described the same process for HP
BladeSystem infrastructure using the ProLiant BL 460c G1 and G5 servers and the HP
BladeSystem c7000 enclosure as examples.
Dynamic Power Capping is part of HP Insight Control Environment. To begin using Dynamic
Power Capping, go to the following URL,
www.hp.com/go/ice and click buy online. This takes you
to the licensing options. There is also a free trial for HP Insight Control Environment that may
be of interest. This can be found at
www.hp.com/go/tryinsightcontrol.
Setting Dynamic Power Caps for rack-mount servers
Setting Dynamic Power Caps for rack-mount servers is simple process. It involves updating ROM
BIOS, iLO and Insight Control Environment software, setting an initial Dynamic Power Cap
baseline using HP Power Calculator, and refining Dynamic Power Cap settings based on actual
power usage. Each step in the process is outlined below. Please note that setting and adjusting
8
Dynamic Power Caps should always be done in conjunction with your facilities department.
First, download and apply the following updates to your HP ProLiant server (see
Appendix for list of supported servers):
Table 4. Component Requirement for Rack-Mount Servers
Required Component Version Required Comment
ROM BIOS
11/1/2008 or later BIOS update applied to each server
iLO 1.70 or later iLO update applied to each server
IPM component of
Insight Control
Environment
2.0 or later IPM update applied to Insight Control
Environment central management server.
Next, download the latest version of HP Power Calculator from the following URL:
http://h30099.www3.hp.com/configurator/calc/Power%20Calculator%20Catalog.xls.
Run the HP Power Calculator with your specific configuration using the default settings.
When using the HP Power Calculator default settings for our DL380 G5 TCO benchmark
configuration (see Appendix), our configuration yields a power estimate of 450 Watts.
The HP Power Calculator output becomes the initial Dynamic Power Cap for your ProLiant
rack-mount server. Based on the HP Power Calculator output for our ProLiant DL380 G5
configuration, we would set the initial Dynamic Power Cap at 450 Watts.
Using Insight Control Environment, observe peak power usage for a period of time that
aligns to the server’s application duty cycle. Depending on the application in question,
this duty cycle could be as short as a few days or as long as a calendar quarter. HP
recommends collecting and observing data for at least one week to ensure that the peak
power consumption value observed represents the true peak power usage for the server in
question.
Adjust the Dynamic Power Cap for your ProLiant rack-mount server in accordance with
actual peak power usage. Based on our TCO benchmarking, we would adjust our
Dynamic Power Cap downward to 368 Watts.
Finally, continue to observe power usage for each rack-mount server using HP Insight
Control Environment. If the Dynamic Power Cap is invoked too frequently, it may have an
adverse impact on server performance. In these situations, you may want to raise the cap
to remove any negative performance impact. In cases where you are raising the cap,
proceed with caution as the sum of the single server Dynamic Power Caps may not
exceed the capacity of the branch circuit and PDUs to which they are attached.
The following table summarizes the best practice for establishing Dynamic Power Caps for rack-
mount servers.
Table 5. Steps to Best Practices with Rack-Mount Servers
Step Action
Step 1 Update server BIOS, iLO firmware, and Insight Control
Environment software.
Step 2 Use HP Power Calculator to establish the initial Dynamic Power
Cap for your rack-mount servers.
Step 3 Observe power usage using Insight Control Environment for a
complete application duty cycle and re-adjust Dynamic Power
Cap based on actual peak power usage.
9
Step 4 Continue to observe power usage and adjust if Dynamic Power
Cap is invoked frequently.
Setting Dynamic Power Cap with HP BladeSystem infrastructure
When setting a Dynamic Power Cap for an HP BladeSystem enclosure, the process follow the
same general principles as our rack-mount example with a few important differences. Please note
that setting and adjusting Dynamic Power Caps should always be done in conjunction with your
facilities department.
Dynamic Power Capping within the BladeSystem enclosure works well when the servers support a
variety of general purpose computing workloads because applications such as accounting, email,
webservers, and database servers typically do not experience peak demands at exactly the same
time. An enclosure devoted to high-performance computing such as financial modeling or
scientific computing would not see as much power reclaimed. These scale-out applications
typically have synchronized workloads that peak and idle concurrently.
First, download and apply the following updates to your HP ProLiant server (see
Appendix for list of supported servers):
Table 6. Component Requirement for BladeSytem Servers
Required Component Version Required Comment
ROM BIOS
11/1/2008 or later BIOS update applied to each server
iLO 1.70 or later iLO update applied to each server
Onboard
Administrator
2.30 or later OA update applied to each OA module.
IPM component of
Insight Control
Environment
2.0 or later IPM update applied to Insight Control
Environment central management server.
Next, meet with your facilities person, to understand the available power budget for your
HP BladeSystem infrastructure. This example assumes a 30 A 3-phase circuit with 8.6
kW of capacity.
Establish a goal for the number of enclosures that you wish to fit on the circuit and divide
available circuit capacity by the number of enclosures. In our example, we will set a goal
of two enclosures per circuit. We then divide the 8.6 KW circuits into two segments of
4300 W each.
Next, use the HP BladeSystem Sizer to calculate how many servers will fit in each
enclosure, using the given power budget. For the BL460c G1 configuration used in our
TCO benchmarking (see Appendix), the BladeSystem Sizer indicates that 10 BL460 G1
servers will fit in each c7000 enclosure (20 total). Depending on the number of blades
that will fit into the enclosure, the IT department may want to adjust the “enclosure per
circuit” goal.
Deploy additional enclosures as appropriate and set Dynamic Power Caps for each
enclosure. Insert up to the number of blades specified by the HP BladeSystem Sizer in
each enclosure.
Using Insight Control Environment, observe peak power usage for a period of time that
aligns to the enclosure’s application duty cycle. Depending on the applications in
question, this duty cycle could be as short as a few days or as long as a calendar
quarter. HP recommends collecting and observing data for at least one week to ensure
10
that the peak value observed represents the true peak power usage for the c7000
enclosure in question.
Based on observed power usage, continue to add more blades to the c7000 enclosure
until power consumption approaches the 4300 Watt Dynamic Power Cap. Based on our
TCO benchmark comparison, we were able to fit 14 BL460c G1 servers in each
enclosure for a total of 28 servers for the 8.6 kW circuit. .
Finally, continue to observe power usage for each c7000 enclosure using HP Insight
Control Environment. If the Dynamic Power Cap for the enclosure is invoked too
frequently, it may have an adverse impact on server performance. In these situations, you
may want to remove blades from the enclosure or raise the enclosure Dynamic Power
Cap to remove any negative performance impact. In cases where you are raising the
cap, proceed with caution as the sum of the single enclosure Dynamic Power Caps may
not exceed the capacity of the branch circuit and PDUs to which they are attached.
The following table summarizes the best practice for establishing Dynamic Power Caps for HP
BladeSystem enclosures.
Table 7. Steps to Best Practices with ServerBlade Servers
Step Action
Step 1
Update server BIOS, iLO firmware, Onboard Administrator
firmware, and Insight Control Environment software.
Step 2 Work with facilities to size available electrical (and cooling)
capacity and to establish a goal for the number of enclosures per
circuit.
Step 3 Use the HP BladeSystem Sizer to estimate the number of blades
that can be safely added to each enclosure without performance
impact.
Step 4 Observe power usage using Insight Control Environment for a
complete application duty cycle and either adjust Dynamic Power
Cap for c7000 enclosure based on peak power usage or add
additional blades to the enclosure.
Step 5 Continue to observe power usage and adjust if Dynamic Power
Cap is invoked frequently.
11
Conclusion
As the cost of provisioning power and cooling to enterprise data centers continues to rise, IT
organizations find themselves confronted with half-filled racks, a lack of power and cooling
capacity, and less budget available for large data center build-outs. Solving this problem will
require a focus on reducing energy consumption as well as a concerted effort re-examine how
power is budgeted within the data center. Instead of budgeting based on power supply face
plate values or some derivative of those numbers, IT organizations must find more precise ways to
measure actual power requirements, and they must find the means to reliably control the power
that those devices consume.
Hewlett-Packard’s Thermal Logic portfolio helps customers reduce data center power consumption,
reclaim a large portion of trapped data center power and cooling capacity, and extend the life of
existing data center facilities. HP Insight Control Environment helps IT and facilities administrators
accurately measure power consumption on one or more ProLiant servers or BladeSystem c7000
enclosures. With the addition of Dynamic Power Capping to Insight Control Environment, it is
now possible to limit peak power usage and, using the best practices outlines in this paper,
reclaim power and cooling capacity that is sitting idle in the data center.
As we look toward the future, HP will continue drive investment toward products and
technologies, such as Insight Control Environment and Dynamic Power Capping, that drive the
Thermal Logic vision of reducing power consumption, reclaiming power and cooling capacity,
extending the life of the data center. If you are interested in trying these products to see how
they can help you make the most of your data center power and cooling resources, we invite you
to contact your HP or HP partner sales representative or download HP Insight Control Environment
from
http://www.hp.com/go/tryInsightControl.
12
Appendix: TCO Test Configurations and Supported
Servers
The following tables contain the configuration of the servers as tested.
Test Configuration 1—HP ProLiant DL380 G5 Server
1 HP ProLiant DL380 G5 server
2 Quad-Core Intel® Xeon® Processor E5450
8 1GB PC2-5300 DDR2 Fully Buffered Low-Power DIMMs
4 Hot Plug SFF SAS 10K 72GB Hard Drives in a RAID 5 Configuration
2 Power Supply Units
ROM Revision: P56 9/1/08
iLO Revision: v1.70 pass 11
Power: 208VAC
Circuit Size: 8.6kW (30 Amp, 3-phase)
Operating Temperature: 22°C ±0.5°C
Power calculated using HP Power Calculator REV111601
Power measured using Voltech PM1000 Power Analyzer
Test Configuration 2—HP ProLiant BL460c G1 Server
16 HP ProLiant BL460c G1 Servers
2 Intel® Xeon® Processor L5450
4 4GB PC2-5300 DDR2 Fully Buffered Low-Power DIMMs
2 Hot Plug SFF SAS 10K 72GB Hard Drives in a RAID 1 Configuration
ROM Revision: I15
iLO
1 HP BladeSystem c7000 Enclosure
10 Fans (Rev D, 48v)
6 Power Supply Units
2 HP 1Gb Ethernet Pass-Thru Modules
2 Onboard Administrator Modules
Power: 208VAC
Circuit Size: 8.6kW (30 Amp, 3-phase)
Operating Temperature: 22°C ±0.5°C
Power calculated using HP BladeSystem Sizer v3.4.1
Power measured using Voltech PM1000 Power Analyzer
13
14
Test Configuration 3—HP ProLiant BL460c G5 Server
16 HP ProLiant BL460c G5 Servers
2 Intel® Xeon® Processor L5430
4 4GB PC2-5300 DDR2 Fully Buffered Low-Power DIMMs
2 Hot Plug SFF SAS 10K 72GB Hard Drives in a RAID 1 Configuration
ROM Revision: I23 9/29/08
iLO Revision: v1.70 pass 11
1 HP BladeSystem c7000 Enclosure
10 Fans (Rev F, 12v)
4 Power Supply Units
2 HP 1Gb Ethernet Pass-Thru Modules
2 Onboard Administrator Module v2.30, pass 10
Power: 208VAC
Circuit Size: 8.6kW (30 Amp, 3-phase)
Operating Temperature: 22°C ±0.5°C
Power calculated using HP BladeSystem Sizer v3.4.1
Power measured using Voltech PM1000 Power Analyzer
Supported Servers and Enclosures
Dynamic Power Capping supported on the following servers and enclosures:
HP BladeSystem c7000 enclosure
HP ProLiant BL 2x220 G5 server
HP ProLiant BL260 G5 server
HP ProLiant BL460c G1 server
HP ProLiant BL460c G5 server
HP ProLiant BL495c G5 server
HP ProLiant BL685 G5 server
HP ProLiant DL360 G5 server
HP ProLiant DL380 G5 server
For more information
For additional information, refer to the resources listed below.
Resource description Web address
Powering HP BladeSystem c7000
Enclosures
Tech Brief
http://h20000.www2.hp.com/bc/docs/support/SupportManu
al/c01543629/c01543629.pdf
Technology for remote management of
power distribution
http://h20000.www2.hp.com/bc/docs/support/SupportManu
al/c01503903/c01503903.pdf
Feedback
Send comments about this paper to [email protected].
© 2008 Hewlett-Packard Development Company, L.P. The information contained
herein is subject to change without notice. The only warranties for HP products and
services are set forth in the express warranty statements accompanying such
products and services. Nothing herein should be construed as constituting an
additional warranty. HP shall not be liable for technical or editorial errors or
omissions contained herein.
ProLiant and BladeSystem are trademarks of Hewlett-Packard Development
Company.
Intel and Intel Xeon are trademarks of Intel Corporation in the United States and
other countries.
Doc ID number 4AA2-3110ENE (EMEA) November 2008
  • Page 1 1
  • Page 2 2
  • Page 3 3
  • Page 4 4
  • Page 5 5
  • Page 6 6
  • Page 7 7
  • Page 8 8
  • Page 9 9
  • Page 10 10
  • Page 11 11
  • Page 12 12
  • Page 13 13
  • Page 14 14
  • Page 15 15

Compaq BL10e - ProLiant - G2 Introduction Manual

Type
Introduction Manual

Ask a question and I''ll find the answer in the document

Finding information in a document is now easier with AI