Page is loading ...

APOGEE INSTRUMENTS, INC. | 721 WEST 1800 NORTH, LOGAN, UTAH 84321, USA
TEL: (435) 792-4700 | FAX: (435) 787-8268 | WEB: APOGEEINSTRUMENTS.COM
Copyright © 2022 Apogee Instruments, Inc.
OWNER’S MANUAL
QUANTUM METER
Models MQ-501
Rev: 30-Aug-2022

TABLE OF CONTENTS
Owner’s Manual ............................................................................................................................................................................... 1
Certificates of Compliance ....................................................................................................................................................... 3
Introduction ............................................................................................................................................................................. 5
Sensor Models ......................................................................................................................................................................... 6
Specifications ........................................................................................................................................................................... 7
Deployment and Installation .................................................................................................................................................. 10
Battery Installation and Replacement .................................................................................................................................... 11
Operation and Measurement ................................................................................................................................................ 12
Apogee AMS Software ........................................................................................................................................................... 17
Maintenance and Recalibration ............................................................................................................................................. 19
Troubleshooting and Customer Support ................................................................................................................................ 21
Return and Warranty Policy ................................................................................................................................................... 23

CERTIFICATE OF COMPLIANCE
EU Declaration of Conformity
This declaration of conformity is issued under the sole responsibility of the manufacturer:
Apogee Instruments, Inc.
721 W 1800 N
Logan, Utah 84321
USA
for the following product(s):
Models: MQ-501
Type: Quantum Meter
The object of the declaration described above is in conformity with the relevant Union harmonization legislation:
2014/30/EU Electromagnetic Compatibility (EMC) Directive
2011/65/EU Restriction of Hazardous Substances (RoHS 2) Directive
2015/863/EU Amending Annex II to Directive 2011/65/EU (RoHS 3)
Standards referenced during compliance assessment:
EN 61326-1:2013 Electrical equipment for measurement, control, and laboratory use – EMC requirements
EN 63000:2018 Technical documentation for the assessment of electrical and electronic products with
respect to the restriction of hazardous substances
Please be advised that based on the information available to us from our raw material suppliers, the products
manufactured by us do not contain, as intentional additives, any of the restricted materials including lead (see
note below), mercury, cadmium, hexavalent chromium, polybrominated biphenyls (PBB), polybrominated
diphenyls (PBDE), bis (2-ethylhexyl) phthalate (DEHP), butyl benzyl phthalate (BBP), dibutyl phthalate (DBP), and
diisobutyl phthalate (DIBP). However, please note that articles containing greater than 0.1 % lead concentration
are RoHS 3 compliant using exemption 6c.
Further note that Apogee Instruments does not specifically run any analysis on our raw materials or end products
for the presence of these substances, but we rely on the information provided to us by our material suppliers.
Signed for and on behalf of:
Apogee Instruments, August 2022
Bruce Bugbee
President
Apogee Instruments, Inc.

CERTIFICATE OF COMPLIANCE
UK Declaration of Conformity
This declaration of conformity is issued under the sole responsibility of the manufacturer:
Apogee Instruments, Inc.
721 W 1800 N
Logan, Utah 84321
USA
for the following product(s):
Models: MQ-501
Type: Quantum Meter
The object of the declaration described above is in conformity with the relevant UK Statutory Instruments and
their amendments:
2016 No. 1091 The Electromagnetic Compatibility Regulations 2016
2012 No. 3032 The Restriction of the Use of Certain Hazardous Substances in Electrical and Electronic
Equipment Regulations 2012
Standards referenced during compliance assessment:
BS EN 61326-1:2013 Electrical equipment for measurement, control, and laboratory use – EMC requirements
BS EN 63000:2018 Technical documentation for the assessment of electrical and electronic products with
respect to the restriction of hazardous substances
Please be advised that based on the information available to us from our raw material suppliers, the products
manufactured by us do not contain, as intentional additives, any of the restricted materials including lead (see
note below), mercury, cadmium, hexavalent chromium, polybrominated biphenyls (PBB), polybrominated
diphenyls (PBDE), bis (2-ethylhexyl) phthalate (DEHP), butyl benzyl phthalate (BBP), dibutyl phthalate (DBP), and
diisobutyl phthalate (DIBP). However, please note that articles containing greater than 0.1 % lead concentration
are RoHS 3 compliant using exemption 6c.
Further note that Apogee Instruments does not specifically run any analysis on our raw materials or end products
for the presence of these substances, but we rely on the information provided to us by our material suppliers.
Signed for and on behalf of:
Apogee Instruments, August 2022
Bruce Bugbee
President
Apogee Instruments, Inc.

INTRODUCTION
Radiation that drives photosynthesis is called photosynthetically active radiation (PAR) and is typically defined as
total radiation across a range of 400 to 700 nm. PAR is almost universally quantified as photosynthetic photon flux
density (PPFD), the sum of photons from 400 to 700 nm in units of micromoles per square meter per second (µmol
m-2 s-1, equal to microEinsteins m-2 s-1). While microEinsteins and micromoles are equal (one Einstein = one mole of
photons), the Einstein is not an SI unit, so expressing PPFD as µmol m-2 s-1 is preferred. Daily total PPFD is typically
reported in units of moles of photons per square meter per day (mol m-2 d-1) and is often called daily light integral
(DLI).
The acronym PPF is also used and refers to the photosynthetic photon flux. The acronyms PPF and PPFD refer to
the same variable. Both terms are used because there is not a universal definition of the term flux. Flux is
sometimes defined as per unit area per unit time and sometimes defined as per unit time only. PPFD is used in this
manual.
Sensors that measure PPFD are often called quantum sensors due to the quantized nature of radiation. A quantum
refers to the minimum quantity of radiation, one photon, involved in physical interactions (e.g., absorption by
photosynthetic pigments). In other words, one photon is a single quantum of radiation.
Typical applications of quantum sensors include measurement of incident PPFD on plant canopies in outdoor
environments or in greenhouses and growth chambers and reflected or under-canopy (transmitted) PPFD
measurement in the same environments.
Apogee Instruments MQ-501 quantum meters consist of a handheld meter, dedicated quantum sensor that is
connected by cable to an anodized aluminum housing, and AM-001 Meter Mounting Bracket. Sensors consist of a
cast acrylic diffuser (filter), photodiode, and are potted solid with no internal air space. MQ series quantum meters
provide a real-time PPFD reading on the LCD display, that determine the radiation incident on a planar surface
(does not have to be horizontal), where the radiation emanates from all angles of a hemisphere. MQ series
quantum meters include manual and automatic data logging features for making spot-check measurements.

SENSOR MODELS
Apogee MQ series quantum meters covered in this manual are self-contained and come complete with handheld
meter, sensor, and AM-001 Meter Mounting Bracket.
A sensor’s model number and serial number are
located on a label on the backside of the handheld
meter.

SPECIFICATIONS
Calibration Traceability
Apogee MQ series quantum meters are calibrated through side-by-side comparison to the mean of four transfer
standard quantum sensors under a reference lamp. The reference quantum sensors are recalibrated with a 200 W
quartz halogen lamp traceable to the National Institute of Standards and Technology (NIST).
MQ-501
Calibration Uncertainty
± 5 % (see calibration Traceability below)
Measurement Range
0 to 4000 µmol m-2 s-1
Measurement
Repeatability
Less than 0.5 %
Long-term Drift
(Non-stability)
Less than 2 % per year
Non-linearity
Less than 1 % (up to 4000 µmol m-2 s-1)
Response Time
Less than 1 ms
Field of View
180º
Spectral Range
389 to 692 nm ± 5 nm (wavelengths where response is greater than 50 %)
Spectral Selectivity
Less than 10 % from 412 to 682 nm ± 5 nm (see Spectral Response below)
Directional (Cosine)
Response
± 5 % at 75º zenith angle (see Cosine Response below)
Azimuth Error
Less than 0.5 %
Tilt Error
Less than 0.5 %
Temperature Response
-0.11 ± 0.04 % C-1 (see Temperature Response below)
Uncertainty in Daily Total
Less than 5 %
Detector
Blue-enhanced silicon photodidode
Housing
Anodized aluminum body with acrylic diffuser
IP Rating
IP68
Operating Environment
0 to 50 C; less than 90 % non-condensing relative humidity up to 30 C; less than 70 % non-
condensing relativity humidity from 30 to 50 C; separate sensors can be submerged in water up
to depth of 30 m
Meter Dimension
126 mm length, 70 mm width, 24 mm height
Sensor Dimensions
24 mm diameter; 37 mm height
Mass
180 g
Cable
Approximately 0.17 m of two conductor, shielded, twisted-pair wire; additional cable available;
TPR jacket

Spectral Response
Temperature Response
Mean temperature response of ten MQ-500
series quantum sensors (errors bars represent
two standard deviations above and below
mean). Temperature response measurements
were made at 10 C intervals across a
temperature range of approximately -10 to 40
C in a temperature-controlled chamber under a
fixed, broad spectrum, electric lamp. At each
temperature set point, a spectroradiometer
was used to measure light intensity from the
lamp and all quantum sensors were compared
to the spectroradiometer. The
spectroradiometer was mounted external to
the temperature control chamber and
remained at room temperature during the
experiment.
Mean spectral response measurements of six
replicate Apogee SQ-100X (original X) and
MQ-500 (full-spectrum) series quantum
sensors. Spectral response measurements
were made at 10 nm increments across a
wavelength range of 300 to 800 nm with a
monochromator and an attached electric
light source. Measured spectral data from
each quantum sensor were normalized by
the measured spectral response of the
monochromator/electric light combination,
which was measured with a
spectroradiometer.

Cosine Response
Directional (cosine) response is defined as
the measurement error at a specific angle of
radiation incidence. Error for Apogee MQ-
500 series quantum sensors is approximately
± 2 % and ± 5 % at solar zenith angles of 45°
and 75°, respectively.
Mean directional (cosine) response
of seven apogee MQ-500 series
quantum sensors. Directional
response measurements were made
on the rooftop of the Apogee
building in Logan, Utah. Directional
response was calculated as the
relative difference of MQ-500
quantum sensors from the mean of
replicate reference quantum sensors
(LI-COR models LI-190 and LI-190R,
Kipp & Zonen model PQS 1). Data
were also collected in the laboratory
using a reference lamp and
positioning the sensor at varying
angles.

DEPLOYMENT AND INSTALLATION
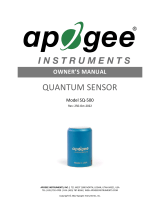
The MQ-501 (blue sensor head pictured) is designed for spot-check measurements. To accurately measure PFFD
incident on a horizontal surface, the sensor must be level. For this purpose, the meter comes with the AM-001
meter mounting bracket to mount the sensor on a horizontal plane to the meter for simple spot-check
measurements.
NOTE: The handheld meter portion of the instrument is not waterproof. Do not get the meter wet or leave the
meter in high humidity environments for prolonged periods of time. Doing so can lead to corrosion that could void
the warranty.

BATTERY INSTALLATION AND REPLACEMENT
Use a Phillips head screwdriver to remove the screw from the battery cover. Remove the battery cover by slightly
lifting and sliding the outer edge of the cover away from the meter.
To power the meter, slide the included battery (CR2320) into the battery holder, after removing the battery door
from the meter’s back panel.
The positive side (designated by a “+” sign) should be facing out from the meter circuit board.
NOTE: The battery cradle can be damaged by using an incorrectly sized battery. If the battery cradle is damaged,
the circuit board will need to be replaced and the warranty will be void. To avoid this costly problem, use only a
CR2320 battery.
Battery Removal
Press down on the battery with a screwdriver or similar object. Slide battery out.
If the battery is difficult to move, turn the meter on its side so that the opening for the battery is facing downward
and tap the meter downward against an open palm to dislodge the battery enough so that it can be removed with
your thumb to slide the battery out of the battery holder.

OPERATION AND MEASUREMENT
MQ series quantum meters are designed with a user-friendly interface allowing quick and easy measurements.
Press the power button to activate the LCD display. After two minutes of non-activity the meter will revert
to sleep mode and the display will shut off to conserve battery life.
Press the mode button to access the main menu, where manual or automatic logging are selected, and
where the meter can be reset.
Press the sample button to log a reading while taking manual measurements.
Press the up button to make selections in the main menu. This button is also used to view and scroll
through the logged measurements on the LCD display.
Press the down button to make selections in the main menu. This button is also used to view and scroll
through the logged measurements on the LCD display.
Logging: To choose between manual or automatic logging, push the mode button once and use the up/down
buttons to make the appropriate selection (SMPL or LOG). Once the desired mode is blinking, press the mode
button two more times to exit the menu. When in SMPL mode press the sample button to record up to 99 manual
measurements (a counter in the upper right-hand corner of the LCD display indicates the total number of saved
measurements). When in LOG mode the meter will power on/off to make a measurement every 30 seconds. Every
30 minutes the meter will average the sixty 30 second measurements and record the averaged value to memory.
The meter can store up to 99 averages and will start to overwrite the oldest measurement once there are 99
measurements. Every 48 averaged measurements (making a 24-hour period), the meter will also store an
integrated daily total in moles per meter squared per day (mol m-2 d-1).
Reset: To reset the meter, in either SMPL or LOG mode, push the mode button three times (RUN should be
blinking), then while pressing the down button, press the mode button once. This will erase all the saved
measurements in memory, but only for the selected mode. That is, performing a reset when in SMPL mode will
only erase the manual measurements and performing a reset when in LOG mode will only erase the automatic
measurements.
The LCD display consists of the total number of logged
measurements in the upper right-hand corner, the
real-time PPFD value in the center, and the selected
menu options along the bottom.

Review/Download Data: Each of the logged measurements in either SMPL or LOG mode can be reviewed on the
LCD display by pressing the up/down buttons. To exit and return to the real-time readings, press the sample
button. Note that the integrated daily total values are not accessible through the LCD and can only be viewed by
downloading to a computer.
Downloading the stored measurements will require the AC-100 communication cable and software (sold
separately). The meter outputs data using the UART protocol and requires the AC-100 to convert from UART to
USB, so standard USB cables will not work. Set up instructions and software can be downloaded from the Apogee
website (http://www.apogeeinstruments.com/ac-100-communcation-cable/).

Spectral Error
The combination of diffuser transmittance, interference filter transmittance, and photodetector sensitivity yields
spectral response of a quantum sensor. A perfect photodetector/filter/diffuser combination would exactly match
the defined plant photosynthetic response to photons (equal weighting to all photons between 400 and 700 nm,
no weighting of photons outside this range), but this is challenging in practice. Mismatch between the defined
plant photosynthetic response and sensor spectral response results in spectral error when the sensor is used to
measure radiation from sources with a different spectrum than the radiation source used to calibrate the sensor
(Federer and Tanner, 1966; Ross and Sulev, 2000).
Spectral errors for PPFD measurements made under common radiation sources for growing plants were calculated
for Apogee SQ-100 and SQ-500 series quantum sensors using the method of Federer and Tanner (1966). This
method requires PPFD weighting factors (defined plant photosynthetic response), measured sensor spectral
response (shown in Spectral Response section on page 7), and radiation source spectral outputs (measured with a
spectroradiometer). Note, this method calculates spectral error only and does not consider calibration, directional
(cosine), temperature, and stability/drift errors. Spectral error data (listed in table below) indicate errors less than
5 % for sunlight in different conditions (clear, cloudy, reflected from plant canopies, transmitted below plant
canopies) and common broad spectrum electric lamps (cool white fluorescent, metal halide, high pressure
sodium), but larger errors for different mixtures of light emitting diodes (LEDs) for the SQ-100 series sensors.
Spectral errors for the SQ-500 series sensors are smaller than those for SQ-100 series sensors because the spectral
response of SQ-500 series sensors is a closer match to the defined plant photosynthetic response.
Quantum sensors are the most common instrument for measuring PPFD, because they are about an order of
magnitude lower cost the spectroradiometers, but spectral errors must be considered. The spectral errors in the
table below can be used as correction factors for individual radiation sources.
Spectral Errors for PPFD Measurements with Apogee SQ-100x and SQ-500 Series Quantum Sensors
Radiation Source (Error Calculated Relative to Sun, Clear Sky)
SQ-100X Series
PPFD Error [%]
SQ-500 Series
PPFD Error [%]
Sun (Clear Sky)
0.0
0.0
Sun (Cloudy Sky)
0.2
0.1
Reflected from Grass Canopy
5.0
-0.3
Transmitted below Wheat Canopy
7.0
0.1
Cool White Fluorescent (T5)
7.2
0.1
Metal Halide
6.9
0.9
Ceramic Metal Halide
-8.8
0.3
High Pressure Sodium
3.3
0.1
Blue LED (448 nm peak, 20 nm full-width half-maximum)
14.5
-0.7
Green LED (524 nm peak, 30 nm full-width half-maximum)
29.6
3.2
Red LED (635 nm peak, 20 nm full-width half-maximum)
-30.9
0.8
Red LED (667 nm peak, 20 nm full-width half-maximum)
-56.7
2.8
Red, Blue LED Mixture (80 % Red, 20 % Blue)
-21.2
-3.9
Red, Blue, White LED Mixture (60 % Red, 25 % White, 15 % Blue)
-29.7
-2.0
Cool White LED
7.3
0.5
Warm White LED
-7.8
0.2
Federer, C.A., and C.B. Tanner, 1966. Sensors for measuring light available for photosynthesis. Ecology 47:654-657.
Ross, J., and M. Sulev, 2000. Sources of errors in measurements of PAR. Agricultural and Forest Meteorology
100:103-125.

Yield Photon Flux Density (YPFD) Measurements
Photosynthesis in plants does not respond equally to all photons. Relative quantum yield (plant photosynthetic
efficiency) is dependent on wavelength (green line in figure below) (McCree, 1972a; Inada, 1976). This is due to the
combination of spectral absorptivity of plant leaves (absorptivity is higher for blue and red photons than green
photons) and absorption by non-photosynthetic pigments. As a result, photons in the wavelength range of
approximately 600-630 nm are the most efficient.
One potential definition of PAR is weighting photon flux density in units of mol m-2 s-1 at each wavelength
between 300 and 800 nm by measured relative quantum yield and summing the result. This is defined as yield
photon flux density (YPFD, units of mol m-2 s-1) (Sager et al., 1988). There are uncertainties and challenges
associated with this definition of PAR. Measurements used to generate the relative quantum yield data were made
on single leaves under low radiation levels and at short time scales (McCree, 1972a; Inada, 1976). Whole plants
and plant canopies typically have multiple leaf layers and are generally grown in the field or greenhouse over the
course of an entire growing season. Thus, actual conditions plants are subject to are likely different than those the
single leaves were in when measurements were made by McCree (1972a) and Inada (1976). In addition, relative
quantum yield shown in the figure above is the mean from twenty-two species grown in the field (McCree, 1972a).
Mean relative quantum yield for the same species grown in growth chambers was similar, but there were
differences, particularly at shorter wavelengths (less than 450 nm). There was also some variability between
species (McCree, 1972a; Inada, 1976).
McCree (1972b) found that equally weighting all photons between 400 and 700 nm and summing the result,
defined as photosynthetic photon flux density (PPFD, in units of mol m-2 s-1), was well correlated to
photosynthesis, and very similar to correlation between YPFD and photosynthesis. As a matter of practicality, PPFD
is a simpler definition of PAR. At the same time as McCree’s work, others had proposed PPFD as an accurate
measure of PAR and built sensors that approximated the PPFD weighting factors (Biggs et al., 1971; Federer and
Tanner, 1966). Correlation between PPFD and YPFD measurements for several radiation sources is very high (figure
below), as an approximation, YPFD = 0.9PPFD. As a result, almost universally PAR is defined as PPFD rather than
YPFD, although YPFD has been used in some studies. The only radiation sources shown (figure below) that don’t
fall on the regression line are the high pressure sodium (HPS) lamp, reflection from a plant canopy, and
transmission below a plant canopy. A large fraction of radiation from HPS lamps is in the red range of wavelengths
where the YPFD weighting factors (measured relative quantum yield) are at or near one. The factor for converting
PPFD to YPFD for HPS lamps is 0.95, rather than 0.90. The factor for converting PPFD to YPFD for reflected and
transmitted photons is 1.00.
Defined plant response to
photons (black line, weighting
factors used to calculate PPFD),
measured plant response to
photons (green line, weighting
factors used to calculate YPFD),
and SQ-500 series quantum
sensor response to photons
(sensor spectral response).

photosynthesis. Ecology 47:654-657.
Inada, K., 1976. Action spectra for photosynthesis in higher plants. Plant and Cell Physiology 17:355-365.
McCree, K.J., 1972a. The action spectrum, absorptance and quantum yield of photosynthesis in crop plants.
Agricultural Meteorology 9:191-216.
McCree, K.J., 1972b. Test of current definitions of photosynthetically active radiation against leaf photosynthesis
data. Agricultural Meteorology 10:443-453.
Correlation between
photosynthetic photon flux
density (PPFD) and yield photon
flux density (YPFD) for multiple
different radiation sources. YPFD
is approximately 90 % of PPFD.
Measurements were made with
a spectroradiometer (Apogee
Instruments model PS-200) and
weighting factors shown in the
previous figure were used to
calculate PPFD and YPFD.
Biggs, W., A.R. Edison, J.D. Eastin, K.W. Brown, J.W. Maranville, and M.D. Clegg, 1971. Photosynthesis light sensor
and meter. Ecology 52:125-131.
Federer, C.A., and C.B. Tanner, 1966. Sensors for measuring light available for photosynthesis. Ecology 47:654-657.
Inada, K., 1976. Action spectra for photosynthesis in higher plants. Plant and Cell Physiology 17:355-365.
McCree, K.J., 1972a. The action spectrum, absorptance and quantum yield of photosynthesis in crop plants.
Agricultural Meteorology 9:191-216.
McCree, K.J., 1972b. Test of current definitions of photosynthetically active radiation against leaf photosynthesis
data. Agricultural Meteorology 10:443-453.
Sager, J.C., W.O. Smith, J.L. Edwards, and K.L. Cyr, 1988. Photosynthetic efficiency and phytochrome photoequilibria
determination using spectral data. Transactions of the ASAE 31:1882-1889.

APOGEE AMS SOFTWARE
Downloading data to a computer requires the AC-100 communication cable and the free ApogeeAMS software.
The meter outputs data using the UART protocol and requires the AC-100 to convert from UART to USB, so
standard USB cables will not work.
The most recent version of ApogeeAMS software can be downloaded at
http://www.apogeeinstruments.com/downloads/.
When the ApogeeAMS software is first opened, it will
show a blank screen until communication with the meter
is established. If you click “Open Port” it will say
“connection failed.”
To establish communication, make sure the meter is
plugged into your computer using the AC-100
communication cable. To connect click the dropdown
menu button and “COM#” options will appear. For more
details on how to figure out which COM is the right one,
watch our video.
When you have connected to the correct COM#, the
software will say “Connected”.
Click “Sample Data” to view saved sample readings.

“Daily Totals” shows all of the saved Daily Light Integral
(DLI) totals per day.
Click “30 Min Avg” to see the meter’s 99, 30-minute
averages.
To analyze the data, click on “File” and “Save As” to save
the data as a .csv file.
Or, you can highlight the numbers, copy, and paste them
into a blank Excel spreadsheet. Data will need to be
comma delimited.

MAINTENANCE AND RECALIBRATION
Blocking of the optical path between the target and detector can cause low readings. Occasionally, accumulated
materials on the diffuser of the upward-looking sensor can block the optical path in three common ways:
1. Moisture or debris on the diffuser.
2. Dust during periods of low rainfall.
3. Salt deposit accumulation from evaporation of sea spray or sprinkler irrigation water.
Apogee Instruments upward-looking sensors have a domed diffuser and housing for improved self-cleaning from
rainfall, but active cleaning may be necessary. Dust or organic deposits are best removed using water, or window
cleaner, and a soft cloth or cotton swab. Salt deposits should be dissolved with vinegar and removed with a cloth
or cotton swab. Salt deposits cannot be removed with solvents such as alcohol or acetone. Use only gentle
pressure when cleaning the diffuser with a cotton swab or soft cloth to avoid scratching the outer surface. The
solvent should be allowed to do the cleaning, not mechanical force. Never use abrasive material or cleaner on the
diffuser.
Although Apogee sensors are very stable, nominal accuracy drift is normal for all research-grade sensors. To
ensure maximum accuracy, we generally recommend sensors are sent in for recalibration every two years,
although you can often wait longer according to your particular tolerances.
To determine if a specific sensor needs recalibration, the Clear Sky Calculator (www.clearskycalculator.com)
website and/or smartphone app can be used to indicate PPFD incident on a horizontal surface at any time of day at
any location in the world. It is most accurate when used near solar noon in spring and summer months, where
accuracy over multiple clear and unpolluted days is estimated to be ± 4 % in all climates and locations around the
world. For best accuracy, the sky must be completely clear, as reflected radiation from clouds causes incoming
radiation to increase above the value predicted by the clear sky calculator. Measured PPFD can exceed PPFD
predicted by the Clear Sky Calculator due to reflection from thin, high clouds and edges of clouds, which enhances
incident PPFD. The influence of high clouds typically shows up as spikes above clear sky values, not a constant
offset greater than clear sky values.
To determine recalibration need, input site conditions into the calculator and compare PPFD measurements to
calculated PPFD for a clear sky. If sensor PPFD measurements over multiple days near solar noon are consistently
different than calculated PPFD (by more than 6 %), the sensor should be cleaned and re-leveled. If measurements
are still different after a second test, email calibration@apogeeinstruments.com to discuss test results and
possible return of sensor(s).

Homepage of the Clear Sky
Calculator. Two calculators are
available: one for quantum sensors
(PPFD) and one for pyranometers
(total shortwave radiation).
Clear Sky Calculator for quantum
sensors. Site data are input in blue
cells in middle of page and an
estimate of PPFD is returned on
right-hand side of page.
/