Page is loading ...

APOGEE INSTRUMENTS, INC. | 721 WEST 1800 NORTH, LOGAN, UTAH 84321, USA
TEL: (435) 792-4700 | FAX: (435) 787-8268 | WEB: APOGEEINSTRUMENTS.COM
Copyright © 2022 Apogee Instruments, Inc.
OWNER’S MANUAL
SPECTRORADIOMETER
Models SS-110 and SS-120
Rev: 31-Aug-2022

TABLE OF CONTENTS
Owner’s Manual ............................................................................................................................................................................... 1
Certificates of Compliance ....................................................................................................................................................... 3
Introduction ............................................................................................................................................................................. 5
Sensor Models ......................................................................................................................................................................... 6
Specifications ........................................................................................................................................................................... 7
Deployment and Installation .................................................................................................................................................. 10
Operation and Measurement ................................................................................................................................................ 13
Maintenance and Recalibration ............................................................................................................................................. 18
Troubleshooting and Customer Support ................................................................................................................................ 19
Return and Warranty Policy ................................................................................................................................................... 20

CERTIFICATE OF COMPLIANCE
EU Declaration of Conformity
This declaration of conformity is issued under the sole responsibility of the manufacturer:
Apogee Instruments, Inc.
721 W 1800 N
Logan, Utah 84321
USA
for the following product(s):
Models: SS-110 and SS-120
Type: Spectroradiometer
The object of the declaration described above is in conformity with the relevant Union harmonization legislation:
2014/30/EU Electromagnetic Compatibility (EMC) Directive
2011/65/EU Restriction of Hazardous Substances (RoHS 2) Directive
2015/863/EU Amending Annex II to Directive 2011/65/EU (RoHS 3)
Standards referenced during compliance assessment:
EN 61326-1:2013 Electrical equipment for measurement, control, and laboratory use – EMC requirements
EN 63000:2018 Technical documentation for the assessment of electrical and electronic products with
respect to the restriction of hazardous substances
Please be advised that based on the information available to us from our raw material suppliers, the products
manufactured by us do not contain, as intentional additives, any of the restricted materials including lead (see
note below), mercury, cadmium, hexavalent chromium, polybrominated biphenyls (PBB), polybrominated
diphenyls (PBDE), bis (2-ethylhexyl) phthalate (DEHP), butyl benzyl phthalate (BBP), dibutyl phthalate (DBP), and
diisobutyl phthalate (DIBP). However, please note that articles containing greater than 0.1 % lead concentration
are RoHS 3 compliant using exemption 6c.
Further note that Apogee Instruments does not specifically run any analysis on our raw materials or end products
for the presence of these substances, but we rely on the information provided to us by our material suppliers.
Signed for and on behalf of:
Apogee Instruments, August 2022
Bruce Bugbee
President
Apogee Instruments, Inc.

CERTIFICATE OF COMPLIANCE
UK Declaration of Conformity
This declaration of conformity is issued under the sole responsibility of the manufacturer:
Apogee Instruments, Inc.
721 W 1800 N
Logan, Utah 84321
USA
for the following product(s):
Models: SS-110 and SS-120
Type: Spectroradiometer
The object of the declaration described above is in conformity with the relevant UK Statutory Instruments and
their amendments:
2016 No. 1091 The Electromagnetic Compatibility Regulations 2016
2012 No. 3032 The Restriction of the Use of Certain Hazardous Substances in Electrical and Electronic
Equipment Regulations 2012
Standards referenced during compliance assessment:
BS EN 61326-1:2013 Electrical equipment for measurement, control, and laboratory use – EMC requirements
BS EN 63000:2018 Technical documentation for the assessment of electrical and electronic products with
respect to the restriction of hazardous substances
Please be advised that based on the information available to us from our raw material suppliers, the products
manufactured by us do not contain, as intentional additives, any of the restricted materials including lead (see
note below), mercury, cadmium, hexavalent chromium, polybrominated biphenyls (PBB), polybrominated
diphenyls (PBDE), bis (2-ethylhexyl) phthalate (DEHP), butyl benzyl phthalate (BBP), dibutyl phthalate (DBP), and
diisobutyl phthalate (DIBP). However, please note that articles containing greater than 0.1 % lead concentration
are RoHS 3 compliant using exemption 6c.
Further note that Apogee Instruments does not specifically run any analysis on our raw materials or end products
for the presence of these substances, but we rely on the information provided to us by our material suppliers.
Signed for and on behalf of:
Apogee Instruments, August 2022
Bruce Bugbee
President
Apogee Instruments, Inc.

INTRODUCTION
Spectral (i.e., wavelength-dependent) radiation is intensity of output from a radiation source (e.g., sun, electric
lamp, reflected radiation from a surface of interest) as a function of wavelength. Radiation spectra vary for
different radiation sources and conditions. Radiation spectra can be used to characterize radiation sources.
Spectrometers measure relative spectral radiation over a specified wavelength range. Spectroradiometers are
spectrometers calibrated to output spectral measurements in absolute units (e.g., energy flux density in W m-2 nm-
1 or photon flux density in µmol m-2 s-1 nm-1).
Typical applications of spectroradiometers include measurement of spectral output from radiation sources used to
grow plants, algae, and corals (e.g., in greenhouses, growth chambers, and aquariums), measurement of solar
spectra with changing atmospheric conditions, and measurement of spectral reflectance on stationary (e.g.,
agricultural or ecological weather stations and flux towers) and mobile (e.g., plant phenotyping) platforms.
Apogee Instruments model SS-110 (340 to 820 nm measurement range) and SS-120 (635 to 1100 nm
measurement range) spectroradiometers are small, lightweight units designed for laboratory and field use. Each
spectroradiometer consists of a spectrometer (slit, diffraction grating, detector array), fiber optic, and diffuser
mounted in an anodized aluminum housing. Each unit is calibrated to provide spectral measurements in absolute
units. Onboard circuitry allows for output to a computer (via USB).

SENSOR MODELS
This manual covers Apogee model SS-110 (340 to 820 nm measurement range) and SS-120 (635 to 1100 nm
measurement range) spectroradiometers.
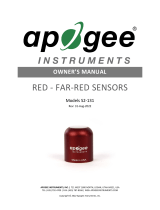
A sensor’s model number and serial number are
located on the back of the sensor.

SPECIFICATIONS
Irradiance Calibration Traceability
Apogee SS series spectroradiometers are calibrated with a LI-COR model 1800-02 Optical Radiation Calibrator
using a 200 W quartz halogen lamp. The 1800-02 and quartz halogen lamp are traceable to the National Institute
of Standards and Technology (NIST).
SS-110
SS-120
Wavelength Range
340 to 820 nm
635 to 1100 nm
Wavelength Measurement Interval
1.0 nm
Wavelength Resolution
3.0 nm (full width half maximum)
Wavelength Accuracy
± 0.5 nm
Wavelength Repeatability
± 0.2 nm
Analog to Digital Resolution
14 bit
Signal to Noise Ratio
1500:1 (at maximum signal)
Stray Light
≤ 0.25 % at 590 nm
≤ 0.25 % at 850 nm
Dark Noise
≤ 3 counts
Integration Time Range
10 ms to 10 s
Linearity
Less than 1 %
Measurement Sensitivity
Greater than 10 % of max sensitivity for
wavelengths greater than 380 nm
(see Sensitivity graph below)
Greater than 10 % of max sensitivity
for wavelengths less than 1030 nm
(see Sensitivity graph below)
Measurement Repeatability
Less than 1.0 % (wavelengths greater than
400 nm)
Less than 1.0 % (wavelengths less than
1020 nm)
Directional (Cosine) Response
± 5 at 75º zenith angle
Fields of View
180° (upward-facing); 25° or 150° (downward-facing)
Operating Environment
-20 to 70 C, 0 to 100 % relative humidity
Temperature Response
-0.1 ± 0.1 % per C
Irradiance Calibration Uncertainty
(see Irradiance Calibration
Traceability below)
± 5 %
Current Draw
190 mA during measurement and when idle (USB)
Power Requirement
1 W (USB)
Interface Cable
5 m PVC jacket with USB (for computer)
Software
Apogee Spectrovision (windows compatible, XP and later; Mac compatible, 10.9 and
later)
Operating Environment
-20 to 70 C, 0 to 100 % relative humidity
Thread Size (for Mounting)
¼”-20
Dimensions
89.3 mm height, 50.8 mm width, 38.1 mm depth
Mass
300 g
Warranty
1 year against defects in materials and workmanship

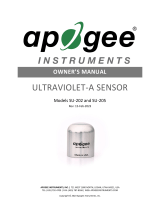
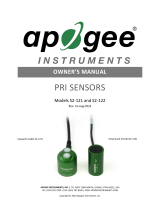
SS-110 Sensitivity
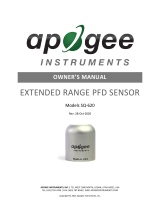
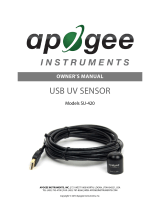
SS-120 Sensitivity
Sensitivity was determined by collecting
spectra under a quartz halogen lamp with
an NIST traceable calibration and
calculating the ratio of counts measured
with the spectrometer to energy flux
density from the lamp. Maximum
sensitivity of the SS-110 is near 600 nm.
Sensitivity of the SS-110 is at least 10 % of
the maximum value at all wavelengths
greater than 380 nm.
Sensitivity was determined by collecting
spectra under a quartz halogen lamp with
an NIST traceable calibration and
calculating the ratio of counts measured
with the spectrometer to energy flux
density from the lamp. Maximum
sensitivity of the SS-120 is near 750 nm.
Sensitivity of the SS-120 is at least 10 % of
the maximum value at all wavelengths
less than 1030 nm.

Dimensions

DEPLOYMENT AND INSTALLATION
MOUNTING
Upward-facing: Mount the sensor to a solid surface with the nylon mounting screw provided. To accurately
measure energy flux density or photon flux density incident on a horizontal surface, the sensor must be level. An
Apogee Instruments model AL-200 leveling plate is recommended for this purpose. To facilitate mounting on a
cross arm, an Apogee Instruments model AM-110 mounting bracket is recommended.
Downward-facing: To facilitate mounting on a cross arm, and Apogee Instruments model AM-210 mounting
bracket is recommended.
To minimize azimuth error, the sensor should be mounted with the cable pointing toward true north in the
northern hemisphere or true south in the southern hemisphere. Azimuth error is typically less than 1 %, but it is
easy to minimize by proper cable orientation.
In addition to orienting the cable to point toward the nearest pole, the sensor should also be mounted such that
obstructions (e.g., weather station tripod/tower or other instrumentation) do not shade the sensor. Once
mounted, the green cap should be removed from the sensor. The green cap can be used as a protective covering
for the sensor when it is not in use.

SOFTWARE INSTALLATION (REQUIRED TO USE WITH A COMPUTER)
The most recent version of ApogeeSpectrovision software can be downloaded at
http://www.apogeeinstruments.com/downloads/.
Installing the software on a PC (Windows compatible, XP and later)
1. Install Apogee Spectrovision software: Double click the
setup.exe file provided on the thumb drive (you may
need to copy the file to your computer first). Run the
downloaded setup file, following the prompts to
complete software installation.
*Note: In the final setup window there will be a box checked that
says “Launch Driver Installation”. This box must be checked.
2. Install Drivers: You will be automatically prompted to install
device software drivers (dpinst.exe). Click next to begin the
installation process and follow the prompts.
3. Plug sensor into computer *Note: It may take up to 30 seconds for the computer to recognize the device
each time it is plugged into the computer.
4. Wait for 30-60 seconds while drivers associate with the device. This will happen automatically.
5. Open Apogee Spectrovision Software
6. Connect Sensor: In the “File Menu” click “Connect” to connect sensor.
Sensor will now be visible in the “Tool Bar” and is ready for use.
7. All of the available software buttons and controls are documented in the
“Help Menu”, where information regarding uses and limitations of each
button/control is provided.
**Note** Windows XP users may need to install additional language options for some of the characters to display
properly in Apogee Spectrovision. To do this go to Control Panel->Regional and Language Options. Click the
Languages tab. In the box labeled supplemental language support, install both options. The software doesn’t care
if these are installed or not; it’s simply user preference.

Installing the software on a Mac (Mac compatible, 10.10 and later)
1. Double click on the installer package
2. On the ‘Introduction’ screen, please click ‘Continue’ to proceed.
3. Select ‘Continue’ on the ‘Read Me’ screen to continue. This screen contains a history of updates made to
the ApogeeSpectrovision software versions.
4. Select ‘Continue’ on the ‘License’ screen to receive a prompt to agree to the terms of the software license
agreement. Click ‘Agree’ to continue once you receive the prompt.
5. On the ‘Installation Type’ screen, click ‘Install’ to install the software. You can change the location the
software installs to by clicking ‘Change Install Location…’. *Note: You may be prompted for an
administrator password at this time. If you are, proceed by entering your respective password and clicking
‘Install Software’.
6. Once you receive the message “The installation was successful” on the ‘Summary’ screen click ‘Close’.
Your software is now ready to be used.

OPERATION AND MEASUREMENT
SS-100 series spectroradiometers have onboard circuitry which allows for output to a computer (via USB).
COMPUTER OUTPUT (VIA USB)
MENU DESCRIPTIONS
FILE MENU
Data Capture: The data capture feature allows for a functional data logging
environment. The user may choose a specific number of measurements to record or
leave it open ended by leaving the default value of 0 in the spin control. The user may specify a waiting period
between measurements or if left at zero, the device will take measurements as soon as data has been pulled from
memory. If 'Save data to file' is checked, the user will be prompted to enter a file name. If a previously created file
is chosen, the data capture function will append new data to the end of the file. A different file must be chosen for
each sensor currently connected to Apogee Spectrovision. If 'Plot data to screen' is checked, the data capture
function will plot the first ten measurements of the file specified during data capture setup. If multiple sensors are
connected and there are less than ten measurements in the first file, the next file will be read from until a max of
10 measurements have been accumulated for plotting. The data capture mode may be canceled at any time by
hitting the 'Cancel' button. Any measurements made before hitting the 'Cancel' button will still be saved in the files
specified during setup.
Connect: This features connects to a sensor plugged in to the computers USB port. If more than one sensor is
connected, the user will select which sensor to connect to from a dropdown menu.
Disconnect: Disconnect from the device chosen from the dropdown menu.
Red/Far Red Setup: Displays a window in which the user can specify the wavelength ranges of the Red and Far Red
spectrums. The ratio R/RF (Red/Far Red) is displayed during Energy Flux Density and Photon Flux Density plot
modes.
Exit: Close the application.
Note: Pressing the alt key while the application is
open will display hot key values for menu bar options.
For example, alt --> f --> c will select the Connect
function in the File menu.

VIEW MENU
Each option in this menu will switch the current plot mode to the one specified in the
drop down menu. If continuous measurement mode is active, the next measurement
taken will take on the new plot mode. Otherwise, a single measurement will be taken
and plotted to the screen in the new plot mode.
HELP MENU
Jump to the help tab of the chosen subject.
TOOLBAR DESCRIPTIONS
Set dark reference: During continuous measurement mode, this function will take the data from the last
scan and save it as a dark reference to be used during both Relative and Reflectance/Transmittance plot
modes. Otherwise, the application will take a new measurement to be used as the dark reference. If multiple
devices are connected, the dark reference scan will apply only to the device selected in the toolbar.
Set light reference: During continuous measurement mode, this function will take the data from the last
scan and save it as a light reference to be used during Reflectance/Transmittance plot mode. Otherwise,
the application will take a new measurement to be used as the light reference. If multiple devices are connected,
the light reference scan will apply only to the device selected in the toolbar.
Clear dark reference: Simply removes a saved dark reference scan from the selected device.
Open: Opens a previously saved *.dat or *.csv file for plotting. This function supports opening multiple
files at a time; however, only ten scans may be plotted at a time. These files must be saved in the correct
format to be compatible with Apogee Spectrovision.
Save graph as image: The current plot will be saved to an image file with the extension of your choice.
Current supported extensions include *.pdf, *.jpg, *.png, *.ps, *.eps, and *.svg.
Save graph data: The data of the current plot will be saved to a file of type *.csv or *.dat. This function
supports multi sensor plots as well.

Save graph data and image: Combines the previous two buttons in one for ease of use.
Copy graph to clipboard: Copies the current plot to the system clipboard for pasting into other
applications. The clipboard object is of type *.png.
Plot the first derivative: Plots the first derivative of the current plot data. This button is only active if a
single device is connected.
Plot the second derivative: Plots the second derivative of the current plot data. This button is only active if
a single device is connected.
Take a single measurement: The device will take a single measurement and plot the data to the screen.
This is a convenience function for manipulating the plot without the data being updated at an inopportune
time.
Start continuous measurements: The device will continually take measurements as soon as the data has
been pulled from the previous scan. If multiple sensors are connected, measurements will wait until data
has been pulled from all devices so that all measurements are taken at the same time.
Pause continuous measurements: This simply pauses the continuous measurement mode. Use this
function if you are worried about losing the data from the last scan but want to manipulate the currently
displayed plot that may or may not represent the data from the last scan.
Stop continuous measurements: This completely stops continuous measurements without regard to data
being left in the device's buffer.
Sensor toggles: When a device is connected, a new toggle button will be displayed on the
toolbar representing the sensor. If the sensor is toggled, it is considered 'active' and all 'Set dark
reference', 'Set light reference', and 'Clear dark reference' button clicks will apply only to the
'active' device. Right clicking on the device toggle button will display a pop up menu with options to rename the
device or disconnect the device.

LEFT PANEL/STATUS BAR
Integration Time: This specifies the time frame the sensor is to use for integrating the
received radiation. A longer integration time will give a greater signal. If the auto-
integration toggle button is pressed, the device will specify its own integration time
based on the received light intensity. Auto-integration will max out at 2 sec. For integration times greater than 2
sec, toggle Auto-Integration off and enter the desired time in the spin ctrl box. The Apogee Visible and NIR sensors
support 0.005 - 10 second integration times. The last scans integration time will be displayed in the status bar at
the bottom of the screen.
Number of Scans to Average: This tells the device how many measurements to average
together before outputting data.
Relative: Plots wavelength intensity as raw digital counts.
Reflectance/Transmittance: Plots the reflectance or transmittance of a material. First
requires that both a dark and light reference have been saved.
Energy Flux Density: Plots in units of Watts/m2 * nm. This mode will also display an
integrated total over the given Integration Range from the left panel.
Photon Flux Density: Plots in units of µmol/m2*s*nm. This mode will also display an
integrated total over the given Integration Range from the left panel, as well as YPF, PPF,
and PPE values.
Illuminance: Plots a weighted data range in Lux or Footcandle according to user
preference.
Integration Range: These spin controls become active during Energy Flux Density and
Photon Flux Density plot modes and are used to specify a customized wavelength
integration range for the Integrated Total displayed on the plot. The YPF, PPF, and PPE
values remain unchanged regardless of the Integration Range values. These controls are inactive for the other plot
modes.
Fractional Range: These spin controls become active during Energy Flux Density and
Photon Flux Density modes. A 'Fractional' ratio is displayed on the graph. This ratio is
the sum of the wavelengths specified in the Fractional Range spin controls divided by
the sum of the wavelengths specified in the Integration Range spin controls.
Axes Limits: These controls are inactive if the Auto Scale toggle button is active. The y axis
has limits of (-16383, 16383) and the x axis has limits of (300, 1120). Any value in between
may be specified with an accuracy of two decimal places.

Auto Scale: Automatically scales the plot to include all data points. Can be toggled on or
off.
Map Color Range: Fills the area beneath the plot with the wavelength's corresponding
color values. Can be toggled on or off. Keep toggled off to increase performance. This
feature is disabled for multi-sensor/multi-line plots.
Reset Plot: Resets the plot to original data with a generalized zoom range. Derivative
data will be cleared as well. If Auto Scale or Map Color Range toggles have changed since
last plot, the new settings will be applied.
Show Average: This toggle button becomes active only if multiple lines are plotted at the
same time either from a file, or from the Take a single measurement button in the
toolbar. If this toggle is active, a thick black line will be plotted with the rest of the data representing the average.
Status Bar: The first section on the far left displays tool tips when
the cursor is over a menu bar option. The next section displays
the currently active operation. The next section shows the active
device's last integration time. The far right section of the status
bar displays the current coordinates of the cursor in the plot area.
PLOTVIEW
Home: Resets the plot zoom/pan position to the original position (before any other plot view button
modifications).
Back: Goes back to the previous view.
Forward: Goes forward (if possible) to the next view.
Pan: The 'Pan' toggle button allows the user to left click and drag to pan the plot. If the right button is clicked,
the plot will scale in the direction of the drag instead of pan.
Zoom: The zoom tool left click and drag will draw a zoom box in the plot area. Right click and drag will zoom
out.
Plot Area Controls: A left click in the plot area will display the y-value of the plot near the data point and the
corresponding x-value along the x-axis. A right click in the plot area will remove any labels displayed by a left-click.
Scrolling in the plot area will zoom in or out depending on scroll direction.

MAINTENANCE AND RECALIBRATION
MAINTENANCE
Moisture or debris on the diffuser is a common cause of low readings. The sensor has a domed diffuser and
housing for improved self-cleaning from rainfall, but materials can accumulate on the diffuser (e.g., dust during
periods of low rainfall, salt deposits from evaporation of sea spray or sprinkler irrigation water) and partially block
the optical path. Dust or organic deposits are best removed using water, or window cleaner and a soft cloth or
cotton swab. Salt deposits should be dissolved with vinegar and removed with a soft cloth or cotton swab. Never
use an abrasive material or cleaner on the diffuser.
Although Apogee sensors are very stable, nominal accuracy drift is normal for all research-grade sensors. To
ensure maximum accuracy, we generally recommend sensors are sent in for recalibration every two years,
although you can often wait longer according to your particular tolerances.
Recalibration
The Clear Sky Calculator (www.clearskycalculator.com) can be used to determine the need for spectroradiometer
recalibration when spectroradiometer is used in Photon Flux Density mode. It determines PPFD incident on a
horizontal surface at any time of day at any location in the world. It is most accurate when used near solar noon in
spring and summer months, where accuracy over multiple clear and unpolluted days is estimated to be ± 4 % in all
climates and locations around the world. For best accuracy, the sky must be completely clear, as reflected
radiation from clouds causes incoming radiation to increase above the value predicted by the clear sky calculator.
Measured values of PPFD can exceed values predicted by the Clear Sky Calculator due to reflection from the sides
and edges of clouds. This reflection increases the incoming radiation. The influence of high clouds typically shows
up as spikes above clear sky values, not a constant offset greater than clear sky values.
To determine recalibration need, input site conditions into the calculator and compare PPFD measurements to
calculated PPFD values for a clear sky. If sensor PPFD measurements over multiple days near solar noon are
consistently different than calculated values (by more than 6 %), the sensor should be cleaned and re-leveled. If
PPFD measurements are still different after a second test, email calibration@apogeeinstruments.com to discuss
test results and possible return of sensor(s) for recalibration.

TROUBLESHOOTING AND CUSTOMER SUPPORT
VERIFICATION OF FUNCTIONALITY
The simplest way to verify functionality is to connect to the device with a computer. Once the software and drivers
are installed, connect the USB cable to the spectroradiometer and to the computer, wait thirty to sixty seconds for
the drivers to associate with the device, open the software, connect to the device (click Connect in the File menu),
and push the play button on the toolbar. The spectrum displayed on the computer screen should now update
automatically. This indicates the device is communicating with the computer and measuring a spectrum.
COMPATIBLE MEASUREMENT DEVICES
For use with a computer, USB 2.0 or later is required. Windows and Mac versions of Apogee Spectrovision
software are available.

RETURN AND WARRANTY POLICY
RETURN POLICY
Apogee Instruments will accept returns within 30 days of purchase as long as the product is in new condition (to be
determined by Apogee). Returns are subject to a 10 % restocking fee.
WARRANTY POLICY
What is Covered
All products manufactured by Apogee Instruments are warranted to be free from defects in materials and craftsmanship
for a period of four (4) years from the date of shipment from our factory. To be considered for warranty coverage an
item must be evaluated by Apogee.
Products not manufactured by Apogee (spectroradiometers, chlorophyll content meters, EE08-SS probes) are covered
for a period of one (1) year.
What is Not Covered
The customer is responsible for all costs associated with the removal, reinstallation, and shipping of suspected warranty
items to our factory.
The warranty does not cover equipment that has been damaged due to the following conditions:
1. Improper installation, use, or abuse.
2. Operation of the instrument outside of its specified operating range.
3. Natural occurrences such as lightning, fire, etc.
4. Unauthorized modification.
5. Improper or unauthorized repair.
Please note that nominal accuracy drift is normal over time. Routine recalibration of sensors/meters is considered part of
proper maintenance and is not covered under warranty.
Who is Covered
This warranty covers the original purchaser of the product or other party who may own it during the warranty period.
What Apogee Will Do
At no charge Apogee will:
1. Either repair or replace (at our discretion) the item under warranty.
2. Ship the item back to the customer by the carrier of our choice.
Different or expedited shipping methods will be at the customer’s expense.
/